Introduction and Background
In four-dimensional computed tomography (4DCT) images correlated with the patient’s respiratory motion are obtained for the full breathing cycle and subsequently binned into phases. Additional datasets can also be generated: the maximum intensity projection (MIP—the maximum value of voxel through all phases) and the average intensity projection (AVIP—the average across all phases).
Target delineation can be performed across all phases, but it is more commonly done on the maximum inhale and exhale phases as well as the MIP. This has been shown to adequately account for motion.Reference Rietzel, Liu and Doppke1,Reference Bradley, Nofal and El Naqa2 However, only a single dataset can be used for dose calculation. Many use the AVIP for dose calculation and evaluation of coverage of the target and doses to organs at risk.Reference Admiraal, Schuring and Hurkmans3,Reference Ehler and Tomé4 As the AVIP spreads the extent of the gross tumour volume (GTV) over the breathing cycle, the edges of the ‘target’ are of lower density in the AVIP than they are in any given phase.
The purpose of this study is to compare dosimetric metrics from treatment plans generated on an AVIP dataset with the same metrics evaluated on the same plan calculated on each phase of the 4DCT for a series of patients with locally advanced non-small-cell lung cancer (LA-NSCLC). The aim is to establish whether the practice of reviewing dose distributions from an AVIP using conventional treatment planning evaluation parameters is valid. A number of authorsReference Han, Basran and Cheung5,Reference Oechsner, Odersky, Berndt, Combs, Wilkens and Duma6 have investigated this in stereotactic body radiation therapy (SBRT) but, to our knowledge, this has not been assessed in LA-NSCLC which has larger target volumes and different patterns of intrafraction motion. Furthermore, we want to determine if it is reasonable to use AVIP data to model tumour control probability (TCP), and if there are potential situations where the coverage on a single dataset deviates significantly from that on the AVIP and may warrant evaluation on the individual phases. Thus, the relevant metrics are evaluated from two perspectives: the spread of the value of a given metric across the phases and how closely the mean value obtained across all phases is correlated with the AVIP.
Materials and Methods
Nine patients (four females and five males) with LA-NSCLC were chosen for this prospective study. Seven of the patients had both primary and nodal targets, two had primary target volumes only. Their 4DCT datasets were binned into ten phases and the MIP and AVIP generated. Primary tumours were graded as either T2 or T3. These patients are representative of the LA-NSCLC population seen in our clinic. An internal gross tumour volume (iGTVsum) defined on the AVIP is the sum of the GTV over a minimum of three datasets: maximum inspiration (usually 0%), maximum expiration (usually 50%) and MIP, with review over all phases. An iGTV to internal clinical target volume (iCTV) margin of 6 mm (squamous cell carcinoma) or 8 mm (adenocarcinoma)Reference Giraud, Antoine and Larrouy7 was used with a further 5 mm to define the planning target volume (PTV), for both primary and nodal volumes. For this study, the GTV was redrawn on each dataset by a single radiation oncologist with reference to the originally delineated volumes. CTV was created and curtailed to lie within the original iCTV (to minimise delineation uncertainty). The combined lung volume was auto-contoured in the contouring workspace of the Eclipse treatment planning system across all ten datasets.
Volumetric modulated arc therapy (VMAT) plans were generated on the AVIP for each patient with a prescription of 60 Gy in 20 fractions in Eclipse V11 or V13 (Varian Medical Systems, Palo Alto, CA, USA) with Analytical Anisotropic Algorithm (AAA) V11 and a 0·25 cm calculation grid. Each plan was normalised to a median of 60 Gy to the PTV. The plan created on the AVIP was recalculated with Acuros XB (AXB) (0·1 cm grid and dose to medium) on both the AVIP and on each phase. AXB was chosen as it is more accurate in boundary regionsReference Fogliata, Nicolini, Clivio, Vanetti and Cozzi8,Reference Han, Mikell, Salehpour and Mourtada9 where the biggest differences between the AVIP and any given phase would be expected. All comparisons in this work are between the AXB calculated plans.
Target volume across each dataset was recorded along with a number of parameters including D 98% (dose to 98 % of the volume, reported in Gy), D 2% and D 50%. Dose-volume histograms (DVHs) for the CTVs for each phase in addition to the iCTV from the AVIP were exported and the TCPs calculated. For combined lungs, the volume across each phase and a number of metrics including V 25Gy (volume receiving 25 Gy, reported in %), V 20Gy, V 5Gy and mean lung dose (MLD) were extracted. The spinal cord maximum dose (D max) was recorded. The TCP was calculated using Equation 1 (Marsden model)Reference Nahum and Sanchez-Nieto10 via radiobiological software (BioSuite V12) with an overall treatment time of 26 days and radiobiological parameters from the literature (Table 1).Reference Nahum, Uzan, Malik and Baker11,Reference Webb12
 $$\eqalign{ {TCP = {{1}\over{{{\sigma _\alpha }\sqrt {2\pi }} }}\mathop} \cr {\vint \limits_0^\infty} \left( {\mathop \prod \limits_i {\rm{exp}}\left\{ { - \rho {V_i}{\rm{exp}}\left[ { - \alpha {D_i}\left( {1 + {{\beta }\over{\alpha} }{d_i}} \right)} \cr \left + \gamma \,{\rm{max}}\left( {{T_0} - {T_k},0} \right) \bigg] \right\}} \right)}}\cr {\rm{exp}}\left[ { - \frac{{{{{\left( {\alpha - \overline \alpha } \right)}^2}}}\over{{2\sigma _\alpha ^2}}} \bigg]d\alpha $$
where ρ = clonogenic cell density; V i = volume in a given voxel i; D i = total dose in voxel i; d i = dose per fraction in a given voxel i; α and β = radiosensitivity parameters; γ = repopulation constant; T 0 = total treatment time; T k = kick-off time for repopulation. The terms the start and end of the equation are to account for a normal distribution of α values across the population and result in a broadening of the tumour control probability (TCP) distribution.
Tumour control probability (TCP) parameters: α and β = radiosensitivity parameters; σ α = standard deviation of α; ρ = clonogenic cell density; γ = repopulation constant; T k = kick-off time for repopulation

Statistical Analysis
A Bland–Altman analysis was used to describe an agreement between AVIP and the mean across all phases.Reference Bland and Altman13 This method is used to assess the agreement between two quantitative measurements. There is no p-value available to describe this agreement but rather a ‘quality control’ concept. The difference of the two paired measurements is plotted against the mean of the two measurements and it is recommended that 95% of the data points should lie within the ±1·96 standard deviations (SDs) of the mean difference. These plots allow the identification of both systematic differences between two measurements and potential outliers, potentially for a dataset with large motion where the AVIP does not well represent any given phase due to the blurring resulting from the motion. Pearson Correlation is used to quantify the linearity of the relationship between the mean of each metric across all phases versus the value from the AVIP.
Results
Target
As the iCTV encompasses the motion across all phases it is larger than the CTV on any given phase. For each patient, the iCTV volume was compared to the minimum CTV volume across each phase for that patient. The iCTV volume was between 10·1 and 55·9% larger than the minimum CTV volume, with the two smallest tumour volumes (29·9 cc and 76·3 cc), defined as showing the greatest percentage differences (at 55·9 and 55·7%, respectively). Conversely, the largest CTV (473·2 cc) showed the smallest difference, at 10·1%.
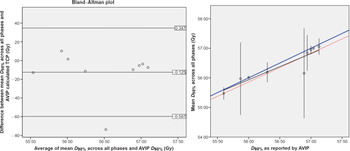
Figure 1 illustrates that the mean of the value for each metric across the breathing cycle is well represented by the value on the AVIP for the iCTV. For the D 98%, the mean value (±SD) on the AVIP was 56·5 ± 0·6 Gy versus across all phases of 56·4 ± 0·6 Gy, these were highly correlated with one another with a Pearson Correlation of 0·914 (p = 0·001). The R 2 of a linear fit of the mean across all phases versus the AVIP is 0·836 (black line). However, one patient’s data are an outlier with the D 98% higher on the AVIP compared to all phases and this patient’s results also lie outside the ±1·96 times SD in the Bland–Altman plot. Removing this patient from the analysis improves the Pearson Correlation to 0·992 (p < 0·001) and the R 2 of a linear fit of the mean across all phases versus the AVIP is 0·985 (red line).
Left: Bland–Altman plot for D98%, the average of the difference (−0·125 Gy) with the ±1·96 SD lines is displayed.; Right: mean D 98% (±95% CI) for the target (CTV) versus the D 98% from the AVIP along with a line of equality (blue), the black line is the fit to all data, the red line represents the fit should the outlier be removed.

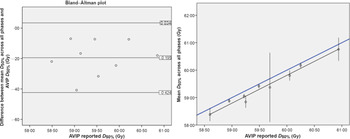
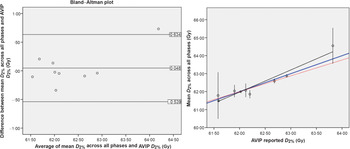
Similarly, for D 50% the mean value (±SD) on the AVIP was 59·6 ± 0·7 Gy versus across all phases of 59·4 ± 0·7 Gy with a Pearson Correlation of 0·987 (p < 0·005) (Figure 2). From the Bland–Altman plot, all values are below zero with a mean difference of −0·2 Gy. This is also illustrated in the offset between the line of equality and the fit of the mean versus AVIP data (fit is y = −1·05 + 1·01 * × with a R 2 value of 0·975). For D 2% the mean value (±SD) on the AVIP was 62·3 ± 0·7 Gy versus across all phases of 62·4 ± 0·9 Gy, with a Pearson Correlation of 0·963 (p < 0·001) (Figure 3). On the Bland–Altman plot most of the values are centred around zero with a mean difference of 0·048 Gy across all patients with one outlier at a mean difference of 0·732 Gy. Removing this patient from the analysis gives a Pearson Correlation to 0·939 (p = 0·001) and the R 2 of a linear fit is 0·881 (red line).
Left: Bland–Altman plot for D 50%, the average of the difference (−0·195 Gy) with the ±1·96 SD lines is displayed.; Right: mean D 50% (±95% CI) for the target (CTV) versus the D 50% from the AVIP along with a line of equality (blue) and a linear fit (black).

Left: Bland–Altman plot for D 2%, the average of the difference (−0·195 Gy) with the ±1·96 SD lines is displayed.; Right: mean D 2% (±95% CI) for the target (CTV) versus the D 2% from the AVIP along with a line of equality (blue), the black line is the linear fit to all data, the red line represents the fit should the outlier be removed.

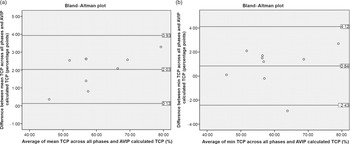
Figure 4a is a Bland–Altman plot of the average of the mean TCP across all phases and the AVIP generated TCP versus the mean difference between the two values for each of the patients. All values of the differences are greater than 0, indicating that the mean across all phases was always greater than the AVIP generated TCP. A similar plot for the min TCP (Figure 4b) shows that in seven of nine patients the minimum TCP across all phases was greater than the value from the AVIP dataset.
Bland–Altman plots of the mean (a) and min (b) TCP generated from all phases and the AVIP. The average of the differences and the ±1·96 SD lines are displayed also.

Figure 5 shows the mean value with 95% confidence interval (CI)] of the TCP across all phases versus the AVIP. For eight of nine, patients the spread of the CI was <3%, indicating that the TCP for any given phase was not clinically significantly different from that calculated on any other phase. However, one patient had a mean TCP of 65·3% with a CI of 60·2–74·6%. This is the patient with the second smallest CTV volume (min of 76·3 cc) but also one of the larger tumour motions (1·7 cm from the centre of mass of the maximum inhale and exhale phases) and thus one of the biggest differences in volume between the individual phases and the AVIP (155·7%).
Mean (±95% CI) TCP of the clinical target volume (CTV) across all phases versus the TCP calculated from the iCTV and AVIP dose distribution along with a line of equality (blue), the black line is the fit to all data.

OARs
Lung
The maximum lung volume in all patients was in either the 0% (six of nine) or 90% (three of nine) phase and the minimum lung volume was in the 50% (five of nine) or 60% (four of nine) phase. The SD across the phases ranged from 84·6 cc to 189·2 cc in absolute terms or 1·9% to 5·6% of the mean lung volume for that patient. The mean AVIP generated lung volume is 4,171 cc (±1,364 cc) while the mean volume across all ten phases is 4177 cc (±1,416 cc), illustrating the variance across the population. For a given patient the mean across all phases is highly correlated with the AVIP volume with a Pearson Correlation of 0·999 (p < 0·005) (Figure 6). In terms of lung dose-volume metrics for all four variables studied (MLD, V 25Gy, V 20Gy and V 5Gy) the mean across all ten phases was highly correlated with the value from the AVIP [Pearson’s Correlation of 1·000 (p < 0·005) for all metrics]. Bland–Altman analysis did not identify any outliers. Figure 7 shows the mean MLD across all phases versus the value on the AVIP dataset. The SD of MLDs across all phases and patients was <1 Gy, a variation that is not clinically significant. Similarly, the difference between the mean and the value on the AVIP is <0·5 Gy, again not clinically significant. The absolute differences between the mean and the value on the AVIP for the V 25Gy, V 20Gy and V 5Gy were <1% except for one patient with a difference of V 5Gy of 1·17%.
Mean (±95% CI) combined lung volume (cc) across all phases versus the combined lung volume from the AVIP dataset. Blue line is a line of equality.

Mean (±95% CI) mean lung dose (Gy) across all phases versus the mean lung dose from the AVIP dataset Black line is a linear fit, blue line is a line of equality.

Spinal Cord
The spinal cord is a serial organ and an appropriate evaluation metric is D max. The mean D max across all ten phases was highly correlated with the AVIP (Pearson’s Correlation of 0·993, p < 0·001). In addition, the spatial location of the D max was recorded and compared to the AVIP and 0%. The distance between the D max on the AVIP versus each phase was greater than the difference between the 0% and each other phase. The mean distances between the location of the D max on each phase and the AVIP was greater with five of nine patients showing a distance >1 cm. For the 0% versus each phase, all the differences were within 0·25 cm except for one patient. For that one patient the location of D max moved almost 10 cm away on the 40%/50%/60% datasets. The movement of the centre of mass of the tumour for those three phases was 1·34 cm/1·5 cm/1·71 cm relative to the 0% position. Further investigation showed that along the length of the tumour the distance to the spinal cord was broadly similar and thus a small shift in the position of the target resulted in a large shift in the spatial location of the D max. However, this was not clinically significant as the difference in spinal cord dose at the original D max and the new D max was < 0·3 Gy.
Discussion
The internal target volume (ITV) was introduced in ICRU Report 62 to quantify the internal motion. Patient-specific ITVs generated on a 4DCT have been demonstrated to be dosimetrically beneficial compared to population-based methodsReference D’Souza, Nazareth and Zhang14 resulting in smaller PTVs for most patients. There have been several studies investigating which 4DCT data should be used for target delineationReference Muirhead, McNee, Featherstone, Moore and Muscat15–Reference Park, Huang, Gagne and Papiez17 and whether multiple 4DCTs would be beneficial.Reference Geld van der18 Han et al.Reference Han, Basran and Cheung5 investigated the use of the AVIP for organ at risk (OAR) contouring and dose calculation in SBRT concluding that the AVIP is suitable for OAR delineation. Admiraal et al.Reference Admiraal, Schuring and Hurkmans3 looked at 4D dose accumulations compared to coverage on the average dataset for ten SBRT patients and concluded that the accumulated CTV dose corresponds well to the planned dose on the AVIP.
Few authors have looked at the impact of dose calculation on the AVIP outside of SBRT. SBRT targets are smaller and can be more mobile than those in LA-NSCLC. Ehler et al.Reference Ehler and Tomé4 investigated eight cases with intensity-modulated radiation therapy (IMRT) optimisation on the AVIP and demonstrated that this resulted in a more uniform dose to the tumour throughout the breathing cycle. RTOG protocol 110619 investigating dose escalation in the LA-NSCLC population suggested the use of the average scan from a 4DCT set for treatment planning. In addition, Kang et al.Reference Kang, Zhang and Chang20 suggested that the optimal image series for optimisation in proton radiation therapy is an AVIP with density overrides applied to ensure homogeneity.
EhrbarReference Ehrbar, Lang and Stieb21 demonstrated that most of the differences observed between dose distributions calculated based on an AVIP and four-dimensional dose accumulations were due to the Houndsfield Unit differences. Her work was performed with AAA and we might expect to see a larger difference between the phases to be demonstrated with AXB as it performs more accurately in boundary regions. The results of our study agree with those reported for SBRT, as calculation on the AVIP dataset is correlated with the mean across all phases for a number of PTV metrics (D 98%, D 50% and D 2%). In looking at the TCP results the mean across the phases was always greater than the AVIP generated TCP as expected, as the TCP is a product of the probability of control across each voxel in the volume and the iCTV on the AVIP is always larger than the CTV on any phase.
In their study, Han et al.Reference Han, Basran and Cheung5 showed no significant difference in the location of the hotspot between the AVIP and helical scan. However, Starkschall et al.Reference Starkschall, Britton and McAleer22 in their study of 4D dose accumulation versus dose calculation on the 50% phase reported two patients with significantly different spinal cord doses. This highlights that assumptions regarding the dose to OARs on the AVIP representing the dose accumulation overall phases do not necessarily apply for all patients, particularly for serial organs. In our study, the location of the D max to the spinal cord shift a significant distance (maximum 1·71 cm for one patient with large tumour motion) but the change in the absolute value of the spinal cord dose at that point was not clinically significant. For the combined lung the SD of MLDs across all phases and patients was <1 Gy, even for those with larger motion. Thus, AVIP data for parallel OARs are representative of any given phase.
There are additional uncertainties to be considered clinically. Schmidt et al.Reference Schmidt, Hoffmann, Kandi, Moller and Poulsen23 demonstrated that the dosimetric impact of anatomical variations during treatment was greater than the effect of tumour motion due to respiration and interfraction baseline shifts. For repeat CTs during treatment Fox et al.Reference Fox, Ford, Redmond, Zhou, Wong and Song24 showed a significant reduction in GTV volume of 24·7 and 44·3% on the first and second, a density change whose effect on the dose distribution we have not accounted for. The plans in this paper are modulated VMAT plans with a different fluence delivered at each control point. Thus, to get a ‘true’ 4D delivery, not only should we look at accumulating dose across all phases of the 4D, and at each control point correlated with the breathing phase the patient is in at that control point. However, given the 20–30 fraction regimes of treatment for LA-NSCLC interplay of modulation per control point and breathing style is likely to blur out over the course of treatment.
While this study is limited by a small patient population it highlights the need to review tumour motion when evaluating plans generated on an AVIP in the clinic. It helps guide us as to when it may be appropriate to calculate the plan on individual phases to ensure that the treatment will be delivered as intended by the Radiation Oncologist. For patients for whom the deviation is clinically significant, it may indicate that other approaches, such as gated delivery, may be warranted.
Conclusion
This study of nine LA-NSCLC patients has indicated that utilising traditional DVH metrics on an AVIP dataset is generally valid in assessment of 4DCT treatment plans. In terms of normalisation, prescribing to the median of the AVIP target dose leads to mean doses to the target that are similar across all phases. For targets with large motion and small volume the cumulative D 98% across all phases may be lower than the AVIP reported D 98% and these patients may warrant investigation on individual phases. As the TCP calculation shows a dependence on volume, TCP calculations on the AVIP are not valid as an absolute predictor of outcome but are still useful as a plan comparison tool. Standard dose-volume constraint metrics can be used on the AVIP for both lung and spinal cord.
Acknowledgements
None.
Financial Support
This research did not receive any specific grant from funding agencies in the public, commercial or not-for-profit sectors.
Conflict of Interest
None declared.