Introduction
In the last two decades, the use of additive antibiotics as growth promoters for ruminants and non-ruminants at non-therapeutic levels has been paramount to increasing feed efficiency and preventing diseases in production animals (McAllister et al., Reference McAllister, Stanford, Chaves, Evans, De Sousa, Ribeiro, Bazer, Cliff and Wu2020). However, the inappropriate use of these growth promoters in production animals has contributed to the emergence of bacteria resistant to their effects. As a result, these additives have been banned in several countries, leading to research into natural products and bioactive compounds that may have effects similar to antibiotics (Khan et al., Reference Khan, Singh, Jamous, Ali, Abdullah Uddin and Ayoub2022).
Capsaicin (CAP) (trans-8-methyl-N-vanillyl-6-nonenamide) is a type of capsaicinoid, a chemical compound found in all peppers, especially in red and hot peppers. CAP represents around 79% of the total capsaicinoids, depending on the ripening of peppers (Barbero et al., Reference Barbero, Ruiz, Liazid, Palma, Vera and Barroso2014). In addition, CAP has significant anti-inflammatory properties and has been used in various types of research due to the effects of inhibiting the production of pro-inflammatory mediators (Caterina et al., Reference Caterina, Schumacher, Tominaga, Rosen, Levine and Julius1997; Surh et al., Reference Surh, Chun, Cha, Han, Keom, Park and Lee2001; Park et al., Reference Park, Kawada, Han, Kim, Goto, Takahashi, Fushiki, Kurata and Yu2004). In addition, CAP has been used to stimulate water consumption, food consumption and several meals throughout the day (Calsamiglia et al., Reference Calsamiglia, Busquet and Cardozo2007; Oh and Hristov, Reference Oh, Hristov, Jeliazkov (Zheljazkov) and Cantrell2016; Oh et al., Reference Oh, Harper, Lang, Wall and Hristov2018), increasing energy efficiency due to its pungent effect.
Capsicum derivatives are usually offered in encapsulated form to increase acceptability due to the pungent effect. According to Grigoletto et al. (Reference Grigoletto, Takiya, Bugoni, Nunes, Junior, Chesini, da Silva, Santos and Rennó2023), encapsulation can reduce the negative effects of capsaicinoids on rumen fermentation and the bacterial population density in the rumen environment. Research on dairy cattle (Abulaiti et al., Reference Abulaiti, Ahmed, Naseer, El-Qaliouby, Iqbal, Hua and Yang2021; Silvestre et al., Reference Silvestre, Raisanen, Cueva, Wasson, Lage, Martins, Wall and Hristov2022) and beef cattle (Westphalen et al., Reference Westphalen, Carvalho, Oh, Hristov, Staniar and Felix2021; Eidsvik et al., Reference Eidsvik, McKinnon, Blanchard, Khelil, Moya and Penner2022; Yi et al., Reference Yi, Wu, Ma, Cui, Deng, Hu and Wu2022) has been conducted to evaluate the effects of CAP. In studies with dairy or beef cattle, CAP has been used to modify the ruminal fermentation process, increase nutrient use efficiency and enhance animal productivity (Calsamiglia et al., Reference Calsamiglia, Busquet and Cardozo2007; Oh et al., Reference Oh, Hristov, Lee, Cassidy, Heyler, Varga and Bravo2013, Reference Oh, Harper, Giallongo, Bravo, Wall and Hristov2017a).
However, most of the research was conducted in a confinement system, allowing feed and weather control. Studies carried out under tropical conditions on pasture are scarce, so all animal performance can be altered by pasture and climatic conditions.
This way, this study aimed to evaluate the effects of CAP supplementation on the intake, nutrient digestibility, ruminal fermentation, nitrogen balance, microbial protein synthesis and health traits of bulls managed on pasture. It was hypothesized CAP supplementation would modulate ruminal fermentation increasing propionate over acetate and improve the intake, digestibility of nutrient and immunity in grazing cattle.
Materials and methods
Ethical considerations and location
All procedures performed in the present experiment were sent for approval to the Ethics Committee for the Use of Animals by the School of Veterinary Medicine and Animal Science of the Federal University of Bahia (UFBA), Salvador (BA) Brazil (approval number: 20/2022). This experiment was conducted at the Experimental Farm of Entre Rios, which is a facility of the School of Veterinary Medicine and Animal Science (UFBA) located in the municipality of Entre Rios, the northeast region of Bahia, Brazil (11°56′31′′S, 38°05′04′′W, and 162 m altitude). The region has an average minimum temperature of 22°C, an average maximum temperature of 29°C, an average annual rainfall of 1.000–1.251 mm and a warm, semi-humid climate.
Animals, design and experimental diets
Eight crossbred (Holstein x Zebu) bulls averaging 313 ± 31 kg of body weight (BW) were arranged in a duplicated 4 × 4 Latin square design (one square of four bulls rumen fistulated with 4-inch silicone cannulas and one square of four non-fistulated bulls) and were kept on Pangola grass pasture (Digitaria decumbens). Animals were managed in a continuous grazing system in an area of 1.2 ha, with nitrogen fertilization of 50 kg every 21 days (experimental period) to maintain grazing pressure.
Each experimental period consisted of 14 days of adaptation to diets and 7 days for data collection (no washout between periods). Bulls were randomly assigned to the following treatments: CON (control): concentrate supplementation at 0.5% live weight (BW) and no additive (CAPCIN®), or concentrate supplementation at 0.5% live weight (BW) in association with CAPCIN® (NutriQuest, Campinas, Brazil) fed at the inclusion rates of 150 (CAP150), 300 (CAP300) and 450 (CAP450) mg/animal/day.
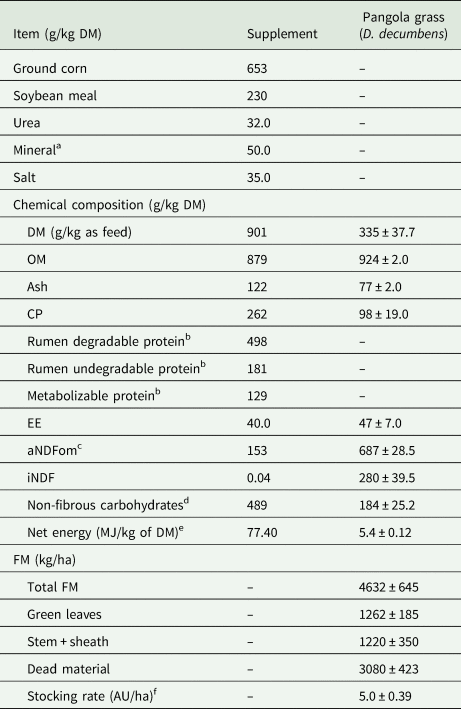
Diets were formulated to meet animals’ requirements according to the BR-CORTE system (BR-CORTE, 2023) (Table 1).
Ingredients and chemical composition of the supplement

a Contained per kg of product: 225 g calcium, 160 g phosphorus, 30 g sulphur, 18 g magnesium, 120 mg cobalt, 2500 mg copper, 120 mg iodine, 1800 mg manganese, 36 mg selenium, 5250 mg zinc, 1600 mg fluorine.
b Estimated according to BR-CORTE (2023) system.
c Neutral detergent fibre assayed with a heat-stable amylase and expressed exclusive of residual ash.
d According to Hall (Reference Hall2000) equation.
e According to NRC (2016) equation.
f Animal unit (standardized to a relative BW of 450 kg).
Forage evaluation
During the entire experiment, forage samples were collected every 21 days. The average canopy height was measured every 3 days at 180 random points/ha within each pasture to maintain a grass height of 30 cm. At the beginning of each experimental period, 50 kg of nitrogen/ha was applied in the pasture.
The pasture height was measured using a stick graduated in centimetres and an acetate plate (Fagundes et al., Reference Fagundes, Silva, Pedreira, Sbrissia, Carnevalli, Carvalho and Pinto1999; Barbero et al., Reference Barbero, Malheiros, Araújo, Nave, Mulliniks, Berchielli, Ruggieri and Reis2015). The path collected in the first measurement was maintained for all subsequent measurements.
Forage mass (FM) was estimated by cutting and collecting three forage samples from each pasture at the average canopy height. The forage was cut close to the ground in an area limited by a 0.25 m2 circular frame, as proposed by Barbero et al. (Reference Barbero, Malheiros, Araújo, Nave, Mulliniks, Berchielli, Ruggieri and Reis2015). The samples were initially weighed and then divided into two, one to estimate the total forage dry matter availability (kg DM/ha) of the pasture and the other to determine the morphological composition of the forage.
Samples were manually separated into senescent material (leaf and stem), green stems (leaf, sheath and stem) and green leaf blades to evaluate the morphological compositions. The average morphological characterization of the pasture for the four periods is included in Table 1.
The chemical composition of the forage was determined using forage sampled by the grazing simulation method (manual collection) from 20 points/ha (Barbero et al., Reference Barbero, Malheiros, Araújo, Nave, Mulliniks, Berchielli, Ruggieri and Reis2015). Fresh forage samples were dried as described above for pasture sampling in an oven (Tecnal, TE-394, Brazil) with air circulation at 55°C for 72 h before final weighing.
Net herbage accumulation (NHA) was recorded as kg of DM in each experimental period, following Hoogendoorn et al. (Reference Hoogendoorn, Newton, Devantier, Rolle, Theobald and Lloyd-West2016), using one exclusion cage per pasture, where 1.0 m2 quadrant (1.0 × 1.0 m2) was cut with hand shears to the ground level outside the cage at the start of the period and inside at 21 days, and NHA per period was estimated by difference.
Nutrient intake and total-tract apparent digestibility
Concentrated supplementation was provided directly in the trough daily at 10.00 h, with an average of about 1.5 kg of concentrate/bull/day being supplied. All the animals remained together in the pasture, and at 10.00 h, they were taken to the feeding area with individual troughs to provide the supplement and the additive. The additive was supplied in addition to the supplement individually per animal. There was an adaptation in the consumption of CAP in each experimental period for approximately 2 days. Then, the animals consumed the supplement and the additive according to the experimental treatments (Table 1).
Titanium dioxide (TiO2) was used as an external marker to estimate faecal excretion, and indigestible neutral detergent fibre (iNDF) content was used to estimate forage DM intake, for 10 consecutive days (between the 5th and the 15th day of each experimental period) at 10.30 h. All animals received TiO2 inserted at the time of supplementation mixed in the ration to guarantee a total consumption of 10 g/animal/day.
During this 10-day titanium testing period, the first 7 days were dedicated to the adaptation of the animals, and the last 3 days to faecal sample collections. Faeces were collected every 9 h, after defaecation or directly from the animals' rectum, totalling eight collections per animal/period. Immediately after collection, the samples were frozen at −20°C for further analysis (Harvatine and Allen, Reference Harvatine and Allen2006). During this period, pasture and ingredient samples (i.e. ground corn and soybean meal) were collected (~300 g) and stored at −20°C. Faecal and ingredient samples were dried in a forced air oven (55°C for 72 h), ground in a Wiley mill to pass through a 1 mm screen and analysed for DM, crude protein (CP), ether extract (EE) and neutral detergent fibre (NDF) contents according to AOAC (2000) methods described later.
The faecal excretion of each animal was determined based on the concentration of TiO2 in the faeces and calculated based on the ratio between the amount of the indicator provided and its concentration in the faeces (Oliveira et al., Reference Oliveira, Santos, Abreu, Crispim and Nogueira2012). To determine the pasture intake, samples of ingredients, forage and faeces were ground in a Wiley mill to pass through a 2 mm screen and then placed in non-woven textile bags (5 × 5 cm2, pore size 50 μm, 100 g/m2) following the recommendation of a maximum of 100 g of DM/m2 (Casali et al., Reference Casali, Detmann, Valadares Filho, Pereira, Henriques, Freitas and Paulino2008). Processed samples were incubated for 288 h in the rumen of two cannulated cows receiving the same diet used in the digestion trial (Detmann et al., Reference Detmann, Souza, Valadares Filho, Queiroz, Berchielli, Saliba, Cabral, Pina, Ladeira and Azevedo2012). After incubation, the bags were washed in running tap water, dried in a forced air oven (55°C for 72 h) and analysed for NDF concentration (Mertens, Reference Mertens2002). The iNDF concentration was calculated using the following equation of Detmann et al. (Reference Detmann, Souza, Valadares Filho, Queiroz, Berchielli, Saliba, Cabral, Pina, Ladeira and Azevedo2012):

Chemical analyses
Samples of pasture, ingredients, refusals and faeces were dried in a forced air oven (55°C for 72 h), ground in a Wiley mill with a 1 mm screen and analysed for DM (ID 920.15), ash (MM; ID 942.05), CP (ID 984.13), EE (ID 920.39), acid detergent fibre and lignin (LIG; ID 973.18) contents according to the methods proposed by AOAC (2000). NDF was analysed with a fibre analyser (Ankom Tech Corp., Fairport, New York, USA) using thermostable alpha-amylase and no sodium sulphite in the detergent (Mertens, Reference Mertens2002). Dietary non-fibrous carbohydrates content was calculated using the equation proposed by Hall (Reference Hall2000) and total carbohydrates according to Sniffen et al. (Reference Sniffen, O'connor, Van Soest, Fox and Russell1992). Net energy contents were calculated according to NRC (2016). The metabolizable energy (ME) was calculated following the NRC (2001) recommendations.
Ruminal fermentation
Ruminal digesta samples (250 ml) were collected from five different sites (cranio-dorsal, cranio-ventral, ventral, caudo-ventral and caudo-dorsal ruminal regions) through the ruminal cannula on days 16, 17 and 18 of each experimental period, at times 0, 3, 6, 9, 12 and 18 h after concentrate supplementation. On day 16, samples were collected at 10.00, 14.00 and 18.00 h. On day 17, samples were collected at 12.00 and 16.00 h; on day 18, samples were collected at 20.00 h. The collection pattern was varied to reduce the time animals are away from pastures, thus minimizing the impact on pasture behaviour cycle. Time 0 (zero) h corresponds to sampling before concentrate supplementation, scheduled for 10.00 h.
Immediately after collection, ruminal fluid samples were filtered using four layers of cheesecloth (1 mm mesh), and pH was measured with a digital pH meter (ORP 8651, AZ Instrument Corp., Tanzi District, Taichung City, Taiwan). Then, aliquots of rumen fluid were frozen at −20°C for subsequent volatile fatty acid (VFA) analyses.
Ruminal VFA concentration analysis was measured by injecting 1 μl of the sample into a high-performance liquid chromatograph. Samples were thawed and centrifuged at 1300 × g for 20 min. After centrifuging, 1 ml of the supernatant was transferred into a test tube containing 1 ml of 25% metaphosphoric acid was added to avoid any microbial activity. The tubes were then identified and stored in a freezer at −20°C to determine acetate, propionate and butyrate concentrations as proposed by Mathew et al. (Reference Mathew, Sagatheman, Thomas and Mathen1997). Moreover, the calculation of ruminal methane (CH4) production was estimated using VFA proportions as described by Moss et al. (Reference Moss, Jouany and Newbold2000) equation as follows:

Nitrogen balance and microbial protein synthesis
Spot urine samples (50 ml) were collected on days 16, 17 and 18 of each experimental period, 4 h after the morning feeding. Urine samples were collected using sterile plastic containers and filtered through gauze. Then, 10 ml of the urine sample were immediately diluted in 40 ml of 0.036 N sulphuric acid solution (Valadares et al., Reference Valadares, Broderick, Valadares Filho and Clayton1999), stored in labelled plastic bottles and frozen at −20°C for later analysis of creatinine, total nitrogen and purine derivatives.
Daily urine volume was estimated based on creatinine concentration in spot samples and a predefined daily creatinine excretion rate of 32.27 mg/kg BW (Chizzotti et al., Reference Chizzotti, Valadares Filho, Valadares, Martins, Marcondes, Fonseca and Araujo2004). Creatinine concentration in urine samples was analysed using a commercial kit (Labtest Diagnóstica SA, Lagoa Santa, Brazil, ID: 35-100), and readings were performed in a spectrophotometer (AJX-1900, Micronal SA, São Paulo, Brazil). Thus, quantification of the daily urinary volume of each animal was obtained by multiplying the individual BW by the amount of creatinine excreted daily and then dividing the product by the creatinine concentration (mg/l) in the spot sample. The nitrogen balance was calculated using the difference between the ingested nitrogen (N intake) and amounts of nitrogen excreted in the bulls' faeces and urine. The Kjeldahl method was used to measure the nitrogen content in the samples (AOAC, 2000; ID 984.13).
Total uric acid concentration excretion was determined using a commercial kit (Labtest Diagnóstica SA, Lagoa Santa, Brazil). Readings were performed in a spectrophotometer (AJX-1900, Micronal SA, São Paulo, Brazil). Allantoin concentrations were analysed using the colorimetric method using a spectrophotometer, according to the methodology of Fujihara et al. (Reference Fujihara, Ørskov, Reeds and Kyle1987). Microbial protein synthesis was estimated considering the molar excretions of uric acid and allantoin in urine samples, according to Chen and Gomes (Reference Chen and Gomes1992). The total excretion of purine derivatives (mmol/day) was calculated as the sum of allantoin and uric acid urinary excretions (Orellana-Boero et al., Reference Orellana-Boero, Balcells, Martín-Orúe, Liang and Guada2001). The absorbed microbial purines and ruminal nitrogen synthesis (g of N/day) were calculated using the equation proposed by Chen and Gomes (Reference Chen and Gomes1992) and assuming a constant nitrogen to purine base ratio.
Blood metabolites and health traits
On day 20 of each experimental period, four rectal temperature (RT) and heart rate (HR) measurements were taken to evaluate the effect of the additive (10.00, 11.00, 12.00, 13.00 and 14.00 h), and blood samples (10 ml) were collected by puncture of the coccygeal vein in Vacutainer® tubes at 11.00 and 14.00 h according to Oh et al. (Reference Oh, Giallongo, Frederick, Pate, Walusimbi, Elias and Hristov2015) for the evaluations of blood count cells and blood metabolites.
Initially, the tubes were centrifuged (1800 × g for 15 min at room temperature), and after the components had been separated, serum and plasma were collected. The serum was transferred to Eppendorf® tubes and stored at −20°C for further analysis.
Serum concentrations of glucose (ID: BT1000800), urea (ID: BT1001200), creatinine (ID: BT1000700), total protein (ID: BT1000900), albumin (ID: BT1000200), aspartate-aminotransferase (ID: BT1100700) and gamma-glutamyltransferase (ID: BT1100600) were analysed in serum collected using colorimetric methods through commercial kits (Biotécnica Indústria e Comércio Ltda., Varginha, MG, Brazil).
The plasma samples obtained were stored in refrigerated coolers and sent to the laboratory for evaluation of complete blood counts (differential counts of red blood cells, erythrogram and leucogram) according to the methodology of Rosenfeld (Reference Rosenfeld1947).
Statistical analysis
A replicated 4 × 4 Latin square design balanced for residual effect was used (Cochran and Cox, Reference Cochran and Cox1958). Nutrient intake, digestibility, nitrogen balance, microbial protein synthesis and blood metabolites data were analysed without repeated measures over time using the PROC MIXED procedure of Statistical Analysis System software (SAS, 2013) (Statistical Analysis System – SAS Institute Inc., Cary, NC, version 9.4; SAS Institute Inc., Cary, NC). The model equation is as follows:

where Yijkl is the dependent variable, μ is the overall mean, Si is the fixed effect of Latin square i (bull group) (i = 1–2), Bj (Si) is the random effect of bull within square j (j = 1–8), Pk is the fixed effect of experimental period k (k = 1–4), Tl is the fixed effect of diet l (l = 1–4) and eijkl is the residual error.
Rumen fermentation traits (ruminal pH, ammonia nitrogen, VFAs and methane ruminal estimate (CH4)), HR and RT were analysed as repeated measures over time, assuming an AR(1) covariance structure, according to the following model:

where Yijkl is the dependent variable, μ is the overall mean, Bj (Bi) is the random effect of bull (j = 1–4), Pj is the fixed effect of experimental period j (j = 1–4), Dl is the fixed effect of diet l (l = 1–4) and eijl is the residual error. Tm is the fixed effect of sampling time m (m = 1–7), Tm × Dl is the fixed interaction effect between sampling time and treatment and eiklm is the random experimental error.
Orthogonal contrasts were used to evaluate CAP treatments v. control (1 1 1 −3), linear (−1 1 3 −3), quadratic (−1 −1 1 1) and cubic (3 −3 1 −1) effects of capsaicin (CAP) supplementation. Orthogonal contrasts were used to evaluate linear, quadratic or cubic effects of time about an hour of supplementation encapsulated inclusion levels on the dependent variable (health traits and ruminal fermentation). Statistical differences were considered significant at P ≤ 0.05 and trends at 0.05 < P ≤ 0.10.
Results
Nutrient intake and total tract apparent digestibility
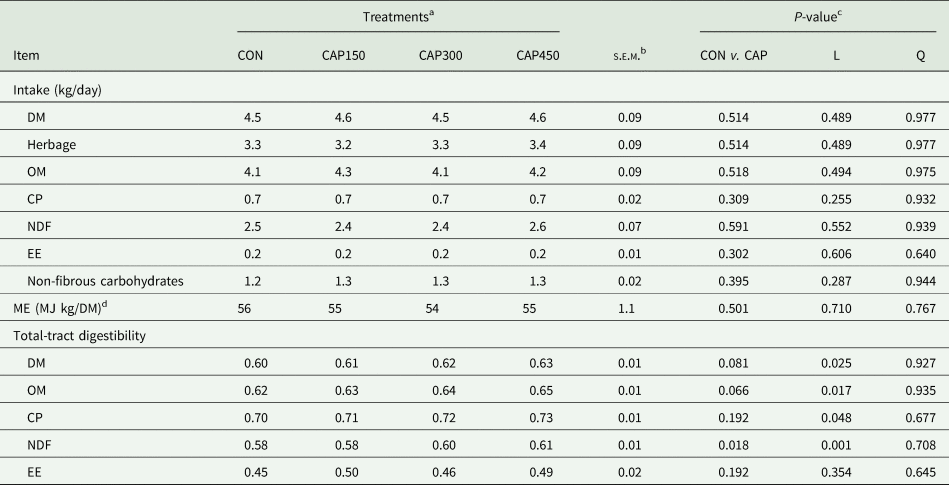
Nutrient intake was not affected by CAP supplementation (P > 0.050). There was an increase in the digestibility of NDF (P = 0.018) and a trend towards the digestibility of DM (P = 0.081) and organic matter (OM) (P = 0.066) for diets with CAP compared to the control diet. Dietary supplementation with CAP linearly increased the digestibilities of DM (P = 0.025), OM (P = 0.017), CP (P = 0.048) and NDF (P = 0.001) (Table 2).
Effect of dietary encapsulated pepper (CAP) on nutrient intake and total-tract apparent digestibility in bulls

a Control = 0 mg/day of CAP, CAP150 = 150 mg/day of CAP, CAP300 = 300 mg/day of CAP, CAP450 = 450 mg/day of CAP.
b Major s.e.m. showed; n = 64 for the variables HR and RT; n = 32 for all other variables (n represents the number of observations used in the statistical analysis).
c CON v. CAP, control v. treatment; L, linear effect of CAP; Q, quadratic effect of CAP (statistical differences were considered significant at P ≤ 0.05 and trends at 0.05 < P ≤ 0.10).
d The metabolizable energy (ME) was calculated following the NRC recommendations (2001), using the equations: DE = TDN × 0.04409 (MJ/kg) and ME = DE × 0.082.
Haemogram
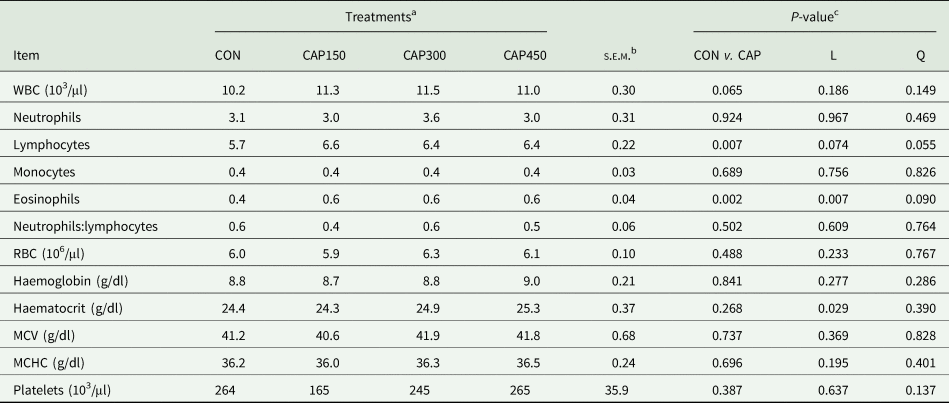
White blood cells tended to be higher in cattle fed with a control diet than those fed on CAP diets (P = 0.065) (Table 3). Compared to the control, the inclusion of CAP in the diet increased lymphocytes (P = 0.007) and eosinophils (P = 0.002). A quadratic trend was observed for lymphocytes (P = 0.055) and for eosinophils (P = 0.090) with the increase in the rate of CAP supplementation. In addition, a linear increase for haematocrit (P = 0.029) was verified using CAP as an additive.
Effect of dietary encapsulated pepper (CAP) on blood cell counts in bulls

WBC, white blood cells; RBC, red blood cells; MCV, mean corpuscular volume; MCHC, mean corpuscular haemoglobin concentration.
a Control = 0 mg/day of CAP, CAP150 = 150 mg/day of CAP, CAP300 = 300 mg/day of CAP, CAP450 = 450 mg/day of CAP.
b Highest s.e.m. shown; n = 64 for the variables HR and RT; n = 32 for all other variables (n represents number of observations used in the statistical analysis).
c CON v. CAP, control v. treatment; L, linear effect of CAP; Q, quadratic effect of CAP (Statistical differences were considered significant at P ≤ 0.05 and trends at 0.05 < P ≤ 0.10).
Ruminal fermentation and health traits
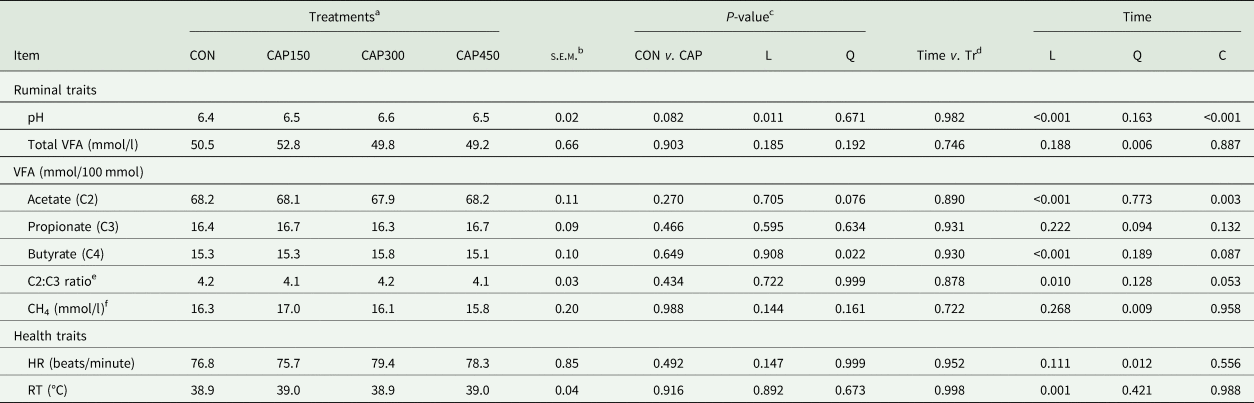
No effect of the time–treatment interaction for the rumen fermentation, and health traits evaluated was affected (P > 0.05) (Table 4). Still, there were time effects for rumen pH, observing linear (P < 0.001) and cubic (P < 0.001) effects (Table 4). Compared to the control diet, rumen pH tended to increase with CAP (P = 0.082) and increased linearly (P = 0.011) by CAP supplementation. There was a quadratic effect for total VFA (P = 0.006), estimated methane (P = 0.009), HR (P = 0.012) and quadratic trend for propionate (P = 0.094) according to the times evaluated.
Effect of dietary encapsulated pepper (CAP) on health and ruminal fermentation traits in bulls

VFA, volatile fatty acids; HR, heart rate; RT, rectal temperature.
a Control = 0 mg/day of CAP, CAP150 = 150 mg/day of CAP, CAP300 = 300 mg/day of CAP, CAP450 = 450 mg/day of CAP.
b Highest s.e.m. shown; n = 64 for the variables HR and RT; n = 32 for all other variables (n represents the number of observations used in the statistical analysis).
c CON v. Tr., control v. treatment; L, linear effect of CAP; Q, quadratic effect of CAP.* n, 64 for the variables HR and RT; n = 32 for all other variables (n represents number of observations used in the statistical analysis) (Statistical differences were considered significant at P ≤ 0.05 and trends at 0.05 < P ≤ 0.10).
d The column ‘Time v. Tr’ is the interaction effect of the evaluated times (0, 3, 6, 9, 12 and 18 h) about the treatments being assessed (CON, CAP150, CAP300, CAP450).
e Acetate to propionate ratio.
f Methane estimated using VFA proportions as described by Moss et al. (Reference Moss, Jouany and Newbold2000) equation as follows: CH4 production = 0.45 (acetate, C2) − 0.275 (propionate, C3) + 0.4 (butyrate, C4).
There was a linear (P < 0.001) and cubic (P < 0.003) effect for the acetate values according to the hours evaluated (Table 4). There was a time linear effect for the concentrations of butyrate (P < 0.001), acetate/propionate ratio (P = 0.001) and RT (P = 0.001) and a trend towards the first two traits for cubic effect (butyrate, P < 0.087; acetate/propionate ratio, P = 0.053). Supplementation with CAP had a quadratic effect for butyrate (P = 0.022).
Nitrogen balance, microbial protein synthesis and blood metabolites
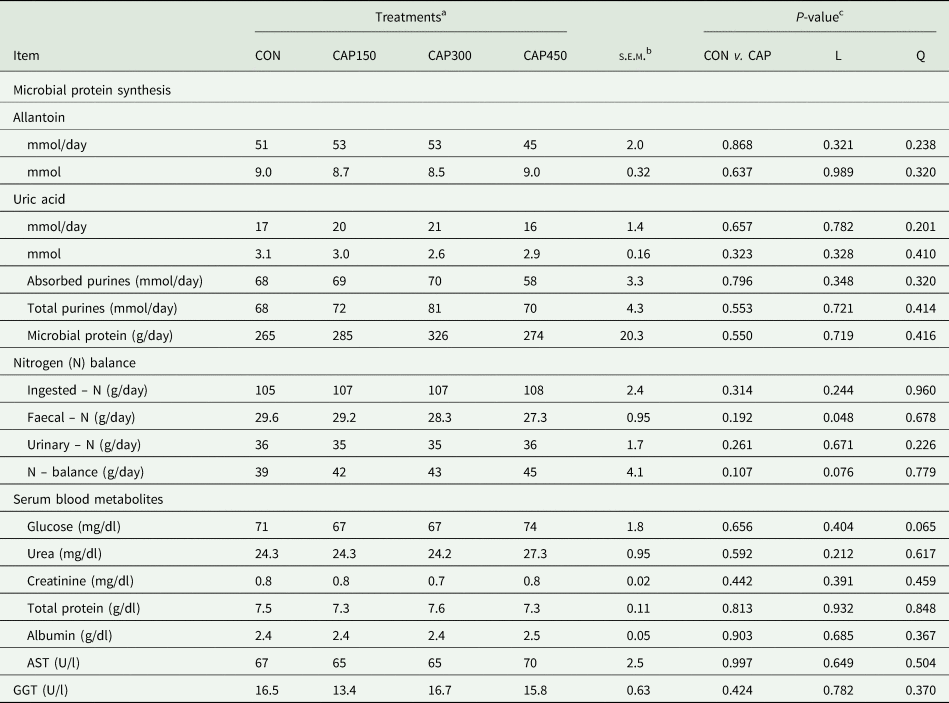
Supplementation of the diet with CAP was not affected by microbial protein synthesis (P > 0.050). A linear reduction for faecal-N (P = 0.048) and an increasing trend for N-balance (P = 0.076) was observed with CAP supplementation. A quadratic trend was observed for blood glucose concentrations (P = 0.065) for CAP supplementation (Table 5).
Effect of dietary encapsulated pepper (CAP) on microbial protein synthesis, nitrogen balance and serum blood metabolites in bulls

AST, aspartate aminotransferase; GGT, gamma-glutamyltransferase.
a Control = 0 mg/day of CAP, CAP150 = 150 mg/day of CAP, CAP300 = 300 mg/day of CAP, CAP450 = 450 mg/day of CAP.
b Highest s.e.m. shown; n = 64 for the variables HR and RT; n = 32 for all other variables (n represents the number of observations used in the statistical analysis).
c CON v. Tr., control v. treatment; L, linear effect of CAP; Q, quadratic effect of CAP.* n = 64 for the variables HR and RT; n = 32 for all other variables (n represents number of observations used in the statistical analysis). Statistical differences were considered significant at P ≤ 0.05 and trends at 0.05 < P ≤ 0.10.
Discussion
Nutrient intake and total-tract apparent digestibility
It was hypothesized that feeding encapsulated pepper would modulate ruminal fermentation and improve the intake, digestibility of nutrients and immunity in grazing cattle. Although in this study, there were no effects of CAP doses on nutrient intake as found elsewhere (Tager and Krause, Reference Tager and Krause2011; Oh et al., Reference Oh, Hristov, Lee, Cassidy, Heyler, Varga and Bravo2013, Reference Oh, Giallongo, Frederick, Pate, Walusimbi, Elias and Hristov2015). An increase in the digestibility of NDF and an increase in the digestibility of DM and OM were observed with the inclusion of CAP. In addition, a linear increase in the digestibility of DM, OM, CP and NDF with doses of CAP was found until 450 mg/bull/day.
The increased digestibility of DM, OM and CP can be attributed to post-ruminal digestion, as suggested by some authors due to the increase in digestive enzymes in the lower tract, such as chymotrypsin, trypsin, lipase and amylase (Platel and Srinivasan, Reference Platel and Srinivasan1996, Reference Platel and Srinivasan2000), where the possible mechanism underlying the increased activity of digestive enzymes may be related to increased endogenous cholecystokinin (CCK) levels (Liu et al., Reference Liu, Wang, He, Liu and Piao2021). According to Otsuki and Williams (Reference Otsuki and Williams1983) and Yamamoto et al. (Reference Yamamoto, Otani, Jia, Fukumitsu, Yoshikawa, Akiyama and Otsuki2003), CAP supplementation increases CCK concentration by stimulating the CAP-sensitive afferent vagal pathway, thus improving pancreatic functions. It is noteworthy that the greatest effects on digestibility were observed in animals fed 450 mg/day with encapsulated pepper as a source of CAP; this dose is equivalent to approximately 97 mg of CAP/kg of DM consumed, which enhances the effects of CAP justified by the above mechanisms.
Oh et al. (Reference Oh, Harper, Giallongo, Bravo, Wall and Hristov2017b) evaluated dairy cows with doses of 100 and 200 mg/day of Capsicum oleoresin protected in the rumen and observed results similar to those observed of this study, a greater digestibility total of DM, OM and CP and a trend towards a linear increase in the digestibility of NDF. The increase in NDF digestibility is related to the change in the microbial population density due to CAP supplementation. According to Oh et al. (Reference Oh, Giallongo, Frederick, Pate, Walusimbi, Elias and Hristov2015) and An et al. (Reference An, Luo, Abdelrahman, Riaz, Gao, Yao, Ye, Nível, Zhao, Chen and Yang2022), CAP supplementation increases the rumen population density of Butyrivibrio fibrisolvens; this bacterium represents a significant fraction of the rumen microbiota and is of fundamental importance for the digestion of the fibrous fraction of the diet (Wang et al., Reference Wang, An, Bu, Liu, Liu, Guo, Zhang and Zhang2024). The population growth of B. fibrisolvens and the enzymatic activity of this bacterium are maximized at pH closer to neutrality, allowing an efficient fermentation of the fibres. Therefore, such associated effects justify the higher digestibility of NDF in animals fed CAP.
Ruminal fermentation and health traits
Accordingly, to our hypothesis, modifications in ruminal fermentation traits with CAP doses were observed in the current study. The main results were the linear increase in ruminal pH values with increasing CAP doses and a trend towards an increase in total VFA compared to the control. Behaviours were observed that could justify this increase in ruminal pH values. One of the observations made when conducting the research was the increase in water consumption immediately after consuming supplements containing CAP, even though it was not measured in this study. The main interest in the use of CAP as a natural additive in dairy and beef cattle diets is attributed to this pungent effect in stimulating water consumption, food consumption and the number of meals throughout a day (Calsamiglia et al., Reference Calsamiglia, Busquet and Cardozo2007; Rodríguez-Prado et al., Reference Rodríguez-Prado, Ferret, Zwieten, Gonzalez, Bravo and Calsamiglia2012) and can increase energy efficiency in animals on pasture or confined. Some studies have proven this effect with a considerable increase in food consumption and water intake (Cardozo et al., Reference Cardozo, Calsamiglia, Ferret and Kamel2006; Fandiño et al., Reference Fandiño, Calsamiglia, Ferret and Blanch2008). Recent findings have suggested that improvement in animal performance may be due to a host response rather than direct antimicrobial or sensory effects (Oh et al., Reference Oh, Giallongo, Frederick, Pate, Walusimbi, Elias and Hristov2015).
The increase in pH value with doses of CAP may be related to its pungent effect on chili peppers. Ricci et al. (Reference Ricci, Rivera-Chacon, Petri, Sener-Aydemir, Sharma, Reisinger, Zebeli and Castillo-Lopez2021) highlight that the pungent effect increases the rate of salivation, thus increasing the flow of buffers into the rumen environment. In addition, the pungent effect stimulates water consumption (Cunha et al., Reference Cunha, Alba, Leal, Marcon, Souza, Baldissera, Paglia, Kempka, Vedovatto, Zotti and Silva2020) and changes the animals' consumption pattern, in which they start to eat smaller meals throughout the day but without harming the dry matter intake (DMI) (Castillo-Lopez et al., Reference Castillo-Lopez, Rivera-Chacon, Ricci, Petri, Reisinger and Zebeli2021), such changes favour the increase in rumen pH without causing changes in the rumen microbiota.
Additionally, changes in the rumen microbiota may also explain this increase in pH value with CAP doses and changes in ruminal fermentation. The phenolic group of CAP can suppress the growth of bacteria by decreasing membrane stability due to its hydrophobicity (Burt, Reference Burt2004).
Oh et al. (Reference Oh, Giallongo, Frederick, Pate, Walusimbi, Elias and Hristov2015) evaluated the inclusion of Capsicum at doses of 250, 500 and 1000 mg/day in dairy cows and observed a quadratic decrease in Bacteroidales with a tendency towards a linear decrease in Bifidobacteriales. Prevotella and Roseburia bacteria were reduced quadratically with the doses of Capsicum. However, Oh et al. (Reference Oh, Giallongo, Frederick, Pate, Walusimbi, Elias and Hristov2015) observed a tendency for a reduction in rumen pH values, as did Rodríguez-Prado et al. (Reference Rodríguez-Prado, Ferret, Zwieten, Gonzalez, Bravo and Calsamiglia2012) with the inclusion of Capsicum 125, 250 and 500 mg in high-concentrate feedlot beef cattle.
Comparison between studies, even with the same species evaluated, must be made, considering the production system. None of the studies carried out mentioned above used the pasture production system. This system can change the entire ruminal environment and the pattern of intake behaviour and rumination of animals. This result may have occurred in our study, causing greater water consumption, saliva production and buffering due to the pungent effect of Capsicum. Although there was no effect of treatments on HR and RT, it an effect of the hours evaluated on the values of these was observed. The HR increased from 75 beats/min at 10.00 h, the time of supplement supply, to 85 beats/min at midnight.
Nitrogen balance, microbial protein synthesis and concentrations of blood metabolites
CAP supplementation did not affect microbial protein synthesis. However, the animals fed CAP linearly reduced faecal N production and tended to increase linearly for nitrogen balance. A similar behaviour was observed for the digestibility of CP.
The better N balance observed with the inclusion of CAP can be attributed to post-ruminal digestion due to improved pancreatic functions, as previously mentioned. Recent studies in lactating cows have reported no differences in N utilization and balance (Oh et al., Reference Oh, Giallongo, Frederick, Pate, Walusimbi, Elias and Hristov2015; Vittorazzi et al., Reference Vittorazzi, Takiya, Nunes, Chesini, Bugoni, Silva, Silva, Dias, Grigoletto and Rennó2022; Grigoletto et al., Reference Grigoletto, Takiya, Bugoni, Nunes, Junior, Chesini, da Silva, Santos and Rennó2023).
CAP can alter the rumen microbiota, which could also change the metabolism of rumen N, leading to a better N balance. According to Sales et al. (Reference Sales, Lucas and Blanchart2000) the bacteria B. fibrisolvens and Prevotella albensis are the main proteolytic microorganisms present in the rumen, and as already mentioned, CAP supplementation increases the population density of B. fibrisolvens (Oh et al., Reference Oh, Giallongo, Frederick, Pate, Walusimbi, Elias and Hristov2015; An et al., Reference An, Luo, Abdelrahman, Riaz, Gao, Yao, Ye, Nível, Zhao, Chen and Yang2022). On the other hand, Prevotella, which is usually the most abundant bacteria in the rumen and directly involved in N metabolism (Wirth et al., Reference Wirth, Kádár, Kakuk, Maróti, Bagi, Szilágyi, Rákhely, Horváth and Kovács2018), has inconsistent responses regarding the action of CAP. Oh et al. (Reference Oh, Giallongo, Frederick, Pate, Walusimbi, Elias and Hristov2015) observed a reduction in the population density of Prevotella, while Oh et al. (Reference Oh, Harper, Giallongo, Bravo, Wall and Hristov2017a, Reference Oh, Harper, Giallongo, Bravo, Wall and Hristov2017b) and An et al. (Reference An, Luo, Abdelrahman, Riaz, Gao, Yao, Ye, Nível, Zhao, Chen and Yang2022) did not observe any effect of CAP on these bacteria. However, it is possible to infer that there was no difference in rumen proteolysis due to CAP supplementation since there was no effect on microbial production or serum urea concentrations.
Supplementation with CAP caused a quadratic trend in blood glucose concentrations, resulting in improved animal energy metabolism. Studies by Oh et al. (Reference Oh, Giallongo, Frederick, Pate, Walusimbi, Elias and Hristov2015) and Oh et al. (Reference Oh, Harper, Giallongo, Bravo, Wall and Hristov2017b) evaluated that the inclusion of CAP in the diet of lactating cows reduced serum insulin concentration, which may explain the increase in blood glucose since glucose and insulin are negatively correlated (Azarbayejani and Mohammadsadegh, Reference Azarbayejani and Mohammadsadegh2021). This same effect was found by Cunha et al. (Reference Cunha, Alba, Leal, Marcon, Souza, Baldissera, Paglia, Kempka, Vedovatto, Zotti and Silva2020) and An et al. (Reference An, Zhao, Zhang, Gao, Chen, Niu, Nie, Yao, Wei, Riaz and Yang2023) when CAP was included in the diet of sheep and buffaloes, respectively.
Haemogram
Animals fed with CAP showed an increase in lymphocytes and eosinophils and a tendency to an increase in white blood cells than bulls fed with CON. An increased ratio of neutrophils to lymphocytes has been suggested to indicate an acute stress response (Weiss and Wardrop, Reference Weiss and Wardrop2010). Heiner et al. (Reference Heiner, Eisfeld and Lückhoff2003) reported that neutrophils could be directly affected by CAP because they have a transient receptor potential cation channel subfamily V member 1 channel or indirectly affected through the release of neuronal peptides (Zimmerman et al., Reference Zimmerman, Anderson and Granger1992).
Conclusion
The inclusion of encapsulated pepper up to 450 mg/animal/day did not affect cattle's nutrient intake and microbial protein synthesis. Some results were positively obtained with the doses evaluated, especially with the maximum dose, such as increased nutrient digestibility, increased nitrogen balance and increased ruminal pH values. Feeding bulls with CAP up to 450 mg/animal/day can be recommended as it improves ruminal fermentation and nitrogen utilization in pasture cattle.
Acknowledgements
The authors thank NutriQuest Animal Nutrition for providing the products the Federal University of Bahia (UFBA) animals and the infrastructure necessary for the development of this study. Besides, the authors would like to appreciate the National Council for Scientific and Technological Development (CNPq) and Coordination for the Improvement of Higher Education Personnel (CAPES) for the students' fellowship grants.
Author contributions
I. L.: writing – original draft and data curation. J. P.: investigation. L. T.: investigation. F. S.: investigation. G. C.: investigation. C. R.: investigation. M. S.: investigation. M. A.: writing – review and editing. A. P.: investigation. R. S.: investigation. D. P.: software. F. R.: investigation. L. B.: writing – review and editing. J. J.: software, conceptualization, formal analysis, funding acquisition, investigation, methodology and supervision.
Funding statement
This research was supported by the National Council for Scientific and Technological Development (CNPq) (grant number: 421241/2018-7).
Competing interests
None.
Ethical standards
All experimental procedures used in this study were reviewed and approved by the Ethics Committee of Animal Use from the School of Veterinary Medicine and Animal Science of the Federal University of Bahia (UFBA), Salvador, Brazil (permit number: 20/2022).