Introduction
Monte Carlo calculations of dose distributions in a simple geometric phantom,Reference Vassiliev, Kry, Wang, Peterson, Chang and Mohan1 and a treatment planning studyReference Vassiliev, Peterson, Chang and Mohan2 showed that using FFF beams can improve the therapeutic ratio in lung SBRT. This study is an extension of that prior work. Calculation of doses to lung tumours is particularly challenging owing to the density difference between the lung and the tumour. Tumour motion and other anatomical changes caused by respiration are additional complicating factors. For these reasons, in this study, we recalculated previously analysed treatment plansReference Vassiliev, Peterson, Chang and Mohan2 using Monte Carlo simulations. In these calculations, we accounted for intrafractional motion by calculating the dose distribution separately for each of the 10 phases of the respiratory cycle, and then using a deformable registration algorithm to combine (sum) the doses and thereby generate the total accumulated dose delivered to a patient. In these calculations, we used 4DCT image sets. We will refer to the above computational procedure as ‘4D Monte Carlo’. Our main aim was to evaluate the impact of dose calculation uncertainties on key findings of our treatment planning studyReference Vassiliev, Peterson, Chang and Mohan2 that used the analytical anisotropic algorithm (AAA, Varian Medical Systems, Palo Alto CA, USA).
Previous similar studies can be divided into two groups based on the type of dose calculation software they used: a commercial TPS or Monte Carlo software. A few commercial TPSs offer a Monte Carlo dose calculation option. We assigned such studies to the second group. Below, we summarise the previous findings.
TPS-based studies
Vassiliev et al.Reference Vassiliev, Kry, Chang, Balter and Mohan3 demonstrated the feasibility of lung SBRT with FFF beams and reported a substantial reduction in beam-on time when FFF beams were used for this type of treatment. Navarria et al.Reference Navarria, Ascolese and Mancosu4 compared the dosimetric characteristics and treatment outcomes of 86 patients who received three-dimensional (3D) conformal radiation therapy FF treatments and 46 patients treated with FFF volumetric-modulated arc therapy (VMAT). They reported that at 1 year, the local control rate was 100% for patients treated with FFF beams compared with 92.5% for patients treated with FF beams. Additionally, they found a significant reduction of ipsilateral lung doses and beam-on time in FFF mode. Prendergast et al.Reference Prendergast, Fiveash and Popple5 retrospectively reviewed 99 lung and liver SBRT treatments, of which 36 used 10-MV FFF beams. They found that treatment and immobilisation times with the FFF linac were 50% shorter than with a conventional linac. Gasic et al.Reference Gasic, Ohlhues and Brodin6 studied a cohort of 20 patients with early-stage lung cancer. For each patient, they developed four VMAT treatment plans that used 6- and 10-MV FF and FFF beams. They did not find significant differences in target coverage between FF and FFF plans, and they found comparable doses to organs at risk. FFF beams substantially improved beam delivery times. Lu et al.Reference Lu, Lin, Lin and Huang7 addressed the question of the optimal energy for RapidArc® treatments with FFF beams. They found that lower doses to organs at risk were achieved with 6-MV FFF beams than with 10-MV FFF beams. This improvement translated into a normal tissue complication probability (NTCP) for the lung that was lower by a factor of 1.07–1.11 depending on the fractionation. Thus, 6-MV beams had a clear advantage over 10-MV beams. Tambe et al.Reference Tambe, Fryer and Marsden8 compared RapidArc® treatments with 6-MV FF, 6-MV FFF, and 10-MV FFF beams. Both FFF energies showed improvements in dose distributions over 6-MV FF treatments. The study confirmed that 6 MV is a better energy choice than 10 MV for FFF beams because 6-MV FFF plans had better coverage of the PTV and lower doses to the spinal cord, oesophagus, heart, lung, and chest wall. Pokhrel et al.Reference Pokhrel, Halfman and Sanford9 investigated VMAT treatments with 6-MV FF and FFF beams for 13 patients undergoing lung SBRT. They reported that FFF beams achieved modestly lower doses to some organs at risk, including the lung, and reduced beam-on time by a factor of 2.3. This group has also reported early patient follow-up data.Reference Pokhrel, Sanford and Dhanireddy10 The median follow-up time was 8 months, and the range was 3–15 months. The local control rate was 100% and none of the patients developed acute lung or rib toxicity. In a treatment planning study, Vassiliev et al.Reference Vassiliev, Peterson, Chang and Mohan2 investigated lung SBRT treatments with 6-MV FF and 6-MV FFF beams for 15 patients. For the PTV, FFF plans improved several parameters: D98, D95, D90, the homogeneity index (HI), and uncomplicated tumour control probability (UTCP). For the normal lung, FFF plans lowered the mean lung dose, V10, V20, V30, and NTCP. For most patients, FFF beams also achieved lower doses to the oesophagus, heart, spinal cord, and chest wall.
Overall, most of the above studies support the feasibility of achieving better dose distributions by replacing FF beams with FFF beams. The improvements they showed, however, were modest. Therefore, uncertainties in dose distributions associated with the limitations of commercial dose algorithms and with intrafractional anatomical changes that were not accounted for may have significantly impacted some of these findings. The following studies reduced dose uncertainties by using Monte Carlo algorithms and, in some cases, by accounting for respiratory motion.
Monte Carlo-based studies
Chan et al.Reference Chan, Kwong, Ng, Tam and Tong11 analysed data for 25 lung cancer patients treated with a CyberKnife® system (Accuray, Sunnyvale CA, USA), which does not have a flattening filter. All the calculations were performed within the MultiPlan® TPS, which includes a Monte Carlo dose algorithm and tools for deformable image registration. The study compared Monte Carlo calculations for static 3D representations of a patient anatomy with Monte Carlo calculations performed using 4DCT image sets, thereby accounting for respiratory motion. It found that the 3D-based calculations overestimated the volume receiving the prescribed dose by 5.2% on average and D99 for the gross tumour volume (GTV) by 2.6%. Doses to normal tissues, however, did not substantially differ between 3D- and 4D-based calculations. Li et al.Reference Li, Galvin, Harrison, Timmerman, Yu and Xiao12 compared the accuracy of the XiO superposition dose algorithm with that of the Monaco Monte Carlo algorithm (both by CMS, Inc., St Louis MO, USA) using 15 study sets from the Radiation Therapy Oncology Group 0236 trial. They found that Monte Carlo doses were higher; the ratios of 100 and 50% prescription isodose volumes to PTV, the maximal dose at 2 cm from PTV, and V20 for the lung were higher by 9, 12, 7, and 18%, respectively. Gete et al.Reference Gete, Teke and Kwa13 evaluated the accuracy of the AAA algorithm by comparing it to that of the BEAMnrc/DOSXYZnrc Monte Carlo systemReference Rogers, Walters and Kawrakow14,Reference Walters, Kawrakow and Rogers15 . They generated dose distributions for nine lung cancer patients. The average differences between the two algorithms were under 0.2% for lung dosimetric indices and 0.3 Gy for maximum doses to normal tissue. The AAA algorithm overestimated minimum dose to the PTV by 3.8% on average. Chetty et al.Reference Chetty, Devpura and Liu16 compared several commercial dose algorithms with a Monte Carlo algorithm in a large cohort of 133 patients with lung cancer who were treated with SBRT. They found that D95 for the PTV calculated with the commonly used AAA and collapsed cone convolution (CCC) algorithms agreed with Monte Carlo within 0.6%. Discrepancies in the tumour control probability (TCP), however, were larger, reaching an average of 3% for small tumours. This suggests that some dosimetric indices were more sensitive to dose uncertainties than D95 was. Differences between AAA, CCC, and Monte Carlo in mean lung dose were mostly within 2%. Ojala et al.Reference Ojala, Kapanen, Hyödynmaa, Wigren and Pitkanen17 compared several commercial algorithms and the BEAMnrc/DOSXYZnrc Monte Carlo system.Reference Rogers, Walters and Kawrakow14,Reference Walters, Kawrakow and Rogers15 Monte Carlo doses were calculated only for 4 patients and compared only to the Acuros XB (AXB) algorithm (Varian Medical Systems, Palo Alto CA, USA). AXB is a new-generation algorithmReference Vassiliev, Wareing, McGhee, Failla and Salehpour18 that performs better than AAA in challenging cases.Reference Bush, Gagne, Zavgorodni, Ansbacher and Beckham19 Nevertheless, in the worst case, the difference between Monte Carlo and AXB for PTV D95 was 11%. In contrast, the maximum differences for lung V30 and for the maximum dose to the spinal cord were only 1.5%. Zhao et al.Reference Zhao, Qi and Yin20 compared dose distributions calculated with CCC and Monte Carlo algorithms. They used the Oncentra Masterplan TPS (Elekta, Stockholm, Sweden) with CCC and the BEAMnrc/DOSXYZ Monte Carlo system.Reference Rogers, Walters and Kawrakow14,Reference Walters, Kawrakow and Rogers15 For each of 24 cancer lung patients, they developed both 3D conformal and intensity-modulated radiation therapy treatment plans. They found that the CCC algorithm overestimated key dosimetric indices for the lung, but only by 1–2%. The differences between CCC and Monte Carlo were substantially larger for the PTV. For example, the differences in D98 and D95 for the GTV exceeded 5%. Vassiliev et al.Reference Vassiliev, Kry, Wang, Peterson, Chang and Mohan1 calculated dose distributions delivered to a simple thorax phantom by 6-MV FF and FFF beams at a spatial resolution of 0.5–1 mm. They investigated the impact of tumour size and lung density on the differences between FF and FFF doses in a lung tumour and its vicinity. With FFF beams, consistent, albeit modest, target dose enhancement was reported. Freislederer et al.Reference Freislederer, Munchow and Kamp21 performed 4D Monte Carlo dose calculations for five lung patients using Hyperion software (Elekta, Stockholm, Sweden). The study reported that Monte Carlo 4D and 3D doses were ‘comparable’.
In summary, most of the above studies reported small, 1–2%, differences between Monte Carlo and TPS doses to organs at risk. However, discrepancies were consistently larger and often not negligible for dosimetric indices characterising target coverage. Only two studiesReference Chan, Kwong, Ng, Tam and Tong11,Reference Freislederer, Munchow and Kamp21 accounted for respiratory motion by using 4D Monte Carlo algorithms, and only twoReference Vassiliev, Kry, Wang, Peterson, Chang and Mohan1,Reference Chan, Kwong, Ng, Tam and Tong11 considered FFF beams. Of the two that used FFF beams, oneReference Chan, Kwong, Ng, Tam and Tong11 considered a CyberKnife® accelerator, and the otherReference Vassiliev, Kry, Wang, Peterson, Chang and Mohan1 considered a geometric phantom, not patient CT images. Chan et al.Reference Chan, Kwong, Ng, Tam and Tong11 did not compare FFF and FF beams. Our study extends and complements this previous work. We calculated dose distributions for 15 patients who had lung tumours treated with SBRT. Each patient had two treatment plans: the original plan with FF beams, which was used for the treatment, and a new plan that we developed for comparison using a TrueBeamTM accelerator (Varian Medical Systems, Palo Alto Ca, USA) in the high-intensity mode (i.e., FFF). We performed all calculations using the BEAMnrc/DOSXYZ Monte Carlo softwareReference Rogers, Walters and Kawrakow14,Reference Walters, Kawrakow and Rogers15 and with 4DCT image sets to account for respiratory motion.
Methods and Materials
Patient cohort
This retrospective study was approved by our Institutional Review Board. We selected 15 patients treated for early-stage lung cancer at our institution. The main selection criterion was the use of SBRT. We aimed to include tumours of different sizes and locations. All the treatments used 6-MV FF photon beams. The patients’ characteristics are summarised in Table 1. The table includes the average ipsilateral lung density, because we had previously shown that it affects the tumour dose coverage.Reference Vassiliev, Kry, Wang, Peterson, Chang and Mohan1 We derived the density using a method described by Pokhrel et al.Reference Pokhrel, Halfman and Sanford22
Patient characteristics

Abbreviations: GTV, gross tumour volume; PTV, planning target volume; c.w., chest wall; mediast., mediastinum; diaph., diaphragm.
Treatment planning
We imported the original treatment plans from our clinical database into the Eclipse 13.6 TPS (Varian Medical Systems, Palo Alto CA, USA). Then, in all the plans, we changed all beams to the 6-MV FFF mode without changing the beam setup. Next, we reoptimised each plan, aiming to achieve the same tumour coverage as in the original plan while minimising dose to the organs at risk. We used the AAA algorithm for dose calculation because it is one of the most commonly used algorithms and belongs to the same category, ‘type b’,Reference Knoos, Wieslander and Cozzi23 as another widely used algorithm, CCC. We used the average CT image for planning. The beams were static and the MLC mode was step-and-shoot. The calculation grid size was 2.5 mm. A complete dosimetric analysis of the new FFF plans is given elsewhere.Reference Vassiliev, Peterson, Chang and Mohan2 The main finding was that by using FFF beams, doses to organs at risk could be lowered without compromising tumour coverage.
Monte Carlo dose calculation
We used the BEAMnrc/DOSXYZnrc Monte Carlo systemReference Rogers, Walters and Kawrakow14,Reference Walters, Kawrakow and Rogers15 and representative phase-space files for TrueBeamTM provided by the manufacturer in support of Monte Carlo research. The files store parameters such as phase coordinates for all particles that reach a plane immediately upstream of the movable jaws. The phase-space files have been validated for both FF and FFF beams.Reference Constantin, Perl and LoSasso24–Reference Belosi, Rodriguez and Fogliata26 In our simulations, particle trajectories begin in the phase-space plane. Below this plane, the design of the TrueBeamTM beamline is very similar to that of the Clinac 2100 accelerator.Reference Rodriguez, Sempau, Fogliata, Cozzi, Sauerwein and Brualla27 Hence, we can use our previously validated model of a 2100 series accelerator,Reference Cho, Vassiliev, Lee, Ibbott and Mohan28 which includes a detailed representation of the MillenniumTM 120 multileaf collimator (MLC) (Varian Medical Systems, Palo Alto CA, USA).Reference Jang, Vassiliev, Mohan and Siebers29
For all the patients in the study cohort, 4DCT image sets were acquired. Each set consisted of 10 three-dimensional computed tomography (3DCT) images corresponding to the 10 phases of the respiratory cycle. We converted each 3DCT image into a voxelised phantom and saved the phantom data to a file in a format suitable for import into the DOSXYZnrc program. The phantom did not include CT slices that were above or below the 1% isodose. Those slices that were included in the phantom were not truncated in the axial plane. All the phantom voxels were 2-mm cubes.
We performed the simulations in two steps. In the first step, we transported particles through the jaws and the MLC. MLC leaves were moving in a step-and-shoot manner following the instructions recorded in the DICOM treatment plan file. For each beam, a phase-space file was created where parameters of all particles that reached a plane immediately below the MLC were recorded. In the second step, these phase-space files served as a source of particles incident on the voxelised patient phantom. This source accounted for the gantry, couch, and collimator rotation angles, again using the data stored in the treatment plan file. For each patient, the same phase-space files were used for each of the 10 phantoms representing the 10 phases of the respiratory cycle. The total number of particles incident on each phantom per beam was 6 billion. The number of beams was 6–9 per plan. The statistical uncertainties (1σ) of the calculated dose in a voxel were lower than approximately 0.4% in those voxels that received more than 80% of the maximum dose. These voxels were located in the PTV and the volume surrounding it. The dosimetric indices that we report are integral quantities that involve large numbers of voxels and therefore have much lower uncertainties than the voxel dose.
Calculation of accumulated dose
After dose distributions for all respiratory phases were calculated, we mapped those distributions onto the CT image taken at the end of exhalation. We used the hybrid intensity and structure-based deformable registration algorithm implemented in the RayStation TPS (RaySearch Laboratories, Stockholm, Sweden). A multi-institutional studyReference Kadoya, Nakajima and Saito30 evaluated the performance of several commercial deformable image registration algorithms in the thoracic region. They found that the average 3D registration error for the algorithm that we used was 1.26 mm, lower than the values reported for other algorithms. For each patient, we summed the resulting 10 dose distributions and thereby calculated the distribution of the total dose delivered to a patient’s target volume over the treatment course. The summation reduced the statistical uncertainties in a dose per voxel to about 0.1% and less in voxels that received more than 80% of the maximum dose.
Parameters of dose distribution
For each FF or FFF treatment plan, we calculated multiple dose–volume histogram indices characterising target coverage. Doses to the organs at risk were reported in our previous study.Reference Vassiliev, Peterson, Chang and Mohan2 We also calculated the HI, defined as HI = (D2−D98)/D50,31 and the conformity index (CI), which is the ratio of the volume receiving at least the prescription dose, V(Dx), to the PTV.
Treatment outcome predictors
We described calculation of the TCP and NTCP in our previous paper.Reference Vassiliev, Peterson, Chang and Mohan2 Briefly, to calculate the TCP, we followed the method formulated by Chetty et al.,Reference Chetty, Devpura and Liu16 Webb and Nahum,Reference Webb and Nahum32 and Guckenberger et al.Reference Guckenberger, Richter, Wilbert, Flentje and Partrige33 We calculated NTCP for the normal lung (i.e., lung minus GTV) using the method developed by Selvaraj et al.Reference Selvaraj, Lebesque and Hope34 The model was a Lyman–Kutcher–Burman type with a logistic local dose–effect relation for perfusion loss derived from single-photon emission CT imaging data. We also calculated the UTCP, which is the product TCP × (1−NTCP).
Statistical analysis
Continuous variables are summarised by the median and range across subjects. All reported p-values comparing the FF and FFF beams were obtained from the Wilcoxon signed-rank test using the paired values for FF and FFF for each subject. A p-value < 0·05 was considered to be significant. The analysis was performed in MATLAB R2017b and R version 3.5.0.
Results and Discussion
TPS versus 4D Monte Carlo
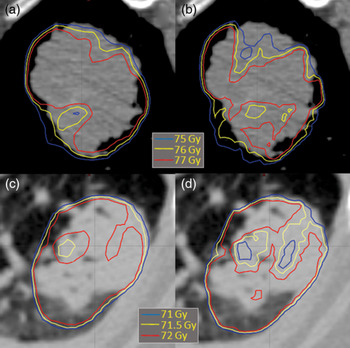
First, we compared target dose distributions generated by the TPS with accumulated doses calculated with Monte Carlo. The data are summarised in Table 2. The overall trend was that 4D Monte Carlo calculations produced worse target dose coverage than that predicted by the TPS. Figure 1 compares ratios, Monte Carlo to TPS, of several dosimetric indices for the PTV. For most patients, the TPS over-predicted indices characterising low-dose regions: D100, D98, and D95. Similarly, the Monte Carlo-calculated HI and CI were worse than the TPS predictions. The differences between Monte Carlo and TPS were significant (p < 0·05) for D100 and CI. For the GTV, the same trend was observed for D100, HI, and CI, whereas there were no systematic differences in D98, D95, and D90. Figures 2 and 3 show dose–volume histograms for patients 8 and 10, who had relatively large and small tumours, respectively. The case shown in Figure 2 is interesting in that Monte Carlo calculations revealed a cold spot in the GTV, a small volume where the dose was lower by 9.3 Gy than that predicted by the TPS. Figure 3 shows a more typical case in which the TPS only slightly over-predicted the dose to a relatively large part of the GTV. In this case, in 14% of the GTV, the Monte Carlo dose was lower by ~0.6 Gy than that calculated by the TPS. Dose coverage of the PTV showed a similar pattern, with Monte Carlo dose lower than the TPS dose by 0.2–0.5 Gy in about 2% of the volume. In Figure 4, we compare target dose distributions for patients 7 (Figures 4a and 4b) and 8 (Figures 4c and 4d). Both tumours were close to 5 cm in diameter, which exceeded the depth of ~1.5 cm needed to achieve electronic equilibrium. The data in Figure 4 are representative of the general pattern of discrepancies between the TPS (Figures 4a and 4c) and Monte Carlo calculations (Figures 4b and 4d). The differences were only about 1–2 Gy and were more likely to be seen near lung–tumour interfaces. This is consistent with a previous Monte Carlo analysis that used a simple geometric phantom.Reference Vassiliev, Kry, Wang, Peterson, Chang and Mohan1 However, in contrast to the phantom calculations, the patterns of discrepancies shown in Figure 4 are rather irregular because of the heterogeneities and the modulation of the beam intensity. Good agreement between the TPS and Monte Carlo doses is seen in Figures 4c and 4d in the region where the tumour is adjacent to the chest wall and where, therefore, electronic equilibrium was likely achieved.
Target coverage: treatment planning system (TPS) versus Monte Carlo (MC), both FF; and FF versus FFF, both MC. The dosimetric indices are reported as a percentage of the prescription dose

Abbreviations: GTV, gross tumour volume; HI, homogeneity index; CI, conformity index; TCP, tumour control probability; UTCP, uncomplicated tumour control probability; PTV, planning target volume.
Ratios of dosimetric indices for the PTV were calculated with Monte Carlo (MC) to those predicted by the TPS. Red lines are the medians, blue boxes are interquartile ranges, black dashed lines are ranges, and red crosses are outliers. Abbreviations: HI, homogeneity index; CI, conformity index.

Dose–volume histogram for patient 8. The prescription dose is 70 Gy. Data for GTV and PTV, FF and FFF plans, calculated with Monte Carlo and a TPS are shown as indicated in the key.

Dose–volume histogram for patient 10. The prescription dose is 50 Gy. Data for GTV and PTV, FF and FFF plans, calculated with Monte Carlo and a TPS are shown as indicated in the key. In this case, doses to all organs at risk in the FFF pans were lower or the same as in FF plans. For example, NTCPs for the lung was 2.4 (FFF) and 2.7% (FF).

Target coverage for patients 7 (a,b) and 8 (c,d). Comparison of dose distributions predicted by a TPS (a,c) with those calculated with Monte Carlo (b,d).

Our results are consistent with findings of previous Monte Carlo based studies. For example, Li et al.Reference Li, Galvin, Harrison, Timmerman, Yu and Xiao12 noted that Monte Carlo calculations produced a ratio of prescription isodose volume to the PTV (i.e., CI) that was higher by 9% than that predicted by a superposition algorithm. Our calculations, similarly, showed that Monte Carlo CI was higher by 7.6% on average than the AAA result. Gete et al.Reference Gete, Teke and Kwa13 found that the AAA algorithm overestimated the minimum PTV dose by 3.8% on average. Our data also showed overestimation but by 9.5% on average. According to Chetty et al.,Reference Chetty, Devpura and Liu16 D95 values for the PTV calculated with the AAA algorithm were higher than Monte Carlo values by 0.84% on average. In our calculations, the average overestimation of D95 for the PTV by the AAA algorithm was 0.36%. Some differences in the above-average values can be attributed to patient-to-patient variability and to differences in computational methods.
FFF versus FF
Next, we compared target dose distributions for FF and FFF plans; both are accumulated doses that we calculated with Monte Carlo using 4DCT datasets. The data are summarised in Table 2. For most patients, replacing FF beams with FFF beams improved target coverage. Figure 5 shows box plots of FFF-to-FF ratios for several indices characterising dose distribution in the GTV. For about three-fourths of the patients, FFF beams improved D90, D95, D98, and D100 (i.e., the minimum dose). Higher doses delivered to the GTV by FFF beams resulted in improved TCP. However, only UTCP improvements were significant. Similar, but more modest, improvements were achieved with FFF beams in PTV dose distributions, and again only the UTCP improvements were significant. These findings reflect our approach to treatment planning with FFF beams; we prioritised lowering doses to organs at risk over improving target coverage that was achieved in FF plans. FFF beams elevate doses compromised by electronic disequilibrium near the tumour edge.Reference Vassiliev, Kry, Wang, Peterson, Chang and Mohan1 This property allowed us to lower doses to organs at risk without compromising target coverage. These improvements were particularly consistent for the lung resulting in better UTCPs.
Ratios of dosimetric indices for the GTV for FFF plans to those for FF plans. All dose distributions were calculated with Monte Carlo. Red lines are the medians, blue boxes are interquartile ranges, black dashed lines are ranges, and red crosses are outliers. Abbreviations: HI, homogeneity index; CI, conformity index.

The dose–volume histogram shown in Figure 3 is an example of the substantial improvement of target coverage that can be achieved with FFF beams. Doses to both the GTV and PTV were improved. For the GTV, use of FFF beams increased the minimum dose by 2.9 Gy and produced a more uniform dose distribution. For some patients, however, FFF plans did not improve GTV coverage (Figure 5).
Differences in target volumes dose distributions were small. For this reason, in most cases, our analysis did not produce statistically significant conclusions. To overcome this limitation, a much larger cohort size is required. In this study, we performed full Monte Carlo simulations at a high spatial resolution, for each of the 10 phases of respiratory motion. This is a computationally expensive approach that is not feasible for a substantially larger cohort. For treatment planning, we used a ‘type b’ algorithm, the AAA. It would be interesting, in a future study, to compare our findings with a similar analysis based on a ‘type c’ algorithm, such as AXB.
Conclusions
Calculation of dose distributions in the thoracic region is challenging owing to the large density gradients and respiratory motion that causes tumour displacement, deformation of the entire region, and changes in lung density. In this study, we focused on the dose distribution in the target volume because previous studies reported relatively low uncertainties in doses to organs at risk. We found that Monte Carlo simulations tended to reveal worse target dose coverage, especially in colder regions of the target volume, than a commercial TPS predicted. The discrepancies between Monte Carlo and TPS calculations ranged from negligible to, in rare cases, moderate. These findings were consistent with most of the previous studies that we reviewed. The results of this study are, overall, consistent with our previous treatment planning studyReference Vassiliev, Peterson, Chang and Mohan2 in that using FFF beams tended to improve target coverage. This improvement was modest because in FFF treatment planning, we prioritised lowering doses to organs at risk over improving target coverage that was achieved in FF plans. To compare the overall quality of treatment plans, we calculated UTCP, which accounts for both tumour control and risks of normal tissue complications. We found that in the plans with FFF beams, UTCPs were significantly higher than they were in the FF plans. In summary, our data support the feasibility of improving the therapeutic ratio in lung SBRT by using FFF beams instead of FF beams.
Acknowledgements
The authors acknowledge the Texas Advanced Computing Center (TACC) at The University of Texas at Austin for providing high-performance computing resources for all Monte Carlo calculations reported in this paper. Editorial support was provided by Amy Ninetto in Editing Services, Research Medical Library, The University of Texas MD Anderson Cancer Center.
Financial Support
This study was supported by the National Institutes of Health through a grant R03 CA211143. In addition, this work used MD Anderson’s Biostatistics Resource Group, which is supported by the National Institutes of Health through grant P30 CA016672.
Conflicts of Interest
None.
Ethical Standards
This study has been approved by the Institutional Review Board.