

Introduction
Agarose can be degraded into agar oligosaccharides by agarase. Since the first degradable Pseudomonas agarase (Pseudomonas atlantica) was isolated by Groleau and Yaphe (Reference Groleau and Yaphe1977), a large number of agarase have been purified from marine and soil microorganisms (Young et al., Reference Young, Bhattacharjee and Yaphe1978; Sugano et al., Reference Sugano, Matsumoto, Kodama and Noma1993; Hosoda et al., Reference Hosoda, Sakal and Kanazawa2003), most of which are β-agarase (Ma and Shi, Reference Ma and Shi2008). In 1984, the agarase gene of Streptomyces coelicolor A3 (2) strain M130 was cloned and the recombinant enzyme with a molecular weight of 28 kDa obtained (Kendall and Cullum, Reference Kendall and Cullum1984). Once the sequences of agarose gene DagA in Streptomyces coelicolor had been reported (Bibb et al., Reference Bibb, Jones, Joseph, Buttner and Ward1987), the entire 1422-bp sequence of the β-agarase I DagA gene of the Pseudoalteromonas atlantica 19262 strain was published in NCBI (accession no. M73783). The signal peptide sequence was identified from 401 to 463 bp and the coding sequence encoding 290 amino acids from 464 to 1270 bp. Although β-agarases from different sources have similar functions, there are many differences in the amino-acid sequence, molecular weight and enzymatic properties (Wang and Zhang, Reference Wang and Zhang2006). To date there have been no reported studies on the high-level expression of β-agarase I DagA. In order to widen the range of sources of agarose and better exploit and apply β-agarase I DagA, in this study we cloned the gene of β-agarase I DagA, improved the efficiency of its protein expression using a molecular chaperone co-expression method, and conducted a preliminary analysis of its biological activity and enzymatic properties after obtaining the β-agarase by refolding the inclusion body, providing a technical basis for β-agarase production from prokaryotic cells.
Materials and methods
Strains, vectors and main reagents
Escherichia coli strains ER2566 and JM109, chromosomal DNA of Pseudoalteromonas atlantica 19262 and plasmid pET21a were provided by Key Laboratory for Molecular Biology of Agriculture, Shaanxi Province, China. Plasmids of pAcycDsb and pAcycFkp, which contain molecular chaperones with disulphide isomerase (DsbC) and E. coli prolyl cis-trans isomerase (FkpA), respectively, were provided by Dr Zhang Shoutao (Zhang et al., Reference Zhang, Shi, Zhao, Qi and Guo2006). Plasmid pMD19-T was purchased from TaKaRa (Dalian, China).
A plasmid DNA extraction kit and gel DNA extraction kit were purchased from Broad Tektronix Inc. (Beijing, China). Protein purification resin 50% Ni-NTA was purchased from Qiagen Company (Hilden, Germany). Low-molecular-weight protein markers were purchased from Fermentas Inc. (Lithuania). Taq DNA polymerase, T4 DNA ligase, 2-Log DNA ladder, EcoR I and Hind III were purchased from NEB Inc. (Ipswich, USA), and ampicillin (Amp), chloramphenicol (Cam) and IPTG were purchased from Sigma Corporation (St. Louis, USA).
Primer synthesis
Two primer pairs were designed in accordance with the β-agarase DagA I gene sequence reported by NCBI:
1. Upstream primer Ag01: 5′-CCCGAATTCATGAAACAGCTAAAGCTACTAATA-3′
EcoR I
Downstream primer Ag02: 5′-CCCAAGCTTTTACTGGGCTTTATAAACTCGTAT-3′
Hind III
This could amplify the ORF sequences of the β-agarase DagA I gene, including the signal peptide, with the amplified fragment expected to be close to 873 bp long.
2. Upstream primer Ag03: 5′-CCCGAATTCATGGCTGATTGGAGCTCTTTTAGTATT-3′
EcoR I
The initiation codon ATG after the restriction sites was added.
Downstream primer Ag04: 5′-CCCAAGCTTTTACTGGGCTTTATAAACTCGTAT-3′
Hind III
This could amplify the fragment without the signal peptide, with the amplified fragment expected to be close to 873 bp long. These primers were synthesized by Shanghai Bio-engineering Co., Ltd. (China).
Amplification of DagA fragments by PCR
The target fragment from Pseudoalteromonas atlantica 19262 genomic DNA was amplified by polymerase chain reaction (PCR) using the two sets of primers mentioned above. The PCR reaction system comprised 1 μl of the template DNA, 1 μl of each 1 nmol/l primer, 1 μl of the 10 mol/l dNTP, 3 μl of 10× buffer, 0.5 μl of 5000 U/ml Taq DNA polymerase and 22.5 μl of ddH2O.
The reaction procedure included the following steps: pre-denaturation at 94°C for 2 min, then three steps repeated for 25 cycles (denaturation at 94°C for 1 min, annealing at 50°C for 1 min and extension at 72°C for 1.5 min), then a final extension phase of 72°C for 10 min.
Construction of the DagA expression vector
Targeted fragments were ligated with plasmid pMD19-T and then transferred into competent cells of JM109. Clones showing agarase activity were selected and marked as JM109-pMD-DagA and JM109-pMD-DagA(▽), respectively; the fragment inserted into plasmid pMD19-T was sequenced to confirm that the sequences were correct. The extracted plasmid DNA was double digested by EcoR I and Hind III, and the targeted fragments were purified and ligated with pET21a, then transferred into competent cells of JM109. After colony PCR identification, the fragment inserted into plasmid pET21a was sequenced to confirm that the sequences were correct and the reading-frames kept unchanged and marked as pET21a-DagA and pET21a-DagA(▽), respectively.
Transformation and screening of expression vector
Constructed expression vectors were transferred into competent cells of ER2566 with CaCl2. The positive clones were screened and marked as ER2566-pET21a-DagA and ER2566-pET21a-DagA(▽), respectively. These two strains were cultured separately to prepare competent cells. Plasmids of pAcycDsb and pAcycFkp were transferred into the competent cells of ER2566-pET21a-DagA and ER2566-pET21a-DagA(▽). After screening by Luria-Bertani (LB) agar plate (containing 100 mg/l Amp and 40 mg/l Cam), the positive clones were marked with ER2566-pET21a-DagA-DsbC, ER2566-pET21a-DagA(▽)-DsbC, ER2566-pET21a-DagA-FkpA and ER2566-pET21a-DagA(▽)-FkpA.
Screening of high-efficiency expression strains
The six constructed strains mentioned in the previous section were cultured until the absorbance value at 600 nm reached 0.6. IPTG was added to the culture solution until the concentration of IPTG reached 1 mmol/l. The target protein expression was induced and cultured continuously at 37°C for 4 h. After collection of bacteria cells by centrifugation, the cell walls were broken by repeated freeze/thaw cycles. The strains that had the highest protein production were selected by sodium dodecyl sulphate polyacrylamide gel electrophoresis (SDS-PAGE) detection.
Analysis of the expression of DagA recombinant protein
Following enlarged culture of selected high-level expressing recombinant bacteria, four-hour induced expression and one-minute centrifugation at 12 000 rpm, bacteria were harvested. Cells collected by centrifugation from 50 ml of culture solution were re-suspended in 5 ml ultrasonic lysis buffer (20 mmol/l Tris-HCl (pH 7.6), 100 mmol/l NaCl, 1 mmol/l EDTA). After sonication of the cells and centrifugation, the supernatant and sediment were analysed by SDS-PAGE.
Optimization of expression conditions
The expression conditions were optimized by the following steps. When the A 600 nm absorbance of the bacteria in the culture medium was measured to be 0.6, IPTG was added to the medium to obtain batches with concentrations of 0.2, 0.4, 0.6, 0.8, 1.0, 1.5, 2.0 and 3.0 mmol/l. After culture for 4 h at 37°C, bacterial cells were harvested, broken and analysed by SDS-PAGE to determine which of these IPTG concentrations was optimum. Subsequently, when the A 600 absorbance was 0.6, IPTG was added into the medium until reaching this optimal IPTG concentration. To determine the optimum IPTG concentration the bacterial culture medium was sampled once an hour and SDS-PAGE analysis carried out.
Refolding of the inclusion body protein
The precipitate was collected after ultrasonication to lyse the cells and centrifugation. After washing the precipitate twice using 2 mol/l urea, the target proteins were renatured and dissolved in 8 mol/l of urea. The solution containing target protein was passed through the Ni-NTA purification column (see manufacturer instructions, Qiagen Company). After washing the column with washing buffer, the target proteins were eluted using an elution buffer. The product proteins were collected by dialysis bag and dialysed for 4 h in 8.0, 6.0, 4.0 and 2.0 mol/l urea and ddH2O, successively, one following the other. After centrifugation for 20 min at 12 000 rpm, the supernatant was collected, and renatured protein DagA obtained.
Protein activity identification of DagA
Method one
LB agar plate was made by mixing and heating 2% (M/V) agar solution with 0.15 mol/l NaCl and 50 mmol/l Tris-HCl (pH 7.0), and punched with wells. β-agarase I (NEB, as control) and renatured DagA were added to the wells. The results were observed after an 8 h incubation at 37°C.
Method two
The content of hydrolysis product, soluble oligosaccharides, was determined using 3,5-dinitrosalicylic acid (DNS) colorimetric determination. We used seven 1.5-ml centrifuge tubes, each containing 1% low melting agarose (100 μl) and purification protein solution (1 μl). The tubes were heated for 1 h at 37, 42, 45, 50, 55, 60 and 65°C, respectively, and were removed and cooled in ice water for 30 min. After centrifugation at 12 000 rpm for 15 min, the supernatant was collected and used to determine the optimal reaction temperature of renatured DagA using the DNS method.
Method three
Ten 1.5-ml centrifuge tubes were used to hold 1% low melting agarose (100 μl) and renatured DagA protein solution (1 μl), and the agarose prepared with buffer of varying pH: 4.0, 4.4, 5.0, 5.4, 5.8, 6.2, 6.6, 7.0, 7.4 and 8.0. The tubes were heated at the optimum temperature in a water bath and then cooled for 30 min on ice. After centrifugation at 12 000 rpm for 15 min, the supernatant was collected and used to determine enzyme activity and the optimal pH range for renatured DagA.
Results and analysis
Target gene sequence analysis
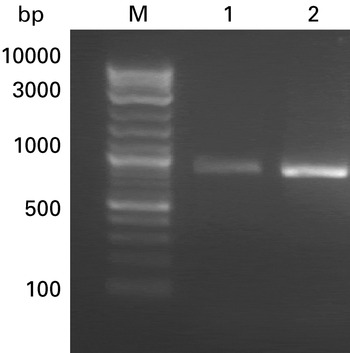
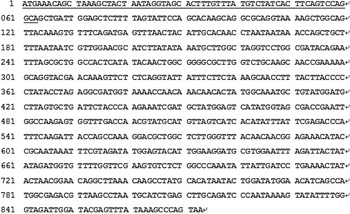
The target fragments DagA and DagA(▽) (see Fig. 1), obtained from Pseudoalteromonas sp. 19262 genomic DNA, were sequenced. The results are shown in Fig. 2. Two nucleotides in the signal peptide region were different from those published with NCBI. The ORF sequences of DagA were 873 bp in length, and the coding region of DagA(▽) was exactly the same as the published ones, for which the ORF were 813 bp in length.
PCR products analysis of DagA and DagA(▽). Lanes: M, 2-log DNA ladder; 1, PCR products of DagA; 2, PCR products of DagA(▽).

Sequence of DagA. The underlined 63 bases encode signal peptide.

The amino-acid sequence of DagA(▽) was deduced using DNA Star 5.0, and the software predicted that DagA(▽) encoded protein with 270 amino-acid residues. The amino acids of DagA(▽) were analysed by BLASTP on NCBI. The results show that DagA(▽) has identical structural characteristics to β-agarase from family GH-16.
Construction of the expression vector
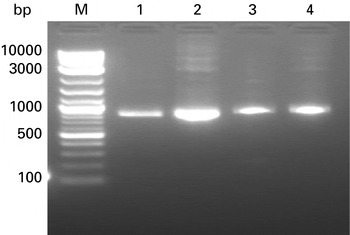
The inserted target fragments of DagA and DagA(▽) in strains of JM109-pET21a-DagA and JM109-pET21a-DagA(▽) had lengths of 873 bp and 813 bp, respectively (see Fig. 3), as determined using PCR analysis. The results were consistent with expectations, and showed that the target gene had been transferred into the expression vector.
PCR analysis of strain of JM109-pET21a-DagA and JM109-pET21a-DagA(▽). Lanes: M, 2-log DNA Ladder; 1 and 2, JM109-pET21a-DagA(▽) strain; 3 and 4, JM109-pET21a-DagA strain.

Screening of the high-level expression system
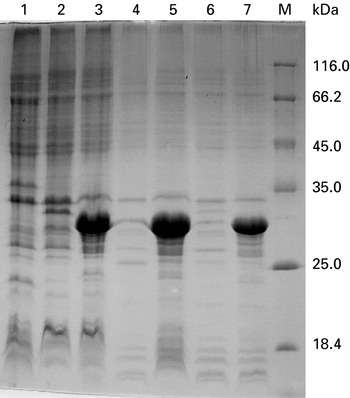
The six strains, ER2566-pET21a-DagA, ER2566-pET21a-DagA(▽), ER2566-pET21a–DagA-DsbC, ER2566-pET21a-DagA(▽)-DsbC, ER2566-pET21a-DagA-FkpA and ER2566-pET21a-DagA(▽)-FkpA, were induced to express the target proteins through the addition of IPTG, and the target proteins analysed with 15% SDS-PAGE.
Expression of protein DagA could be induced in all six strains, but the strains with DagA(▽) had a higher yield of target protein (see Fig. 4), and the strain of ER2566-pET21a-DagA(▽)-DsbC had the highest yield overall at 60% of whole cell proteins. This was therefore chosen as the engineering strain for DagA(▽) production to be used in the next step.
Analysis of recombinant expression of protein among six strains by 15% SDS-PAGE. Lanes: 1, ER2566 as control; 2, ER2566-pET21a-DagA; 3, ER2566-pET21a-DagA(▽); 4, ER2566-pET21a-DagA-DsbC; 5, ER2566-pET21a-DagA(▽)-DsbC; 6, ER2566-pET21a-DagA-FkpA; 7, ER2566-pET21a-DagA(▽)-FkpA; M, low-molecular-weight protein marker.

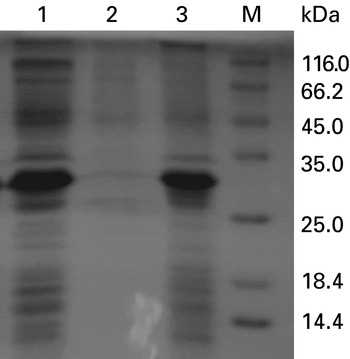
The cell walls of bacteria from the strain of ER2566-pET21a-DagA (▽)-DsbC were broken down after ultrasonication and centrifugation, and the supernatant and sediment removed using SDS-PAGE (Fig. 5). The results showed that DagA proteins were predominantly located in the sediment, indicating that DagA mainly existed in the form of inclusion bodies.
Analysis of expression form of protein DagA by ER2566-pET21a-DagA(▽)-DsbC. Lanes: 1, total protein of ER2566-pET21a-DagA(▽)-DsbC; 2, soluble protein of ER2566-pET21a-DagA(▽)-DsbC; 3, insoluble protein of ER2566-pET21a-DagA(▽)-DsbC; M, low-molecular-weight protein marker.

Optimization of expression conditions
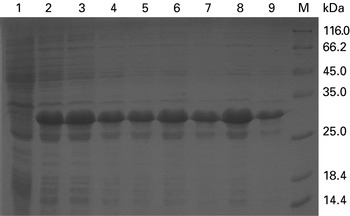
SDS-PAGE analysis indicated that different concentrations of IPTG could induce the expression of protein DagA (Fig. 6), and BandScan 5.0 analysis revealed that DagA expressed the highest amount of protein when the final concentration of IPTG was 2.0 mmol/l.
Analysis of the effect of different IPTG concentrations on protein expression by 15% SDS-PAGE. Lanes: 1–9, products induced by IPTG concentrations of 0, 0.2, 0.4, 0.6, 0.8, 1.0, 1.5, 2.0 and 3.0 mmol/l, respectively; M, low-molecular-weight protein marker.

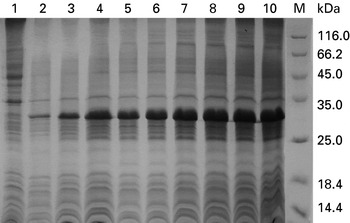
SDS-PAGE and BandScan5.0 analysis revealed that, when using 2.0 mmol/l IPTG for induction, DagA content remained at the same level until the fourth hour, and DagA concentration reached its maximum by the eighth hour of induction (Fig. 7), so 8 h was chosen as the optimal time period for IPTG induction.
Effect of different induction times on protein expression by 15% SDS-PAGE. Lanes: 1–10, products induced in 0, 1, 2, 3, 4, 5, 6, 7, 8 and 9 h, respectively; M, low-molecular-weight protein marker.

Refolding and purification of DagA protein
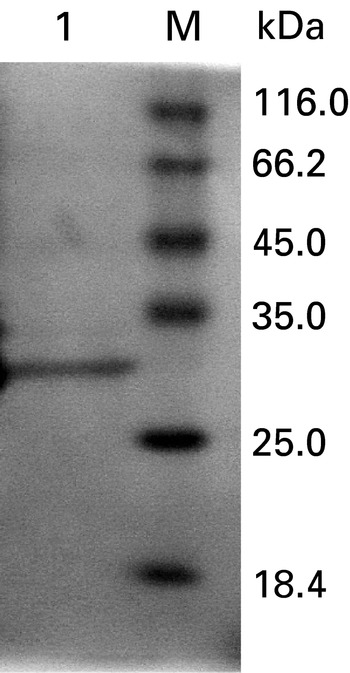
Cell walls from the ER2566-pET21a-DagA(▽S)-DsbC strain were broken by ultrasonication and the renatured DagA proteins harvested by the method mentioned above. The results of SDS-PAGE analysis are shown in Fig. 8. The relative molecular weight of purified DagA protein was 30.8 kDa. No other proteins were observed.
Analysis and purification of DagA protein by 15% SDS-PAGE. Lanes: 1, purified DagA recombinant protein; M, low-molecular-weight protein marker.

Activity analysis for protein DagA
Protein activity identification by agar plate
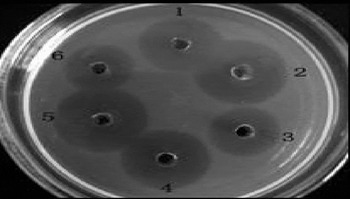
1 μl of β-agarase I (1U, NEB Inc., used as control), 1 μl and 2 μl of DagA protein extract were added separately on an LB agar plate for the identification of enzyme activity. Dissolved circles appeared around the wells in the plates where DagA had been added, indicating that DagA could break down the agarose (Fig. 9).
Activity identification of DagA protein. Apertures: 1 and 4, 1 μl of DagA protein solution; 2 and 5, 2 μl of DagA protein solution; 3 and 6, 1 μl of β-agarase I (NEB).

Enzymology characterization by DNS determination
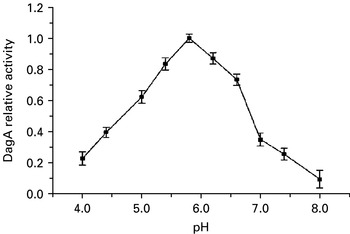
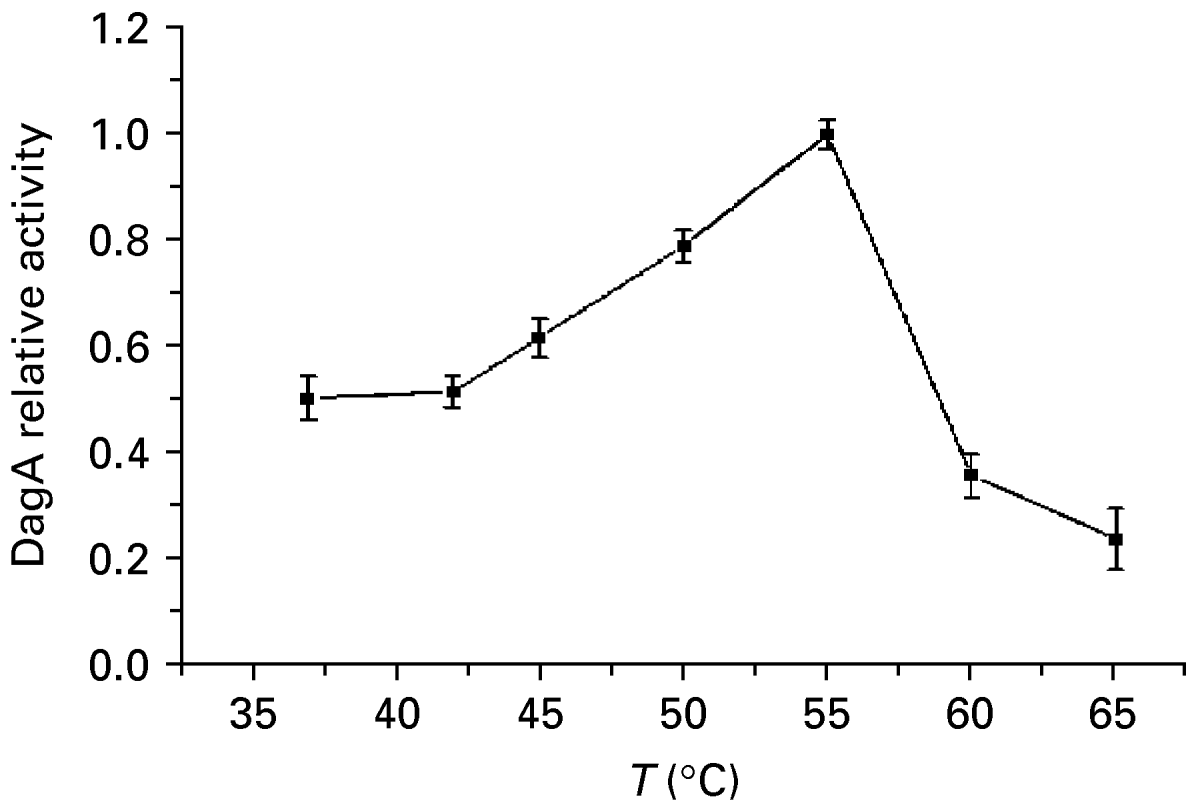
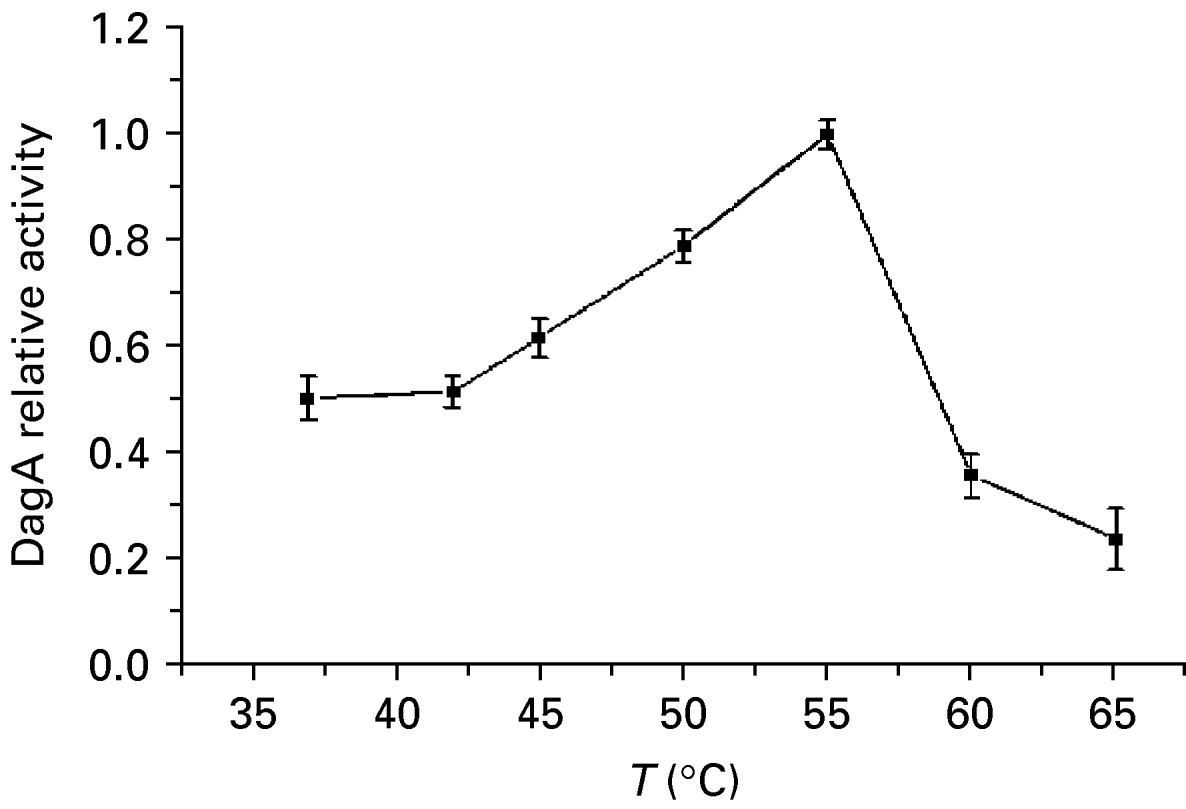
The effects of pH and temperature on the catalytic activity of DagA in the break down of agar into oligosaccharides were assayed at pH values from 4.0 to 8.0 at 55°C and at temperatures from 37°C to 55°C at pH 5.8 (see Fig. 10 and Fig. 11). The optimum pH was found to be ~5.8 and the optimum temperature ~55°C for the catalytic activity of DagA.
Effect of pH value on DagA activity.

Effect of temperature on DagA activity.
Discussion
β-agarase is a hydrolysing enzyme with very limited resources. Production of β-agarase at a large scale by genetic engineering techniques has become a hot subject in the field of bioengineering. In this paper, Escherichia coli was used to express β-agarase I DagA gene of Pseudoalteromonas sp. 19262.
A signal peptide is usually located at the N-side of the secretory protein, which plays a leading role in the secretion of protein outside cells. Generally, exogenous signal sequencing can only control protein secretion at low efficiencies (Zhao et al., Reference Zhao, Zheng and Ma2003). The specificity of a signal peptide is not so strict that it can be modified to expressly secrete heterologous protein (Zheng and Zhan, Reference Zheng and Zhan2005). The effect of a signal peptide on the expression level of β-agarase I DagA gene of Pseudoalteromonas sp. 19262 was investigated in this paper. The results showed that there was no significant effect of the signal peptide on gene expression of recombinant DagA. Zhang and Huang (Reference Zhang and Huang2002) found that the efficiency of gene expression and secretion could be increased by the use of chaperone DsbC and methods of co-expression. Because the chaperone DsbC failed to promote the expression of DagA, it is possible that DsbC proteins exist but are inactive in host cells, rather than molecular chaperones.
This study also established a prokaryotic expression system of DagA in β-agarase I. Experiments showed that expression could be promoted significantly by removing the 63 amino-acid residues of signal peptide sequences and adding the ATG initiation codon at the 5′ side of gene DagA in β-agarase I.
The results also showed that the optimal conditions for IPTG induction were 2.0 mmol/l at 8 h; and the protein β-agarase I DagA still had biological activity after renaturation. The molecular weight of this protein was about 3.0×10⁴ Da. It maintained activity between pH values 4.0 to 8.0 and between temperatures of 37°C and 60°C, and would be optimum in conditions of pH 5.8 and temperature 55°C. The optimal temperature is higher than for AgaC (an optimum temperature of ~35°C) of Vibrio sp. V134 β-agarase as expressed by Dong et al. (Reference Dong, Hashikawa, Konishi, Tamaru and Araki2006).
These results might be useful for other enzymology studies on agarase, and this study would also provide a basis for further research on β-agarase I DagA.
Acknowledgement
This work was supported by the Foundation of the Innovation Team of Northwest A&F University.