I. INTRODUCTION
Deformation twinning plays an important role in plastic deformation of hexagonal close-packed (hcp) metals because of their limited slip systems. Reference Barnett1–Reference Yoo3 For pure Mg and Mg alloys that have relatively low stacking fault energies, deformation at low temperatures and/or at high strain rates leads to easier-twinning nucleation as dislocation activity is suppressed. Reference Jiang, Jonas, Mishra, Luo, Sachdev and Godet4–Reference Somekawa, Hirai, Watanabe, Takigawa and Higashi6 Although several types of twins have been found in Mg alloys, {10-12} twinning is considered to be more frequently activated. Reference Barnett, Keshavarz, Beer and Atwell7–Reference Jiang, Jonas, Luo, Sachdev and Godet9 From previous investigations on pure Mg and Mg alloys, Reference Barnett1–Reference Christian and Mahajan5,Reference Barnett, Keshavarz, Beer and Atwell7–Reference Jiang, Jonas, Luo, Sachdev and Godet11 the {10-12} twins, including six equivalent variants, have been conventionally discussed as a group (i.e., extension twins). However, the characteristic of each {10-12} variant and the effect of different variants on plastic strain are still not very clear because the type of twin variants and twin morphologies are different with increasing levels of strain. Reference Jiang, Jonas, Mishra, Luo, Sachdev and Godet4,Reference Godet, Jiang, Luo and Jonas10 To facilitate twinning, dynamic plastic deformation (DPD) was used to deform samples to various levels of strain in this study. The {10-12} twinning variants activated were investigated by calculating their Schmid factors (SFs), and their contributions to deformation were discussed by analyzing the deformation mechanisms.
II. EXPERIMENTAL METHOD
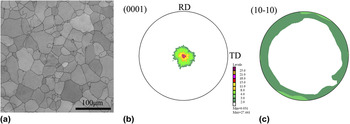
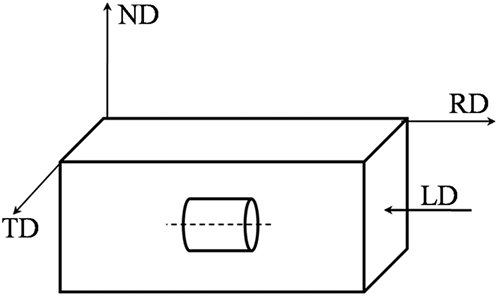
The material investigated was a commercially hot-rolled AZ31 Mg alloy plate (Mg–3%Al–1%Zn), which were annealed at 420 °C for 3 h and then furnace cooled, leading to a strong basal texture and a twin-free equiaxed grain structure with an average grain size of 34 μm as evaluated by the linear intercept method, as shown in Fig. 1(a). Cylinders (8 mm in diameter and 12 mm tall) were cut from this plate along the rolling direction (RD), i.e., the loading direction (LD) is parallel to the RD (Fig. 2). Samples were subjected to DPD just once with Instron Dynatup 8120 testing machine (Instron Corporation, Norwood, MA) at room temperature, and the strain rate is about 103/s. The deformation strain is calculated as ε = ln(L 0/L d), where L 0 and L d are the initial and final heights of the samples, respectively. The initial macrotexture was measured by x-ray diffraction on a Rigaku D/max-2500 PC diffractometer (Rigaku Corporation, Tokyo, Japan). Scanning electron microscopy-electron backscattered diffraction (SEM-EBSD) was utilized to analyze twinning orientations and sample textures after deformation. Twin variants were identified using the twinning rotation method based on orientation data from EBSD, as mentioned in Ref. Reference Jiang, Godfrey, Liu and Liu12. EBSD scans were performed by FEI Nova 400 FEG-SEM (FEI Company, Hillsboro, OR) on an area of 300 × 300 with a step size of 1 μm for each sample.
(a) Microstructural characteristics of the as-rolled material; (b) (0001) and (c) (10-10) pole figures of the as-rolled material. RD, TD, and ND represent the rolling direction, the transverse direction, and the normal direction, respectively.

Schematic illustration of the sample orientations used for DPD testing. LD represents the loading direction.

III. EXPERIMENTAL RESULTS AND DISCUSSION
A. Microstructure and texture evolution during deformation
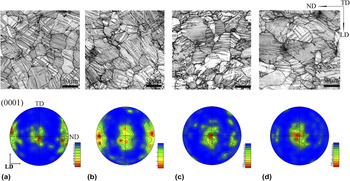
The initial texture of the material was a typical basal texture of rolled Mg alloys in which the c-axis of the hcp lattice was aligned almost parallel to the normal direction (ND) in most grains [Fig. 1(b)]. Figure 3 presents the optical micrographs of DPD samples observed in the longitudinal section (i.e., RD–ND plane) with different strain levels and texture evolution. {10-12} twinning can be activated by compression perpendicular to the c-axis of the hcp lattice or tension parallel to the c-axis. As a result, a lot of {10-12} twins were generated in the samples after deformation. For compression perpendicular to the c-axis in the hcp crystal structure, the c-axis of the twinned region is oriented toward the LD. The difference of twin textures with different strains (Fig. 3) can be interpreted based on the different volume fractions of twins. For strain ε > ∼8%, the as-rolled texture with the c-axis aligned parallel to the ND was transferred to the twin texture with the c-axis aligned parallel to the RD [Fig. 3(d)].
EBSD maps and (0001) pole figures of AZ31 samples with different strains: (a) ε = 2.1%, (b) ε = 4.3%, (c) ε = 6.5%, (d) ε = 8.3%. LD represents the loading direction.

B. SF analysis on {10–12} twinning system
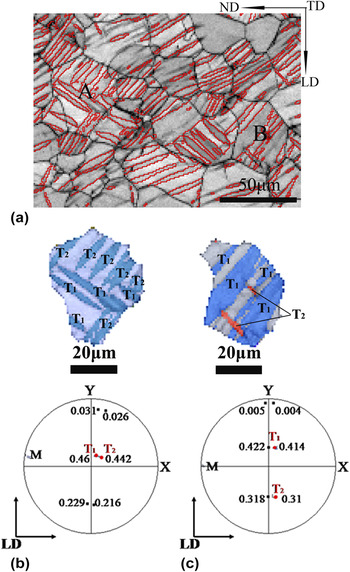
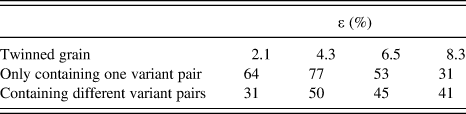
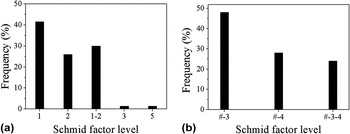
The activated {10-12} twins were analyzed by calculating their SFs. To ensure statistical validity, 95, 127, 98, and 72 twinned grains were investigated in four samples, corresponding to different strain levels of 2.1%, 4.3%, 6.5%, and 8.3%, respectively. Due to twinning saturation at higher strain levels, the orientation of the grain matrix could not be determined, and thus, the misorientation method was not applicable to variant recognition. In most grains, both potential {10-12} variants from one variant pair had similar SF values (a statistical gap of nearly 0.03), whereas relatively large differences existed among twinning pairs. An analysis of representative grains A and B is shown in Fig. 4(a), whereas SFs and orientations of their potential {10-12} variants are illustrated in Figs. 4(b) and 4(c), respectively. This statistical result can also be reflected from the experimental data. As listed in Table I, many grains only generated one variant pair [Fig. 4(b)]. This result was also obtained by quasi-static compression (QSC), in which the LD was perpendicular to the c-axis of the crystal lattice. Reference Park, Hong and Lee13 It indicates that the high strain rates have little effect on the number of activations of twin variants. By analyzing grains containing only one {10-12} variant pair, it was found that the activated twin variant belonged to the twin variant pair of maximum SF, irrespective of strain. A typical result is shown in Fig. 5(a), corresponding to a sample with a strain of 4.3% (here 1 to 5 represents SF level of {10-12} variants activated, “1” is the highest and “5” is the lowest in a particular grain). Both variants from the same variant pair were found for some grains, presumably due to their similar SF values. A few twins appear for which the SF value is quite low, just as variants of “3” and “5” in Fig. 5(a). A possible explanation for this phenomenon lies in the polycrystal environment of the grains that determine local stress state. The internal or reaction stresses, when superimposed on the applied stress, can reduce the effective or net local stress to near zero and thus prevent the activation of twins. Similarly, they may act to promote the activation of low “SF” twins. Reference Clausen, Tome, Brown and Agnew14
(a) The microstructure of DPD sample with ε = 4.3%. Red lines indicate {10-12} twin boundaries. Sketch maps (b) and (c) show grain A and B in (a) and their crystallographic orientations and SFs potential {10-12} variants, respectively. Here, M represents grain matrixes. T1 and T2, marked by red color, represent activated {10-12} twin variants.

The statistical numbers of grains generating {10-12} twins.

SF distribution of different {10-12} twin variants for the DPD samples with ε = 4.3%: (a) grains only containing one variant pairs; (b) grains containing two variant pairs. 1 to 5 represents SF level of activated {10-12} variants, “1” is the highest and “5” is the lowest in a particular grain. # represents “the first-kind variants.”

As given in Table I, different {10-12} variant pairs were also generated in some grains. Figure 5(b) shows SF distribution of different {10-12} variant pairs for the DPD samples with ε = 4.3%. By analyzing these two twin variant pairs activated, it was found that their mean SF levels are the highest and second highest, respectively. For example in Fig. 4(a), SFs and orientations of the potential {10-12} variants of grain B are illustrated in Fig. 4(c). For convenience, variants from twin variant pairs with the maximum SF were classified as “the first kind,” and other variants were classified as “the second kind.” It should be noted that the first nucleated variant is from the first kind [as shown in Fig. 5(a)]. The following {10-12} variant activated seems unpredictable with increasing strain, it may come from either the first kind (due to the similar SF values) or the second kind. Knezevic et al. Reference Knezevic, Levinson, Harries, Mishra, Doherty and Kalidindi15 have shown that once a grain twins, the local stress state changes drastically even in a single crystal, rendering the SF criteria based on global stress state unsuitable for analyzing multiple twin variant selection data.
C. Strain accommodation of different {10-12} variants
A relatively large difference is observed among {10-12} twin variants from different variant pairs, with respect to the size and number of twins, [e.g., grain B showed in Fig. 4(c)], which is a universal phenomenon based on statistical results. The SF values of 167 grains containing different variant pairs were calculated and analyzed together with grain data from EBSD, it was found that in most of the grains, the variants of the first kind were larger in size and number than those of the second kind. The first nucleation and development of variants from the first kind led to a decrease in the grain matrix. Reference Salem, Kalidindi, Doherty and Semiatin16 On the other hand, in grains with two kinds of twin variants, two possible twin–twin boundaries of misorientation 60°〈10-10〉 and 60.4°〈8-1-70〉, which were produced from interaction of different variants, can restrict the twin growth. Reference Hong, Park and Lee17 Both conditions would influence the number and size of subsequent twin variants having small SF values.
This obvious difference in the size and number of the variant raised an interesting question about the effect of each {10-12} variant on deformation. The strain accommodated by twinning can be calculated as follows Reference Hong, Park and Lee18 :
 $${{\rm{\varepsilon }}_{{\rm{twin}}}} = {f_{{\rm{twin}}}} \cdot \bar m \cdot {{\rm{\gamma }}_{{\rm{twin}}}}\quad ,$$
where εtwin, f
twin,
 $\bar m$
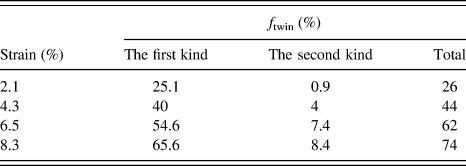
, and γtwin represent the twinning strain, the twin volume fraction, the average SF of twin variants, and the characteristic twinning shear, respectively. Different {10-12} twin variants were identified using the misorientation method, and their twin volume fractions were obtained by EBSD analysis with an HKL channel 5 system. The f
twin values were listed in Table II. Dudamell et al. studied an as-rolled AZ31 specimen (size of 3 × 3 × 4.5 mm) that was impacted with a Hopkinson bar at a high strain rate in compression along RD up to a strain of 0.05. They reported that the fraction of the twinned material was up to 81%,
Reference Dudamell, Ulacia, Gálvez, Yi, Bohlen, Letzig, Hurtado and Pérez-Prado19
which is different from that determined from our data. This difference may be due to the effect of different sample sizes. The parameter
 $\bar m$
is computed to be 0.437
Reference Hong, Park and Lee18
; γtwin is 0.130.
Reference Meyers, Vohringer and Lubarda20
εtotal, εtwin, ε1, ε2 are the total strain, the twinning strain, strain induced by the first-kind variants, and strain induced by the second-kind variants, respectively. So:
 $${{\rm{\varepsilon }}_{{\rm{twin}}}} = {{\rm{\varepsilon }}_{\rm{1}}} + {{\rm{\varepsilon }}_{\rm{2}}}\quad ,$$
and
 $${{\rm{\varepsilon }}_{{\rm{twin}}}}{\rm{/}}{{\rm{\varepsilon }}_{{\rm{total}}}} = {{\rm{\varepsilon }}_{\rm{1}}}{\rm{/}}{{\rm{\varepsilon }}_{{\rm{total}}}} + {{\rm{\varepsilon }}_{\rm{2}}}{\rm{/}}{{\rm{\varepsilon }}_{{\rm{total}}}}\quad .$$
The twinning volume fractions of different {10-12} twin variants.

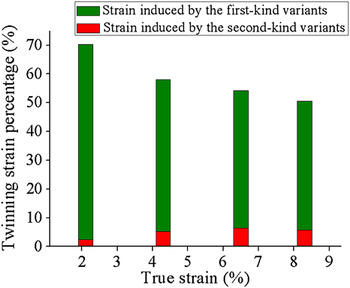
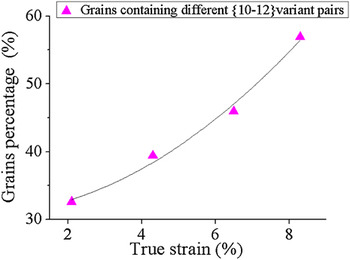
The strain percentages of εtwin/εtotal, ε1/εtotal, and ε2/εtotal are shown in Fig. 6. As illustrated in Fig. 6, twinning dominated plastic deformation at a high strain rate. However, due to a limited fraction of grain matrix, additional strain cannot be accommodated by twin growth. In such cases, pyramidal slip, together with basal slip, dominated deformation in the twinned grains. Reference Barnett, Keshavarz, Beer and Atwell7,Reference Capolungo, Marshall, McCabe, Beyerlein and Tomé21 The slip distance was also shortened because twin boundaries acted as effective barriers to slip. For twinning deformation, the first-kind variants accommodated about 90% of the twinning strain (Fig. 6). Obvious advantages, both the nucleation number (Fig. 5) and the twinning volume fraction (Table II), indicated that nucleation and growth mechanism of the first-kind variants played an important role in the accommodation of the strain. Figure 7 shows the number of grains containing different {10-12} variant pairs increased with plastic strain, indicating an increasing tendency of the second-kind variants at higher strains. But judging by the low twinning volume fraction at different strains (Table II), variants of the second kind accommodated strain mainly by twin nucleation, so it made a little contribution to the accommodation of the strain (Fig. 6).
Strains induced by different {10-12} variant pairs under different strains.

The number percentage of grains generating different {10-12} variants.

D. Orientation dependence of different {10-12} variants’ nucleation
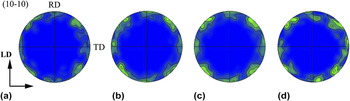
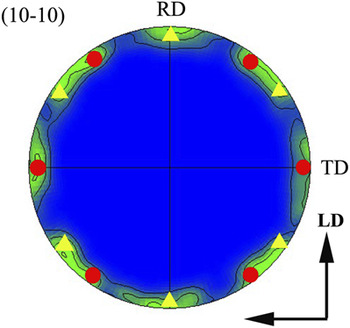
The critical resolved shear stress (CRSS) for {10-12} twinning is strain rate independent. Reference Ulacia, Dudamell, Gálvez, Yi, Pérez-Prado and Hurtado22 Therefore, variants can be activated when the resolved shear stress (RSS) reach their CRSS in spite of the low SFs. In other words, grain orientation plays an important role in twin nucleation by influencing RSS. In this study, no preferred orientation was observed for the prismatic plane {10-10} in this as-rolled plate shown in Fig. 1(c). The (10-10) pole figures shown in Fig. 8 revealed certain regularity of orientations of grains generating different {10-12} variants. To further confirm this regularity, the {10-10} planes of 81 grains having near-perfect initial orientations were analyzed and shown in Fig. 9. This indicated that at high strain rates that different {10-12} variants could be easily generated in grains when the values of angles between one a-axis of the crystal lattice and the compression direction is about 0 or 30°, as shown in Fig. 9. The red circle and the yellow triangle represent the orientation of one a-axis deviated about 0 or 30° from RD toward TD, respectively.
(10-10) pole figures of matrix of grains generating different variant pairs orientations under different strains: (a) ε = 2.1%, (b) ε = 4.3%, (c) ε = 6.5%, (d) ε = 8.3%.

The (10-10) pole figure of 81 grains generating different variant pairs. The red circle and the yellow triangle represent the orientation of one a-axis deviated about 0 or 30° from RD toward TD, respectively.

IV. CONCLUSIONS
When as-rolled AZ31 alloy was deformed by DPD along RD at room temperature, different {10-12} variants were generated relative to their SFs, when initial grains have defined orientations with one a-axis of the crystal lattice at roughly 0 or 30° from the compression direction. The volume fraction of twins strongly influences the strain accommodated by twinning. The {10-12} variant pair with the maximum SF accommodated about 90% of the twinning strain. Its high volume fraction indicated that both nucleation and growth mechanisms played important roles in the strain accommodation. Variants from the second kind had a low volume fraction of twins and accommodated strain mainly by twin nucleation and made a lesser contribution to the total deformation.
ACKNOWLEDGMENTS
This work was supported by National Natural Science Foundation of China (Grant Nos. 51071183, 50890170, and 51271208) and the Fundamental Research Funds for the Central Universities (Grant No. CDJXS11132225).