Introduction
The structure of sensory neurons and the pattern of their connections can be profoundly modified by disruption of sensory input. Visual deprivation early in postnatal life perturbs the normal development of neural connections in the visual system, and it alters the perceptual functions that these connections support. This is perhaps best exemplified by the conspicuous abnormalities in neuron structure and function brought about by the occlusion of one eye. Monocular deprivation in early development produces a shift in cortical ocularity in favor of the open eye (Wiesel & Hubel, Reference Wiesel and Hubel1963a), and neurons in deprived layers of the dorsal lateral geniculate nucleus (dLGN) become smaller than those in nondeprived counterpart layers (Wiesel & Hubel, Reference Wiesel and Hubel1963b). Response of cortical neurons to stimulation of the deprived eye is considerably reduced after 24 h of monocular deprivation (Mioche & Singer, Reference Mioche and Singer1989), and this functional disconnection appears to be mediated by cellular events linked to long-term synaptic depression (Heynen et al., Reference Heynen, Yoon, Liu, Chung, Huganir and Bear2003; Crozier et al., Reference Crozier, Wang, Liu and Bear2007). After about 4 days of monocular deprivation, a difference emerges between the gross structure of deprived and nondeprived neurons of the dLGN so that deprived neurons are left with comparatively smaller somata (Wiesel & Hubel, Reference Wiesel and Hubel1963b; Guillery & Stelzner, Reference Guillery and Stelzner1970), atrophied axon terminal fields (Antonini & Stryker, Reference Antonini and Stryker1993), and thin and tortuous dendritic branching (Friedlander et al., Reference Friedlander, Stanford and Sherman1982). The molecular events mediating the modification of gross neuronal structure are at best poorly understood. The aim of the current study was to examine the relationship, in time and space, between deprivation-induced modification of the neuronal cytoskeleton and alteration of neuron gross structure.
Neuron structure is provided by an intracellular scaffold comprising three classes of cytoskeletal filaments: actin filaments, intermediate filaments, and microtubules. Neurofilaments are a type of intermediate filament believed to be a major contributor to neuron structure and function (Morris & Lasek, Reference Morris and Lasek1982; Hoffman et al., Reference Hoffman, Cleveland, Griffin, Landes, Cowan and Price1987). Three protein subunits different in their apparent molecular mass [heavy (H), medium (M), and light (L)] assemble to form a neurofilament triplet protein (Hoffman & Lasek, Reference Hoffman and Lasek1975). Visual deprivation is known to have a marked effect on cytoskeletal proteins in the dLGN and in the primary visual cortex. Monkeys deprived of vision by monocular injection of tetrodotoxin have reduced labeling for microtubule-associated protein 2 in neurons of visual cortex serving the silenced eye (Henry & Bhandari, Reference Henry and Bhandari1992). Monocular deprivation by lid closure produces a marked reduction of labeling for the H neurofilament subunit in primary visual cortex of monkeys (Duffy & Livingstone, Reference Duffy and Livingstone2005) and humans (Duffy et al., Reference Duffy, Murphy, Frosch and Livingstone2007) and also within deprived layers of cat dLGN (Bickford et al., Reference Bickford, Guido and Godwin1998; Kutcher & Duffy, Reference Kutcher and Duffy2007). The timing and location of reduced neurofilament H in deprived dLGN layers are linked to accompanying neuronal structural changes (Kutcher & Duffy, Reference Kutcher and Duffy2007), thereby raising the possibility that neurofilament modification plays a mediating role in the alteration of neuron structure in the context of visual deprivation. The aim of this study was to determine if the effect of deprivation is exclusive to the H neurofilament subunit or if changes extend to include all three subunits. Reduced labeling for neurofilament H in the context of monocular deprivation has previously been linked to changes in Y cells (Bickford et al., Reference Bickford, Guido and Godwin1998), but this does not preclude cytoskeletal effects beyond the Y-cell class. A reduction of all three neurofilament subunits would indicate a major cellular modification across a broad range of cell sizes and cell types. Results from the current study reveal that monocular deprivation produces a loss of labeling for all three neurofilament subunits, that progression of labeling reduction is indistinguishable between subunits, that reduced labeling for all subunits correlates spatially and temporally with cytostructural modification, and that unilateral deprivation initiated beyond early life does not provoke a reduction in neurofilament labeling.
Materials and methods
Animals and rearing
Measurements were obtained from 3 normal and 10 monocularly deprived cats. All but two deprived animals had their deprivation started at postnatal day 34, about the peak of the critical period for ocular dominance plasticity (Olson & Freeman, Reference Olson and Freeman1980), and the deprivation state was maintained for a period that ranged from 1 day to 2 months. Monocular deprivation in the remaining two animals was begun outside the critical period: one deprived at 1 year of age and the other at 15 years of age. Tissue from three normal animals was also examined: two at postnatal day 34 and one at 4 years. Sections of lateral geniculate nuclei from all animals were reacted to determine the effect of monocular deprivation on the presence of H, M, and L neurofilament subunits. A subset of sections from each animal was stained for Nissl substance to enable an assessment of gross structural change consequent to deprivation.
Monocular deprivation was performed under gas anesthesia (2–3% isoflurane administered in oxygen) following procedures that were approved by the Dalhousie University Committee on Animal Care and that have been reported previously (Murphy & Mitchell, Reference Murphy and Mitchell1987). The upper and lower palpebral conjunctivae from the left eye were sutured with 4-0 Ethicon vicryl. Conjunctivae were separated from the overlying lid, and the resulting wound margins were opposed and sutured together with 4-0 silk to permit fusion of the closed lids. Animals deprived for longer than 7 days had their silk sutures removed under gas anesthesia. Animals were given postoperative analgesics and antibiotics as required.
Histology
Animals were killed with a lethal dose of Euthanyl, and brains were immediately harvested from the skull. Brains were not perfuse-fixed because of a parallel study that required unfixed samples. The cerebrum was resected to expose the underlying thalamus, and tissue was placed in a freezer (−80°C) until sectioning. Coronal sections 12 μm thick were cut using a Microm HM560 cryostat (Thermo Scientific, Waltham, MA), thaw-mounted onto Fisherbrand superfrost plus glass slides (Fisher Scientific, Pittsburgh, PA), and then stored at −20°C until processing. A subset of dLGN sections was stained with cresyl violet to demonstrate Nissl substance and to provide a means of revealing and measuring somatal profiles. Sections for Nissl staining were dehydrated in ethanol, placed in stain for 5 min, differentiated in ethanol, cleared in Histo-Clear (National Diagnostics, Atlanta, GA), and were then coverslipped using Entellan (EMD Chemicals, Gibbstown, NJ).
Sections reacted for neurofilament protein were bathed first in 0.1 M phosphate-buffered saline (PBS) containing 4% paraformaldehyde for 15 min and then in PBS with 0.002% hydrogen peroxide for 15 min to reduce nonspecific reaction product. Background labeling was further reduced by exposing sections to 0.004% normal goat serum in PBS for 30 min. Neurofilament protein was labeled by exposure of sections to a mouse monoclonal antibody targeted against the L (MAB1615; Millipore, Billerica, MA), M (05-744; Millipore, Billerica, MA), or H (SMI-32; Covance Research Products, Princeton, NJ) subunit. We verified the specificity of each antibody with immunoblots of cat primary visual cortex, which consistently produced single dark bands corresponding to the appropriate molecular mass for the L (~65 kDa) and M (~155 kDa) neurofilament subunits. Our immunoblots for the H subunit (SMI-32) reliably produced a single band at an apparent molecular mass of approximately 130 kDa, consistent with findings indicating that nonphosphorylated H neurofilament protein, which SMI-32 targets, runs considerably lighter than its phosphorylated form (Julien & Mushynski, Reference Julien and Mushynski1982; Kaufmann et al., Reference Kaufmann, Geisler and Weber1984; Georges & Mushynski, Reference Georges and Mushynski1987). The specificity of SMI-32 was further supported by its labeling characteristics, which were congruent with other reports from cat dLGN (Bickford et al., Reference Bickford, Guido and Godwin1998; Van der Gucht et al., Reference Van der Gucht, Vandesande and Arckens2001). Sections destined for neurofilament labeling were exposed to one of the three neurofilament antibodies (1:1000 concentration in PBS) for 2 h. After three washes in PBS, sections were covered for 1 h with biotinylated goat anti-mouse (Jackson ImmunoResearch, West Grove, PA), diluted in PBS (1:500), and then washed again and bathed for 1 h in a PBS solution containing avidin and peroxidase-conjugated biotin (Vector Labs, Burlingame, CA). Labeling was made visible by turnover of the chromogen substrate, 3,3′-diaminobenzidine tetrahydrochloride in PBS. For each animal, the reaction time of this final step was kept constant between left and right dLGN sections labeled for the same neurofilament subunit. All sections reacted for neurofilament protein were dehydrated in ethanol, cleared in Histo-Clear (National Diagnostics), and then coverslipped using Entellan (EMD Chemicals).
Quantification
The cross-sectional area of neuron somatal profiles revealed by Nissl staining was measured from layer A1 and from the binocular portion of layer A (Fig. 1A) in two sections of left and right dLGN from each animal. Neurons were distinguished from glial cells by their staining pattern: dark cytoplasm, light nucleus, and dark nucleolus (Fig. 1B). Only neurons with obvious nucleolar staining were measured to ensure that our analysis was exclusive to neurons cut through the somatal midline, the soma’s presumed maximum diameter. The outermost perimeter of each neuron profile was traced at 400× magnification using a computer application (Image-Pro Plus; Media Cybernetics, Bethesda, MD) that calculated the area of each tracing. Area measurements were taken from two sections, separated by at least 24 μm, from both the left and the right dLGN of each animal. This enabled about 30 neurons to be measured from each dLGN layer or about 240 measurements per animal. All measurements were taken from Sanderson’s (Reference Sanderson1971) coronal plane 6-7, which is positioned about midway along the anterior–posterior axis of the nucleus. A deprivation index was calculated for each animal by subtracting the sum of the nondeprived averages from the sum of the deprived averages and then dividing the result by the sum of the nondeprived averages and multiplying by 100 so that the final value came to represent the percentage different from the nondeprived average:

Cell measurements were taken from dLGN sections stained for Nissl substance or labeled for one of the three neurofilament subunits. The boxed area on the Nissl section (A) and on the section labeled for neurofilament M (C) identifies the location of our sampling, which was exclusive to layer A1 and to the binocular portion of layer A. Cross-sectional areas of deprived and nondeprived neuron profiles were measured from Nissl sections and included only cells with staining characteristics consistent with neurons [arrows in (B) point to examples from layer A1]. Density of neurofilament-positive cells in deprived and nondeprived layers was calculated for each neurofilament subunit using the optical dissector probe to count neurons [arrows in (D) point to examples from layer A1]. The border between layer A and layer A1 (asterisks in A and C) was distinguished by lighter interlayer labeling/staining. Scale bars = 1 mm (A and C) and 100 μm (B and D).

The effect of deprivation on neurofilament reactivity was measured by counting immunopositive neurons using a computer-assisted stereology program, CAST (Olympus, Markham, Canada). Counts were made from the binocular region of layer A and from layer A1 (Fig. 1C), and only neurons with a dark cytoplasm and light nucleus (Fig. 1D) were counted so that we were consistent in counting neurons cut through the somatal midline and also so that neuron caps would be excluded from our analysis. Sampled sections were taken from between Sanderson’s (Reference Sanderson1971) coronal planes 6-7. Counts were performed using the optical dissector probe at 600× magnification with the guard depth set at 3 μ and a counting frame that sampled 25% of each layer from the right and left dLGN. Immunopositive cell counts were made for each animal, from three sections of each hemisphere separated by at least 24 μm, and for all three neurofilament subunits. Density estimates were calculated by dividing total cell counts for each layer by the sampled area. These estimates were then used in the deprivation index formula to determine the effect of deprivation on neurofilament-positive cell counts. In normal animals, layer A from the right LGN and layer A1 from the left LGN were designated as “deprived.”
Images of the dLGN were taken with a high-resolution digital camera (DP70; Olympus, Markham, Canada), and figures were composed in Photoshop 8.0 (Adobe, San Jose, CA) by converting color images to gray scale and then adjusting contrast uniformly with the “levels” tool.
Results
Labeling for each neurofilament subunit was obvious in somata and proximal dendrites of neurons from layer A and layer A1 of the dLGN. These layers were distinguished by slightly weaker labeling within the narrow interlayer region separating them. Reaction product from neurofilament L and M antibodies produced a larger number of labeled somata than the antibody against neurofilament H (Fig. 2A–2C). In the two normal kittens examined, average density of neurofilament H-labeled cells was lower than the density for M and L subunits for both layer A and layer A1 (Fig. 2D). The discrepancy in density of labeled cells was most obvious between the H (average = 114 neurons/mm2; SD = 35 neurons/mm2) and the L (average = 556 neurons/mm2; SD = 58 neurons/mm2) subunits, where L labeling produced more than 4 times the number of labeled cells overall. This difference between subunit labeling was clear in all animals except the three adults, which had fewer immunopositive cells than younger animals. The overall lower number of immunolabeled cells in adults may partly be explained by reduced packing of neurons consequent to growth of the nucleus and the cells within it. That the H neurofilament antibody produced the lowest number of reactive cells is consistent with it being found predominantly within a single type of dLGN neuron—Y cells (Bickford et al., Reference Bickford, Guido and Godwin1998). This would seem to suggest either that L and M neurofilament labeling extends to neurons beyond the Y-cell class or that the H antibody (SMI-32) does not target all Y cells.
Sections of the right dLGN labeled for neurofilaments H (A), M (B), and L (C) taken from a normal animal at postnatal day 34. Though the density of immunopositive cells was comparable between A and A1 layers for each neurofilament subunit, comparisons between subunits in two animals revealed lower densities for neurofilament H when compared to measurements for neurofilaments M and L (D). Scale bar = 1 mm.

Monocular deprivation initiated at the peak of the critical period reduced labeling for all three neurofilament subunits within deprived layers following 4 days of deprivation (Fig. 3). The reduction of each subunit progressed as the duration of deprivation increased, and all subunits reached about maximal loss by 8 days of deprivation (Fig. 4), at which time, deprived layers exhibited a marked reduction in the number of immunopositive cells. Neurofilament loss spanned the full extent of deprived layers including the most lateral portion of layer A, the monocular segment, which serves to process information from the temporal visual crescent. A noteworthy observation is that deprived dLGN layers from all animals, even those deprived the longest, contained a smattering of intensely immunopositive cells that were often indistinguishable in size and labeling intensity from cells in nondeprived layers. It is unclear what enables the apparent resistance of some deprived cells to neurofilament loss, but similar reports of sparing of dLGN cells have been made after cortical ablation (Lomber et al., Reference Lomber, Payne, Cornwell and Pearson1993) and after monocular lid closure (Wiesel & Hubel, Reference Wiesel and Hubel1963b; Friedlander et al., Reference Friedlander, Stanford and Sherman1982).
Sections of the left and right dLGN after 4 days of monocular deprivation labeled for neurofilaments H (A), M (B), and L (C). Layers receiving input from the deprived eye are indicated. Reduced labeling for all three neurofilament subunits was observed in deprived layers following 4 days of monocular occlusion. High-magnification micrographs of H (D), M (E), and L (F) labeling from regions in the right dLGN (asterisks) show a reduction of immunopositive somata in deprived layers. Arrowheads in (D–F) indicate the boundary between layers serving the deprived eye (region above arrowhead) and nondeprived eye (region below arrowhead). Scale bars = 1 mm (A–C) and 200 μm (D–F).

Sections of the right and left dLGN following 8 days of monocular occlusion that were labeled for H (A), M (B), and L (C) neurofilament subunits. Deprived layers are indicated by arrows, by labeling pallor and also by a large decrease in immunopositive cells relative to nondeprived layers. High-magnification images of deprived and nondeprived layers from a portion of the right dLGN (asterisks) labeled for H (D), M (E), and L (F) subunits. In each micrograph, the border separating deprived and nondeprived layers is indicated by an arrowhead. Scale bars = 1 mm (A–C) and 200 μm (D–F).

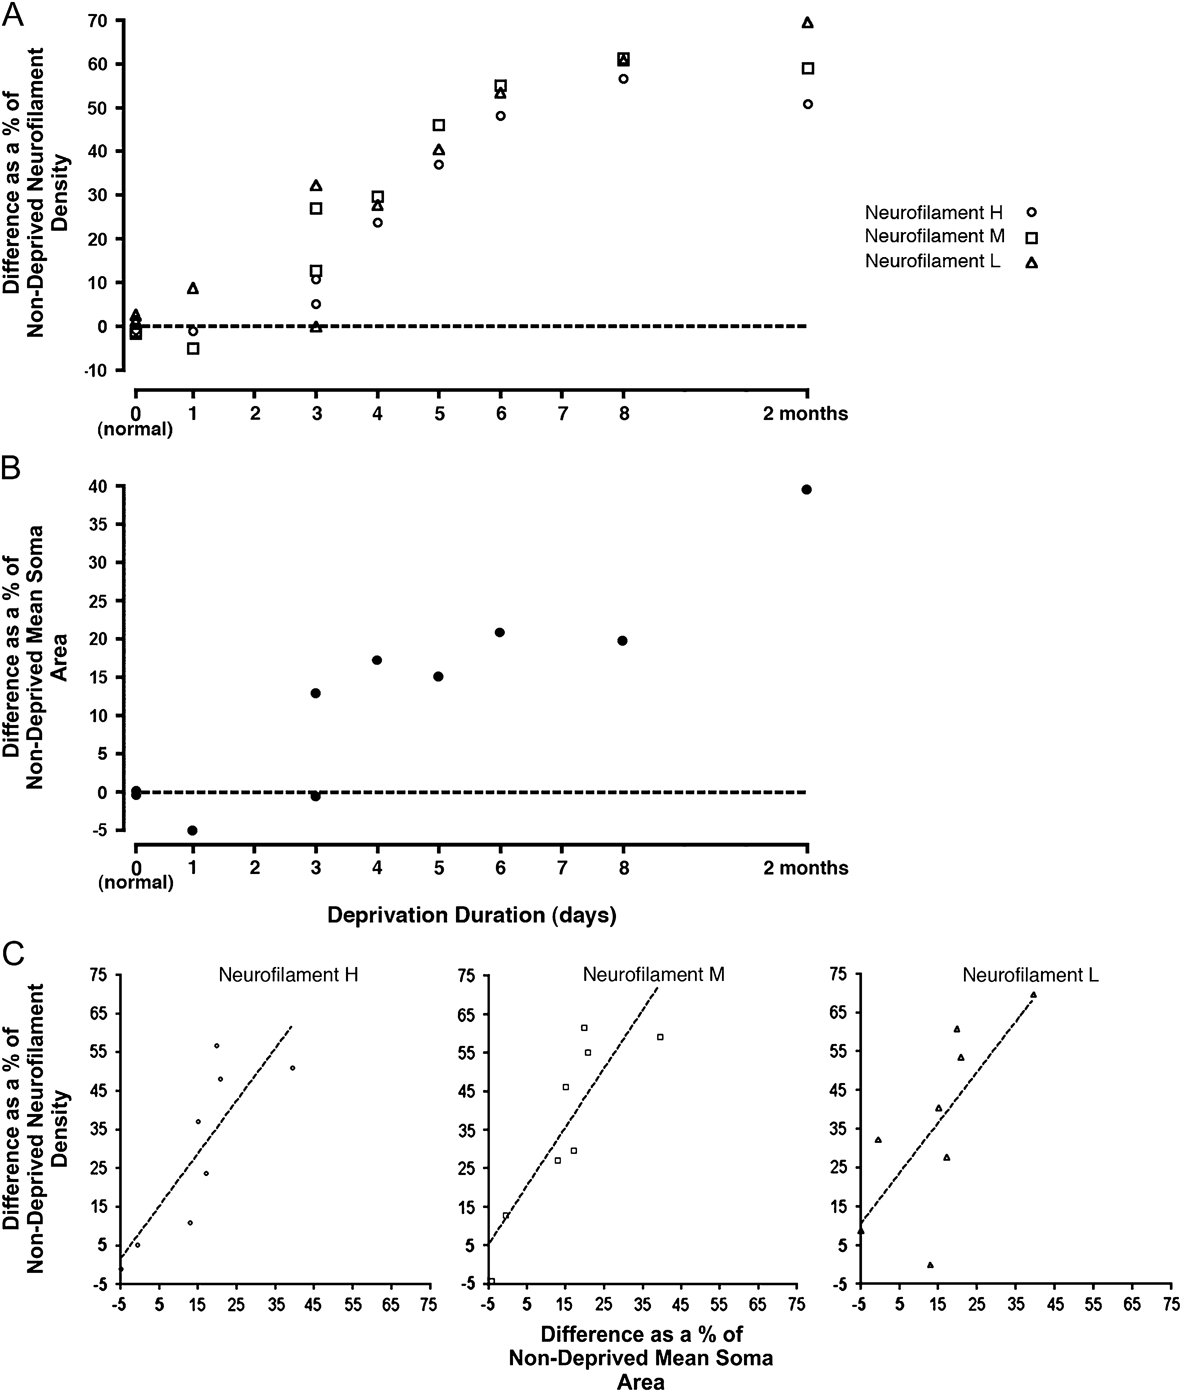
The loss of neurofilament labeling was quantified by counting immunopositive cells in deprived and nondeprived layers and then calculating the percentage difference between the layers, which produced a value that reflected the degree of disparity between layers in that animal (Fig. 5A). A difference in neurofilament labeling between deprived and nondeprived layers was first observed in one of the two animals deprived for 3 days, which showed a loss of L (32%) and M (27%) subunits but not H (5%). By 4 days of deprivation, there was between a 20–30% loss of reactive cell density for all neurofilament subunits in deprived layers. The loss of labeled cell density in deprived layers increased for all subunits roughly linearly up to 8 days of deprivation, at which point, the loss just about equaled that found after deprivation for 2 months. From 3 to 8 days of deprivation, there was about a 10% reduction in the number of cells exhibiting immunolabeling in deprived layers for each day of deprivation. The onset and progression of immunoreactivity reduction were comparable between neurofilament subunits. Modification of cell structure, measured by a difference between deprived and nondeprived somatal size, followed a profile similar to that for neurofilament loss (Fig. 5B). One of the two animals monocularly occluded for 3 days showed a mild deprivation effect, with deprived neurons measured to be 13% smaller than nondeprived cells; it is worth pointing out that this is the same animal that after 3 days of deprivation showed a change in neurofilament labeling. Deprived cells were consistently smaller than nondeprived cells in all animals deprived for longer than 3 days, and the effect was larger with increased deprivation duration. The degree of somatal modification after 8 days of deprivation was about 50% of the total found following 2 months of deprivation. The degree of structural change was correlated with the extent of labeling loss for each neurofilament subunit (Fig. 5C), indicating that neurofilament loss can predict the magnitude of gross structural change. That the difference between deprived and nondeprived somata continued to increase beyond 8 days of deprivation despite saturation of the neurofilament loss seems to indicate that structural modification beyond 8 days can occur without further loss of neurofilament labeling. It is also possible that the growing difference between deprived and nondeprived somatal size beyond 8 days of deprivation is driven by hypertrophy of nondeprived neurons, which should not require a further reduction of neurofilament labeling in deprived cells.
Quantification of neurofilament loss (A) and gross neuronal structural change (B), assessed as a comparison of measurements from deprived and nondeprived dLGN layers, is plotted across deprivation duration. Each symbol in this graph represents a deprived/nondeprived comparison within a single animal (see Materials and methods). Reduced neurofilament-positive cell density was measured for all subunits in deprived layers after 4 days of deprivation, and the effect grew as deprivation duration increased. The temporal profile for gross structural change largely paralleled the effect of deprivation on neurofilament labeling. The magnitude of structural change was correlated with the extent of labeling reduction for H (Pearson correlation coefficient: r = 0.83), M (r = 0.87), and L (r = 0.73) neurofilament subunits (C). Dashed lines in A and B indicate the value at which there is no difference between deprived and nondeprived measurements. Dashed lines in (C) represent the line of best fit.

The impact of monocular occlusion begun in adulthood was examined in two adult animals, both deprived outside the critical period for ocular dominance plasticity (Olson & Freeman, Reference Olson and Freeman1980). Deprived layers of the dLGN showed no change in neurofilament immunolabeling when compared to nondeprived layers (Fig. 6A–6C). For all three neurofilament subunits, labeling characteristics in deprived layers were indistinguishable from those in nondeprived layers. This was borne out in measurements of neurofilament-positive cell density, which revealed no difference in mean density between deprived and nondeprived layers (Fig. 6D) for neurofilament H (Student’s t-test = 0.92), M (Student’s t-test = 0.59), or L (Student’s t-test = 0.79). Likewise, there was no difference in mean somatal area between deprived (average = 213 mm2; SD = 24 mm2) and nondeprived (average = 230 mm2; SD = 15 mm2) neurons (Student’s t-test = 0.27), as has been previously reported (Wiesel & Hubel, Reference Wiesel and Hubel1963b). The overall lower number of immunolabeled cells in the dLGN of adults relative to younger animals seems not to be the consequence of deprivation because a normal adult had cell densities comparable to deprived adults (Fig. 6D).
Monocular deprivation for 14 days begun at 15 years of age did not produce a change in labeling between deprived and nondeprived dLGN layers for H (A), M (B), or L (C) neurofilament subunits. A second cat was deprived at 1 year for 2 months and also showed no change in labeling or in somatal size in dLGN (tissue not shown). Density of neurofilament-positive neurons was quantified for each subunit from both cats deprived in adulthood and a single normal adult cat (D). The results of this analysis showed no difference in the density of neurofilament-positive neurons between nondeprived (gray bars) and deprived (black bars) dLGN layers. Cell densities measured from a single normal adult (white bars) were comparable to those from the deprived animals. Scale bar = 1 mm.

Discussion
Monocular deprivation initiated at the peak of the critical period reduced labeling for H, M, and L subunits of the neurofilament triplet protein within the A layers of the kitten dLGN serving the deprived eye. Lost labeling was evident for all subunits after 4 days of deprivation, and the extent of loss became progressively larger with increasing deprivation duration until it reached a peak loss at 8 days. The temporal profile of labeling reduction was not different between subunits. Cytostructural modification assessed by somatal measurements was evident in deprived dLGN layers, and its progression largely paralleled the loss of neurofilament labeling. Monocular deprivation started in adulthood did not produce a difference in neurofilament labeling or mean soma size between deprived and nondeprived dLGN layers.
The effect of monocular deprivation on the structure and function of cell types in the dLGN is believed to be nonuniform. The Y-cell type is particularly susceptible to perturbation by monocular occlusion, evidenced by a marked anatomical change that leaves Y cells with smaller somata and abnormally thin dendrites compared with nondeprived counterparts (Friedlander et al., Reference Friedlander, Stanford and Sherman1982). The physiological manifestation of this conspicuous structural alteration is a marked reduction in the ability to identify Y-cell characteristics in deprived dLGN layers (Sherman et al., Reference Sherman, Hoffmann and Stone1972). Cytostructural alterations consequent to monocular deprivation have been linked to changes in immunolabeling for markers that target Y cells, an example of which is the SMI-32 antibody against the H neurofilament subunit (Bickford et al., Reference Bickford, Guido and Godwin1998; Kutcher & Duffy, Reference Kutcher and Duffy2007). Results from the current study show that deprivation-induced loss of neurofilament labeling is not exclusive to the H subunit. All three neurofilament subunits showed a steep and parallel decline in labeling starting at 4 days of deprivation. That labeling for L and M subunits in normal animals produced a larger number of immunoreactive cells than SMI-32 seems to indicate either that the SMI-32 antibody does not target all Y cells or that L and M labeling reveals neurons outside the Y class. Neurofilaments are the primary cytoskeletal components of mature neurons (Morris & Lasek, Reference Morris and Lasek1982), making it likely that L and M subunits are found in cells beyond the Y class. This has led us to believe that the deprivation-induced reduction of L and M indicates cytostructural change outside the Y-cell class. Despite widespread agreement that the effects of monocular deprivation appear more substantial in Y cells (Sherman et al., Reference Sherman, Hoffmann and Stone1972; Friedlander et al., Reference Friedlander, Stanford and Sherman1982), many of the visual abilities compromised by deprivation seem consistent with dysfunction of the X-cell pathway. A hallmark of deprivation-induced vision impairment is the abatement of fine spatial resolution, a function seemingly well suited to the X-cell class because of their small receptive fields (Enroth-Cugell & Robson, Reference Enroth-Cugell and Robson1966), their tuning to high spatial frequencies (Cleland et al., Reference Cleland, Harding and Tulunay-Keesey1979), their high concentration within the area centralis of the retina (Stone, Reference Stone1973), and because ablation of X cells produces a contrast sensitivity deficit for high spatial frequencies (Blake & Di Gianfilippo, Reference Blake and Di Gianfilippo1980). Our finding that labeling for all neurofilament subunits is reduced by unilateral deprivation supports the possibility that deprivation-mediated cellular modification is not exclusive to Y cells. A direct test of this assumption will require unambiguous identification of cell type, which cannot be achieved by somatal measurements.
Loss of neurofilament in deprived dLGN layers may derive from increased proteolysis possibly provoked by competitive interactions between cells of the dLGN. Calcium-activated cysteine proteases, such as calpain, are known to break down the neurofilament triplet as well as other neuronal intermediate filaments (Schlaepfer & Zimmerman, Reference Schlaepfer and Zimmerman1985; Kamakura et al., Reference Kamakura, Ishiura, Suzuki, Sugita and Toyokura1985; Johnson et al., Reference Johnson, Litersky and Jope1991). Activation of the calcium-conducting n-methyl-d-aspartate (NMDA) receptor can provide the increase in calcium necessary to catalyze the fragmentation of intermediate filaments (del Cerro et al., Reference del Cerro, Arai, Kessler, Bahr, Vanderklish, Rivera and Lynch1994). A requisite step in promoting the decrease in synaptic efficacy that accompanies monocular deprivation is activation of the NMDA receptor (Kleinschmidt et al., Reference Kleinschmidt, Bear and Singer1987; Heynen et al., Reference Heynen, Yoon, Liu, Chung, Huganir and Bear2003). It therefore seems conceivable that increased calcium via the NMDA receptor may additionally supply a critical signal for cytoskeletal alteration and modification of gross neuronal structure in the context of visual deprivation. An alternative explanation for the loss of neurofilament is that deprivation initiates reduced protein synthesis. Reduced synthesis of neurofilament may explain the sustained loss of protein, but it is unlikely to be the cause of the initial reduction. That there is no recovery of protein in the face of deprivation for many months suggests that reduced neurofilament synthesis likely explains the protracted loss of protein due to the high metabolic demand that sustained and indefinite proteolysis would require. The early phase of neurofilament loss, that found upon 4 days of deprivation, is unlikely to be explained by reduced protein synthesis because neurofilament half-life is on the order of several weeks (Nixon & Logvinenko, Reference Nixon and Logvinenko1986; Millecamps et al., Reference Millecamps, Gowing, Corti, Mallet and Julien2007). Our suspicion is that the initial loss of neurofilament is mediated by increased protease activity, while the sustained loss of neurofilament likely derives from reduced protein synthesis.
The efficacy of monocular deprivation to alter the structure and function of neurons wanes as the visual system matures beyond the peak of the critical period. A marked shift in the ocularity of visual cortex that is typical of early-onset monocular deprivation does not occur if deprivation is begun in adulthood, measured either by single-unit recording (Hubel & Wiesel, Reference Hubel and Wiesel1970) or, as has been demonstrated more recently, by imaging of intrinsic brain signals (Sato & Stryker, Reference Sato and Stryker2008). Likewise, neurons in the dLGN of adult cats are resistant to the changes in cell size typical of deprivation during the critical period (Wiesel & Hubel, Reference Wiesel and Hubel1963b). Our finding that gross structure and neurofilament labeling are unaltered by adult monocular deprivation is consistent with neurofilament loss being causally linked to alteration of neuron structure. If the sole cause of neurofilament reduction was imbalanced activity between the eyes, lowered amounts of the protein would be expected to arise from monocular deprivation irrespective of the timing of its onset. The current results, however, cannot disprove the possibility that deprivation-induced neurofilament loss early in life is linked to imbalanced activity levels by an intermediary whose presence happens to parallel the temporal profile of susceptibility to deprivation-induced structural change.
Reduced neurofilament H labeling in the LGN consequent to monocular deprivation is evident in the monocular segment of the LGN (Bickford et al., Reference Bickford, Guido and Godwin1998; Kutcher & Duffy, Reference Kutcher and Duffy2007), the most lateral portion of deprived layer A where neurons are resistant to the somatal changes typical of monocular deprivation (Guillery & Stelzner, Reference Guillery and Stelzner1970). Results from the current study indicate that loss of labeling in the monocular segment extends to include all three neurofilament subunits. The proposal of Bickford et al. (Reference Bickford, Guido and Godwin1998) is that neurofilament loss results from cell class competition between X and Y cells, which is put in a state of imbalance by a marked reduction of Y-type retinogeniculate arbors but not X-type arbors (Sur et al., Reference Sur, Humphrey and Sherman1982). Results from the LGN of binocularly deprived cats cast some doubt on the cell class competition model being the sole explanation of neurofilament loss. Though binocular deprivation would presumably produce a competitive advantage for X cells in both left and right eye layers, there is no loss of neurofilament labeling following closure of both eyes (Kutcher & Duffy, Reference Kutcher and Duffy2007). Data in the current manuscript cannot establish if cell class competition or binocular competition is at the origin of neurofilament loss, but it seems reasonable to propose that, irrespective of cause, the loss of protein permits cytostructural modification even in the monocular segment where neurons may undergo a degree of modification below that detectable by somatal measurements but that still requires loss of neurofilament.
The results of this study demonstrate that monocular deprivation can effect a considerable modification of the neuronal cytoskeleton when it is begun early in postnatal life. The location and timing of reduced neurofilament labeling were found to parallel the change in gross structure typical of monocular deprivation, indicating that neurofilament loss may be a requisite precursor to this structural plasticity.
Acknowledgments
The authors thank Dr. Donald Mitchell for his comments on this manuscript. This work was supported by grants from the Natural Sciences and Engineering Research Council of Canada, and from the Nova Scotia Health Research Foundation.