I. ENERGY CRISIS AND WASTE HEAT
The combination of fossil energy and heat engines brought big changes to our life. It provides us fun to drive, warmth to escape from cold, brightness of illumination, many kinds of industrial products, etc. It is not too much to say that our society is controlled by energy. The demand of primary energy, mainly the fossil energy, will be predicted, according to the current consumption around 13,500 million tons of oil per year in 2015 in the world.1 All oil deposit is estimated to last for about 40 years in the present consumption rate. But the amount of oil consumption is increasing year by year. The carbon dioxide, occupying the largest amount of greenhouse gases, is emitted from many places by combustion of the fossil energy. The amount of carbon dioxide emission will increase with increasing consumption of fossil energy. It is predicted that the amount of CO2 emission in 2030 will reach almost twice as much as in 1990.2
In both energy and environment points of view, new power generation systems such as fuel cells, photovoltaic cells, concentrating solar power generation, wind-power generation, biomass, geothermal generation, and tidal power generation are developing with great expectations. The spread of such new power generation, however, does not progress notably. This is due to not only technical issues but also initial cost, running cost, investment recovery, etc.
Since the present heat engines are Carnot cycles, waste heat is always formed by energy conversion. The average of total efficiency utilized for the primary energy is as low as 30%, with 70% exhausted to the air as waste heat.Reference Hirata3 To enhance the total energy efficiency and to reduce the carbon dioxide emission, such waste heat should be converted to the electrical energy.
Technologies of heat storage and transport have been developing. However, since most sources of waste heat are widely and thinly dispersed, it is difficult to use such heat energy efficiently. Electricity is a convenient form of energy in points of view of transportation, storage, and conversion. Thus, the direct conversion of waste heat to electricity has placed high expectations. Thermoelectric conversion has paid attention as the strongest candidate to generate electricity from dilute waste heat.
The waste heat is widely dispersed and can be found in the temperature region from 323 K to higher than 1273 K. Figure 1 shows the industry-classified waste heat energy with temperature higher than 473 K.4 The heat energy with temperature higher than 673 K occupies about 29%. However, the effective energy, exergy, considered Carnot efficiency (ΔT/T H), the percentage of the heat energy with temperature higher than 673 K reaches about 45%. Here, ΔT and T H are temperature difference between the hot and cold sides and the hot side temperature of the conversion system, respectively. In this evaluation, the cold side temperature is fixed at 353 K.
Distribution of waste heat with temperatures higher than 473 K against the temperature from the industry in Japan for (a) the net energy and (b) the reduced one by Carnot efficiency (ΔT/T H).4 The cold side temperature is fixed at 353 K.

II. THERMOELECTRIC GENERATION
Thermoelectric generation uses the Seebeck effect; a voltage is induced in an electrical conducting material by a temperature gradient between both ends. The performance of the thermoelectric materials is evaluated by the dimensionless thermoelectric figure of merit ZT. This factor is composed of three physical properties of the materials: the Seebeck coefficient S, electrical resistivity ρ, thermal conductivity κ, and temperature T.
 $$ZT = {{{S^2}T} \over {\rho \kappa }}\quad .$$
The better materials have the higher ZT values. Namely, good materials show large S, low ρ, and low κ. However, these three factors are dominated by charge carrier density and in a three-way deadlock. The ZT value indicates indirectly the conversion efficiency from heat to electricity. The conversion efficiency is calculated in Eq. (2),
 $$\eta = {{\Delta T\left( {\sqrt {Z{T_{{\rm{mean}}}} + 1 - 1} } \right)} \over {{T_{\rm{H}}}\sqrt {Z{T_{{\rm{mean}}}} + 1 + {T_{\rm{C}}}} }}\quad .$$
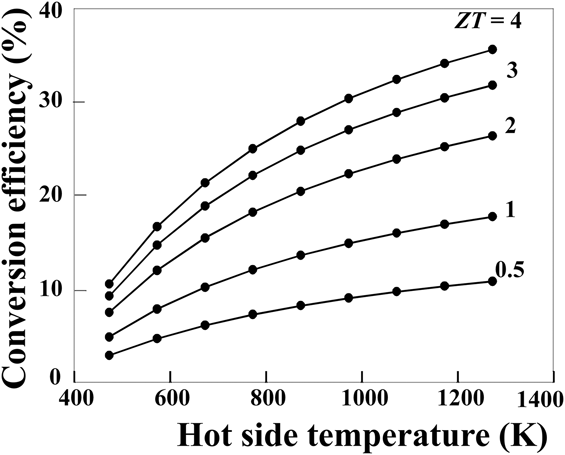
Here, T H, T C, ΔT, and ZT mean correspond to the hot side temperature, cold side temperature, temperature difference between the hot and cold sides, and mean value of ZT between the hot and cold side temperatures of the materials. Figure 2 indicates the hot side temperature dependence of the conversion efficiency calculated in Eq. (2). The cold side temperature is fixed at 353 K. It is clear from Fig. 2 that the thermoelectric conversion efficiency increases with the hot side temperature. Considering the distribution of the waste heat temperature and the conversion efficiency indicated by Figs. 1 and 2, the waste heat with temperature higher than 673 K should be the most important target for thermoelectric generation. The thermoelectric materials should have not only the highest ZT values but also high durability, oxidation resistance, no toxicity, and contents of abundant elements. The silicides and oxides discussed here are promising materials for the application in the middle (673–873 K) and high (873–1273 K) temperature ranges.
Hot-side temperature dependence of thermoelectric conversion efficiency for different ZT values. The cold-side temperature is fixed at 353 K.
III. OXIDE AND SILICIDE THERMOELECTRIC MODULES
Ideal thermoelectric materials are indispensable to thermoelectric power generation. However, these materials should have not only a high dimensionless thermoelectric figure of merit ZT but also high chemical stability and should not contain harmful elements.
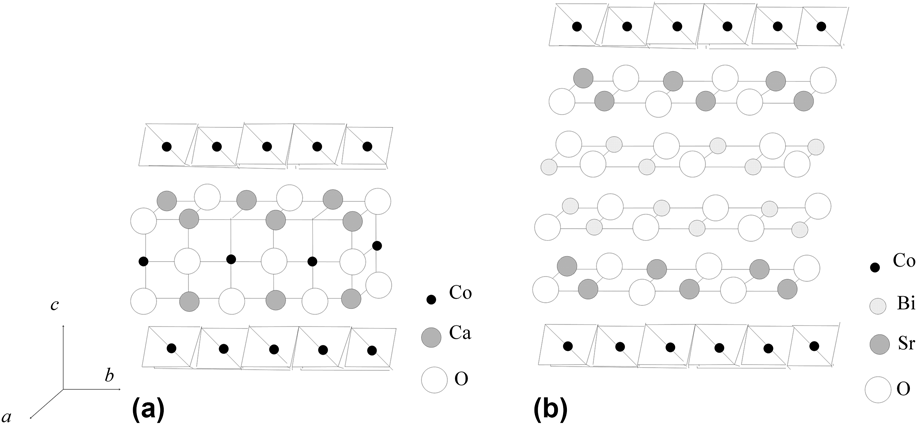
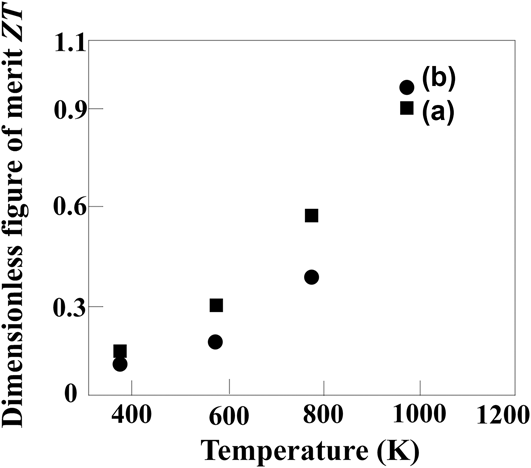
Oxides are one of the strongest candidates for the recovery of high temperature waste heat. Misfit-layered cobaltites have received attention because of their excellent p-type thermoelectric properties at high temperature in air.Reference Funahashi, Matsubara, Ikuta, Takeuchi, Mizutani and Sodeoka5,Reference Funahashi and Shikano6 As shown in Fig. 3, both Ca3Co4O9 and Bi2Sr2Co2O9 are composed of layered structures consisting with CoO2 sublattice, in which a Co element is surrounded by six oxygen elements, and Ca2CoO3 or Bi2Sr2O5 sublattices, respectively. The hexagonal CoO2 sublattice acts as an electric conducting layer with low electrical resistivity and high Seebeck coefficient. The unique thermoelectric property is due to the presence of a small pseudo gap with a width of a few meV across the Fermi level.Reference Funahashi, Matsubara, Ikuta, Takeuchi and Mizutani7,Reference Takeuchi, Kondo, Soda, Mizutani, Funahashi, Shikano, Tsuda, Yokoya, Shin and Muro8 The misfit structure between the sublattices seems to reduce thermal conductivity due to the phonon. The single crystalline whiskers of these oxides show about 1.0 of ZT at 973 K in air as shown in Fig. 4.
Schematic crystallographic structure of (a) Ca3Co4O9 and (b) Bi2Sr2Co2O9.
Temperature dependence of ZT for (a) Ca3Co4O9 and (b) Bi2Sr2Co2O9 single crystals.
Not only thermoelectric materials with high ZT values are required but also modules possessing high conversion efficiency are necessary for thermoelectric generation. The junction between the thermoelectric materials and high temperature electrodes with high bond strength and low contact electrical resistance is essential to obtain high performance modules. Such good junction between the oxide thermoelectric devices and Ag electrodes can be formed by developing commercially available silver paste incorporated with the oxide powder.Reference Funahashi, Urata, Mizuno, Kouuchi and Mikami9 A small oxide thermoelectric module can successfully charge a portable phone.Reference Funahashi, Mikami, Mihara, Urata and Ando10
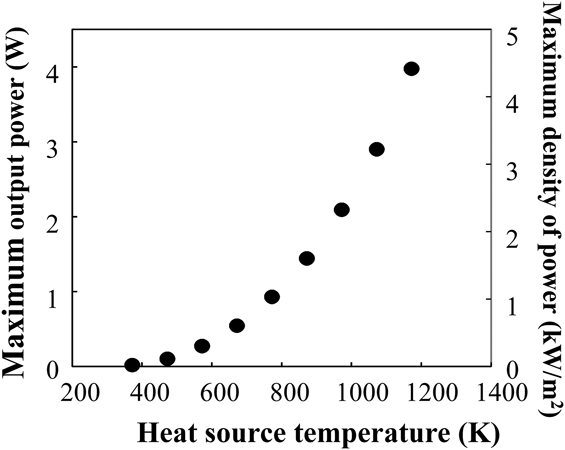
Thermoelectric modules composed of 14 pairs of the p-type Ca2.7Bi0.3Co4O9 and the n-type Ca0.9Yb0.1MnO3 legs were constructed using silver electrodes and silver paste including the p-type powder. Dimensions of both oxide legs were 7 mm wide, 3.5 mm thick, and 5 mm high. There is an alumina substrate on one side of the module but no one on the other side, namely a half-skeleton type module. The Al2O3 substrate is 9.3 cm2 of surface area and 0.38 mm thick. The module can generate up to 2.4 V and 4.0 W of open circuit voltage and maximum power, respectively, at 1173 K of the heat source temperature (electrical heater with a plate shape). The side without the substrate of the module is cooled 293 K in air by circulated water (Fig. 5). The maximum density of power against the surface of the Al2O3 substrate reaches 4.3 kW/m2. This value includes technical skills to fabricate the modules and depends on the heat flux of the heat source for the measurement. Moreover, since there is no definition of the power density, it is calculated usually by the summation of the cross-sectional area of the legs. So it is difficult to compare the power density with other modules. The power density of a commercially available Bi2Te3 module has been measured using the same system. Although the temperature conditions are different, it reaches about 6 kW/m2 at 473 K of the heat source temperature.
Heat source temperature dependence of output power and density of power against the surface of the Al2O3 substrate of Ca3Co4O9/CaMnO3 thermoelectric modules.
For the application in the middle temperature range, silicide compounds are one of the strongest candidates because of their oxidation resistance by the formation of the passive layer on the surface. In fact, MnSi1.75 and FeSi2 are well known as thermoelectric materials usable at high temperature even in air.Reference Yamada, Miyazaki and Yamane11–Reference Morikawa, Chikauchi, Mizoguchi and Sugihara14 A new n-type silicide material, Mn3Si4Al2, has been discovered and investigated its thermoelectric properties.Reference Funahashi, Matsumura, Tanaka, Takeuchi, Norimatsu, Combe, Suzuki, Wang, Wan, Katsuyama, Kusunoki and Koumoto15
The ZT value for the Mn3Si4Al2 bulk increases with increasing temperature and reaches 0.2 at 773 K in air [Fig. 6(b)]. However, it decreases suddenly at 973 K. This is due to the decrease in Seebeck coefficient because of transition to the intrinsic range [Fig. 6(a)]. To enhance the ZT values, controlling the career density by elemental substitution and optimizing the microstructure including the secondary phases which can act as phonon scattering sites for decreasing the κ values are vital.
(a) Temperature dependence of Seebeck coefficient and electrical resistivity and (b) thermal conductivity and dimensionless figure of merit ZT for the Mn3Si4Al2 bulk.
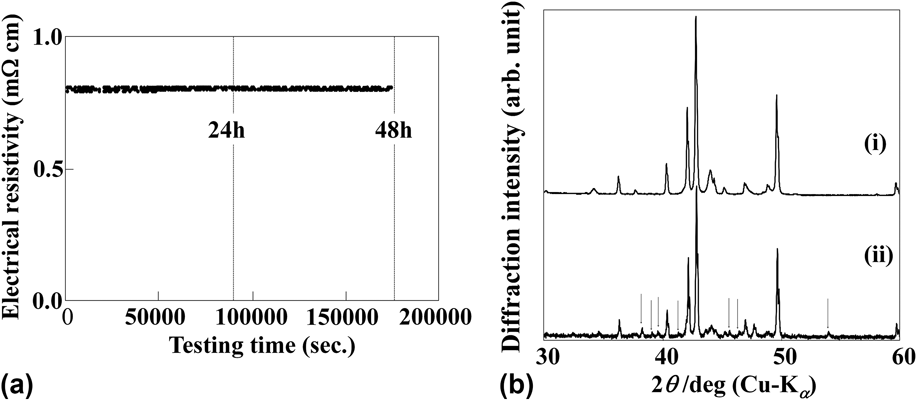
The Mn3Si4Al2 bulk shows good oxidation resistance at 873 K in air. Figure 7(a) indicates the ρ values measured continuously at 873 K in air. After measuring for 48 h with a direct current of 220 mA, the ρ values are maintained constant. Additional diffraction peaks which can be assigned to alumina, silica, or complex oxides of the constituent elements are detected in the x-ray diffraction (XRD) pattern after the measurement [Fig. 7(b)]. The color of the surface of the sample after the measurement at 873 K changes from silvery to brown color.Reference Funahashi, Matsumura, Tanaka, Takeuchi, Norimatsu, Combe, Suzuki, Wang, Wan, Katsuyama, Kusunoki and Koumoto15 These results indicate that Mn3Si4Al2 is oxidized, but it is restricted to only the surface. Since the oxides formed on the surface act as the passive layer to protect the inside of the Mn3Si4Al2 bulk from oxidation, the ρ values are kept constant at 873 K even in air.
(a) Electrical resistivity measured continuously at 873 K in air and (b) XRD patterns before (i) and after (ii) the continuous measurement at 873 K for 48 h in air for the Mn3Si4Al2 sample. Diffraction peaks of secondary phases are observed after testing and are pointed out by arrows.
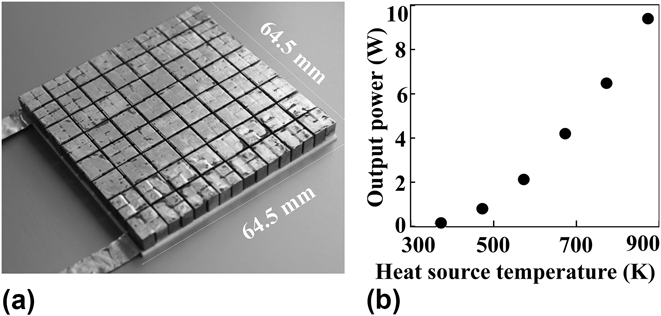
A thermoelectric module composed of 64 pairs of n- and p-type legs was fabricated. The compositions of the p- and n-type devices are MnSi1.7Reference Aoyama, Fedorov, Zaitsev, Solomkin, Eremin, Samunin, Mukoujima, Sano and Tsuji12 and Mn3Si4Al2, respectively. The module has an Al2O3 substrate of 64.5 mm × 64.5 mm on one surface (half skeleton structure). The picture of the thermoelectric module is shown in Fig. 8(a). The maximum output power increases with the hot side temperature and reached 9.4 W at 873 K for the heat source temperature [Fig. 8(b)]. The power density of the 14 pair module, which has the same dimensions of the oxide module indicated above, reaches 3.9 kW/m2 at 873 K for the heat source temperature. Although the durability and lifetime testing will be carried out more minutely, the silicide module seems a promising device for the recovery of waste heat in the middle temperature range.
(a) A photograph of the Mn3Si4Al2/MnSi1.7 module and (b) hot-side temperature dependence of output power measured in air.
Power generation of the oxide and silicide modules demonstrates that these thermoelectric materials can be expected for the application in the middle and high temperature ranges even in air. The ZT values, however, have to be improved by the optimization of the carrier density and/or the microstructure.
IV. THERMOELECTRIC PROPERTY OF Bi2Sr2Co2O9 BY CONTROLLING MICROSTRUCTURE
An oxide module has been produced by using Ca3Co4O9 bulk material.Reference Funahashi, Urata, Mizuno, Kouuchi and Mikami9 Polycrystalline Ca3Co4O9 samples show lower ZT values than single crystalline samples because of the grain boundary and misalignment.Reference Funahashi, Matsubara, Ikuta, Takeuchi, Mizutani and Sodeoka5,Reference Masset, Michel, Maignan, Hervieu, Toulemonde, Studer, Raveau and Hejtmanek16,Reference Wang, Cheng, Yao and Li17 Therefore, the microstructure of the polycrystalline materials should be optimized by processing techniques to enhance the ZT values, not only by using solid-state reaction but also by using a melt-solidification processing (partial melting) method. Indeed, the melt-solidification method is effective for controlling the grain size and alignment, which strongly impact the electrical and thermal transport properties. However, once Ca3Co4O9 is melted, it is difficult to reform this phase, because it is an incongruent system which is decomposed into solid and liquid phasesReference Madre, Costa, Ferreira, Sotelo, Torres, Constantinescu, Rasekh and Diez18,Reference Funahashi, Matsubara and Sodeoka19 and after the solidification, the formation of Ca3Co2O6 is preferred. On the other hand, the melt-solidification method can also be successfully applied to the Bi2Sr2Co2O9 phase.Reference Combe, Funahashi, Azough and Freer20
A. Preparation of Bi2Sr2Co2O9 bulks by the partial melting method
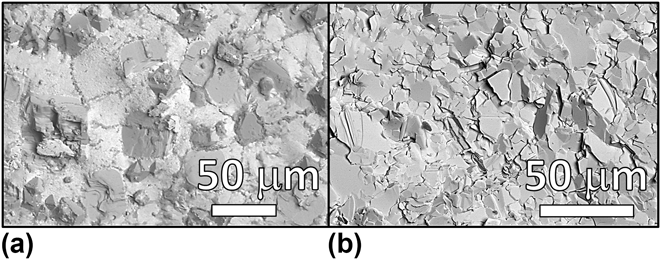
Figure 9(a) shows a scanning electron microscopic (SEM) image for the Bi2Sr2Co2O9 sample quenched from 1196 K. An endothermic peak is observed for the Bi2Sr2Co2O9 powder at 1196 K by differential thermal analysis. By melting the Bi2Sr2Co2O9 phase, the Sr–O and Co–O phases and Bi–Sr–O phases are formed by the incongruent melting [Fig. 9(a)]. Considering the cationic compositions, the Bi–Sr–O phase seems to be in the liquid state and the Sr–O and Co–O solid phases at 1196 K. This state is called as “partial melting state.” By slow cooling from the melted state, the Bi2Sr2Co2O9 phase can be reformed through a peritectic reaction between the Bi–Sr–O liquid phase and the Sr–O and Co–O solid phases [Fig. 9(b)].
(a) Scanning electron micrographs of Bi2Sr2Co2O9 bulk materials quenched from the partial melting state at 1196 K and (b) after complete solidification by slow cooling.
In this study, Bi2Sr2Co2O9 bulk materials have been prepared as follows. Conventional sintering was carried out by a heat treatment of green Bi2Sr2Co2O9 pellets at 1183 K for 20 h in air under atmospheric pressure. Bi2Sr2Co2O9 green pellets have also been hot pressed at 1123 K for 20 h in air under a uniaxial pressure of 3.5 MPa. Concerning the use of partial melting method, the green Bi2Sr2Co2O9 pellets were heated at 1196 (or 1213 K) for 10 h in air and slowly cooled to room temperature for 20 h. Finally, other Bi2Sr2Co2O9 green pellets were treated by an initial partial melting heat treatment at 1196 K for 10 h before being hot pressed at a uniaxial pressure of 3.5 MPa at 1123 K for 20 h. Both partial melting and hot pressing (PMHP) were achieved successively during the same heat treatment.
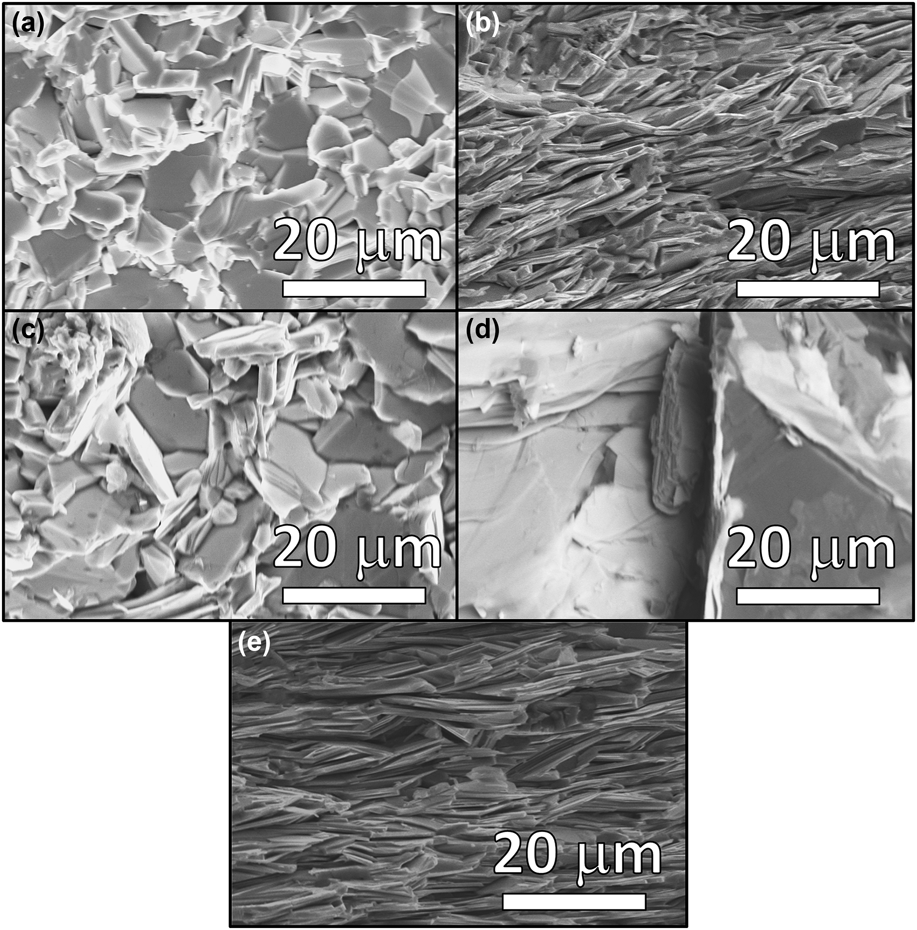
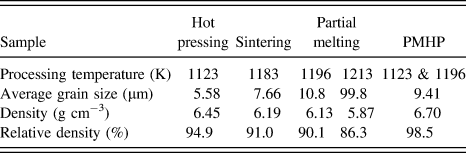
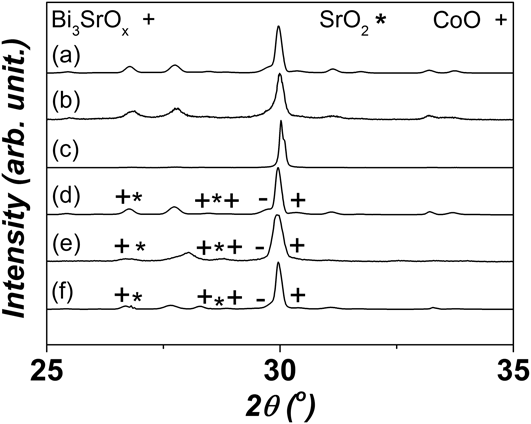
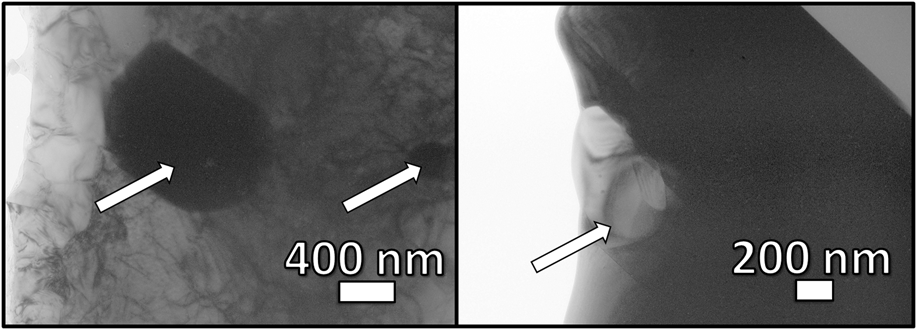
Using partial melting process promotes significant grain growth by comparison with a conventional sintering technique (Fig. 10). The average grain size grows from 7.7 to 10.8 µm between samples prepared by conventional sintering or by partial melting at 1196 K (Table I). By preparing samples at higher temperature (1213 K), the microstructure of samples exhibits large grains for the Bi2Sr2Co2O9 main phase (almost 100 µm) and the Bi–Sr–O, Sr–O, and Co–O phases as the remnant secondary phases [Fig. 10(c)]. As revealed by XRD analysis, the different phases formed by the incongruent melt by the partial melting remain after the complete solidification of Bi2Sr2Co2O9 samples partially melted at 1196 and 1213 K (Fig. 11). The Sr–O and Co–O phases with several μm of grain size are detected in the Bi2Sr2Co2O9 grains by transmission electron microscope (TEM) observation in the sample prepared by the partial melting at 1196 K (Fig. 12). The grain sizes of the secondary phases depend on the processing temperature of the partial melting step.
(a) Scanning electron micrographs of Bi2Sr2Co2O9 bulk materials prepared by: conventional sintering at 1183 K, (b) hot pressing at 1123 K, partial melting process [(c) temperatures of 1196 and (d) 1213 K], and (e) combined partial melting hot pressing heat treatment. Secondary phase is shown by arrows in the micrograph of the sample prepared by a partial melting process at 1213 K.
Average grain size, bulk density, and relative density against the theoretical value for the different Bi2Sr2Co2O9 bulk materials prepared in this study.
X-ray powder diffraction of the different Bi2Sr2Co2O9 bulk materials.
Transmission electron micrographs of secondary phases observed in Bi2Sr2Co2O9 samples prepared by a partial melting technique. Secondary phases are represented by arrows.
The layered structure of the Bi2Sr2Co2O9 phase promotes a strong anisotropy of thermoelectric properties. The crystallographic ab-plane should be aligned. Therefore, the preferential orientation of the plate grains of the Bi2Sr2Co2O9 phase must be controlled.Reference Itoh and Terasaki21,Reference Terasaki, Tanaka, Satake, Okada and Fujii22 To achieve a suitable preferential grain orientation, applying pressure during heat treatment is effective.Reference Shin and Murayama23,Reference Masuda, Nagahama, Itahara, Tani, Seo and Koumoto24 Highly improved preferential grain orientation has been achieved in Bi2Sr2Co2O9 bulk materials prepared by using a uniaxial hot pressing technique [Figs. 10(d) and 10(e)]. Moreover, the hot pressing greatly improves the bulk density (Table I). On the other hand, the bulk density is 90% or lower for the partially melted samples. The misalignment of the Bi2Sr2Co2O9 plate shape grains is one of the reasons for the low bulk density in the partially melted samples. By combining PMHP techniques, Bi2Sr2Co2O9 bulk materials possessing simultaneously an important average grain size, optimized preferential grain orientation, and bulk density are achieved [Fig. 10(f) and Table I].
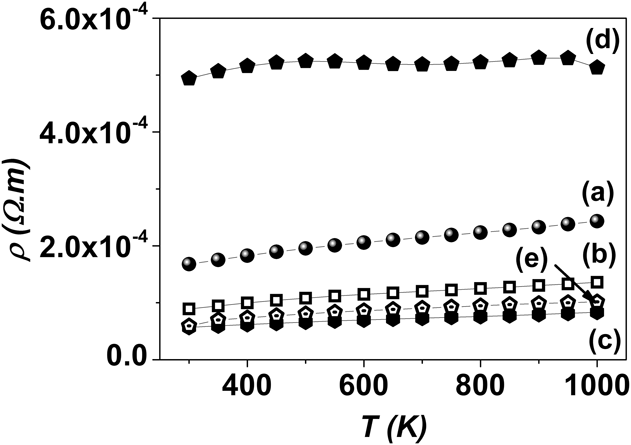
PMHP techniques appear as suitable processing techniques for improving the electronic transport properties of the Bi2Sr2Co2O9 bulk materials (Fig. 13). The ρ value measured at 1000 K in air for the hot pressed sample at 1123 K is almost half of that for the sintered sample at 1183 K. The decrease in the ρ values is linked to the simultaneous improvement of bulk density and grain preferential orientation in the hot pressed sample. Although the grain orientation and the bulk density of the partially melted at 1193 K are almost the same with the sintered sample, the ρ values of the former are much lower than the latter. The Bi2Sr2Co2O9 grains are grown well by a partial melting method. The grain size of Bi2Sr2Co2O9 is a capital point for controlling the electrical property, with an influence largely superior to the bulk density or even the preferential grain orientation. However, the temperature of partial melting is extremely important to control. The partially melted sample at 1213 K possesses extremely large Bi2Sr2Co2O9 grains. However, the secondary phases also have large grain size, which significantly impacts the ρ values. The ρ values of samples prepared by combining the PMHP processing confirmed this tendency. Despite the simultaneous optimization of bulk density and preferential grain orientation, the ρ values are slightly higher for the PMHP sample than the sample prepared by the partial melting at 1196 K because of the grain size.
(a) Temperature dependence of electrical resistivity ρ for the different Bi2Sr2Co2O9 bulk materials prepared by: conventional sintering at 1183 K, (b) hot pressing at 1123 K, partial melting process [(c) temperatures of 1196 and (d) 1213 K], and (e) combined partial melting hot pressing heat treatment. Secondary phase is shown by arrows in the micrograph of the sample prepared by a partial melting process at 1213 K.
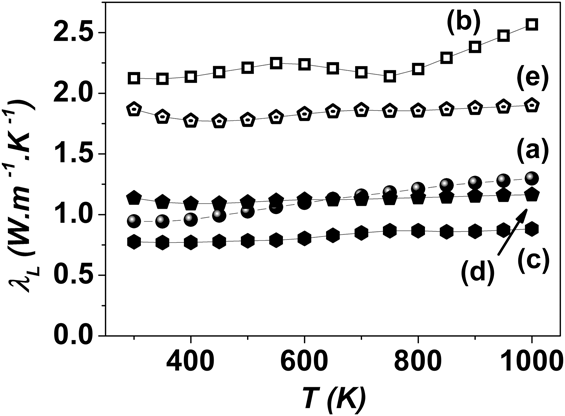
Considering the ρ values, the thermal conductivity for the Bi2Sr2Co2O9 samples largely depends on the phonon thermal conduction κL.Reference Funahashi and Shikano6,Reference Terasaki, Tanaka, Satake, Okada and Fujii22 The lowest κL values are obtained for the sample partially melted at 1196 K (Fig. 14). This is attributed to the low bulk density. However, the secondary phases observed in the sample partially melted at 1193 K must be also taken into account. To clearly investigate the role of secondary phases in the thermal transport property, it is necessary to pay attention to the Bi2Sr2Co2O9 samples prepared by hot pressing and by combining PMHP techniques. Despite the samples prepared by combining PMHP techniques exhibit the preferable bulk density, grain orientation, and grain size to high thermal conductivity, it presents lower κL values than sample prepared by hot pressing at 1123 K (Fig. 14). The presence of the secondary phases has also a significant impact on the decrease in the lattice thermal conductivity of the Bi2Sr2Co2O9 bulk materials. On the other hand, these small grains of the secondary phases hardly affect the electrical transport property. It appears that the individual control of the electrical and thermal transport properties is possible in the Bi2Sr2Co2O9 bulk materials by the partial melting method.
(a) Temperature dependence of the lattice part of the thermal conductivity λL for the different Bi2Sr2Co2O9 bulk materials prepared by: conventional sintering at 1183 K, (b) hot pressing at 1123 K, partial melting process [(c) temperatures of 1196 and (d) 1213 K], and (e) combined partial melting hot pressing heat treatment.
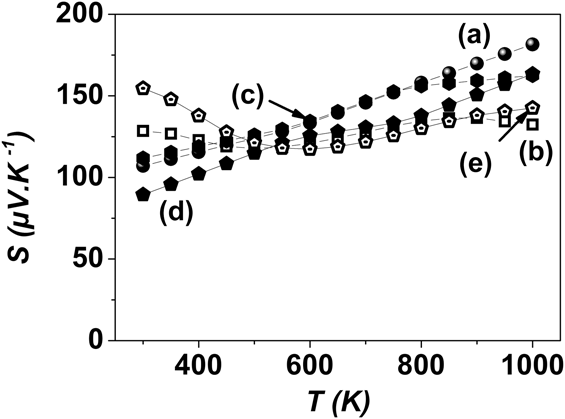
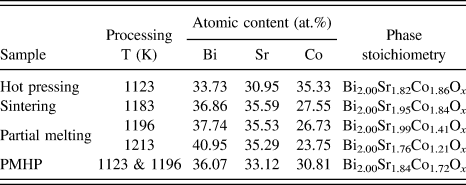
The Seebeck coefficient S values for the Bi2Sr2Co2O9 bulk materials except the samples prepared by hot pressing and by combining PMHP techniques basically increase with increasing temperature (Fig. 15). This difference might be due to the grain orientation. The difference in S values among the samples mainly results from the difference in cationic composition, as shown in Table II, or/and oxygen content for the grains of the main phase. The Bi2Sr2Co2O9 phase can easily accept elemental nonstoichiometry.
(a) Temperature dependence of the Seebeck coefficient S values for the different Bi2Sr2Co2O9 bulk materials prepared by: conventional sintering at 1183 K, (b) hot pressing at 1123 K, partial melting process [(c) temperatures of 1196 and (d) 1213 K], and (e) combined partial melting hot pressing heat treatment.
Atomic content and chemical composition of the main phases in the different prepared Bi2Sr2Co2O9 bulk materials.
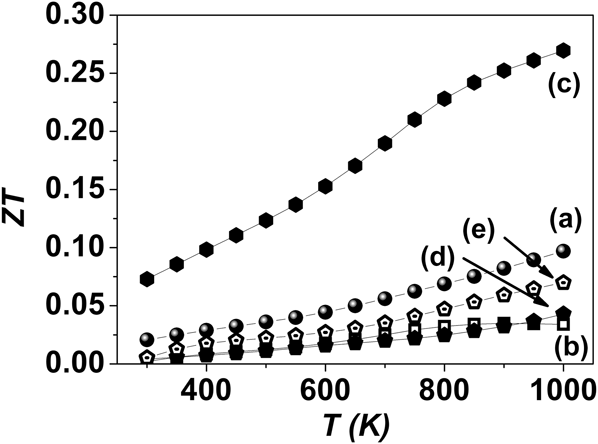
The dimensionless figure of merit ZT values is plotted in Fig. 16. Despite the low ρ values have been achieved by hot pressing due to the simultaneous improvement of bulk density and grain preferential orientation, the ZT values are lower than the sintered sample because of the increase in thermal conductivity. On the other hand, the electrical and thermal transport properties can be improved individually by the grain growth, and the pores and secondary phases, respectively. The ZT value of the partially melted sample reaches 0.27 at 1000 K in air. To the best of our knowledge, this important ZT value is 42% higher than the best ZT value reported so farReference Funahashi and Shikano6 and has been achieved without doping or using complex processing way.
(a) Evolution of the dimensionless figure of merit ZT with temperature for the different Bi2Sr2Co2O9 bulk materials prepared by: conventional sintering at 1183 K, (b) hot pressing at 1123 K, partial melting process [(c) temperatures of 1196 and (d) 1213 K], and (e) combined partial melting hot pressing heat treatment.
The partial melting is a promising preparation method to enhance thermoelectric conversion efficiency of the oxide materials. To increase the ZT values, the preferable microstructure and formation of the secondary phases should be achieved by optimization of preparation condition. One of the strong points of the partial melting method for the Bi2Sr2Co2O9 bulk materials is adaptable to the mass production for large scale applications.
V. THERMOELECTRIC PROPERTY OF Mn3Si4Al2 BY ELEMENTAL SUBSTITUTION
Although the ZT values of the layered Co based oxide materials around unity are obtained at temperatures higher than 800 K, the enhancement of ZT is necessary at temperatures lower than 800 K. Thermoelectric materials possessing high ZT and oxidation resistance are necessary in the temperature region of 500–800 K for application using waste heat recovery. Higher manganese silicides and iron silicides such as Mn4Si7,Reference Gottlieb, Sulpice, Lambert-Andron and Laborde25 Mn11Si19,Reference Schwomma, Nowotny and Wittmann26,Reference Schwomma, Preisinger, Nowotny and Wittmann27 Mn15Si26,Reference Schwomma, Nowotny and Wittmann26,Reference Schwomma, Preisinger, Nowotny and Wittmann27 and FeSi2Reference Morikawa, Chikauchi, Mizoguchi and Sugihara14 have been intensively studied as the promising thermoelectric materials since the 1960s particularly in Russia and Japan.Reference Nikitin, Tarasov and Tamarin28–Reference Nishida30 Indeed, due to the nontoxicity and low-cost of these systems, they offer a massive opportunity to create very low cost thermoelectric materials. Currently, the work therefore continues to focus on the development of thermoelectric materials and processing methods that not only exhibit high performance but also possess both high chemical stability and the potential to be produced on a large scale.
A. Chemical formula and crystal structure
Based on this trend, a new n-type thermoelectric material, Mn3Si4Al2, was reported for the first time by Funahashi et al. in 2012.Reference Funahashi, Matsumura, Tanaka, Takeuchi, Norimatsu, Combe, Suzuki, Wang, Wan, Katsuyama, Kusunoki and Koumoto15 This pure compound was synthesized by arc melting and densified by spark plasma sintering (SPS) at 1023 K held for 15 min under a uniaxial pressure of 30 MPa in a vacuum. This process also contributes to emphasize this compound as a promising candidate for large scale thermoelectric applications through a cost-effective scaling-up industrial production.
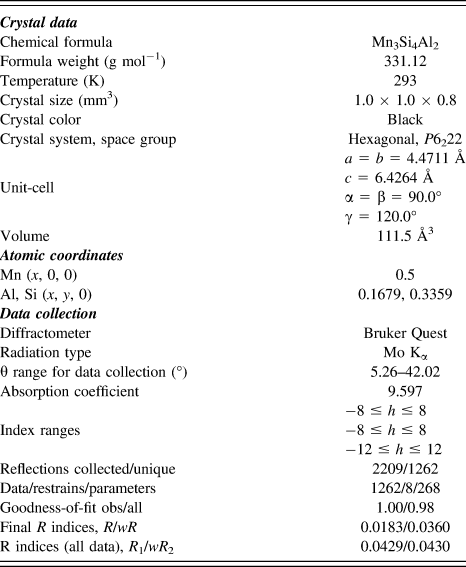
To investigate the detailed crystal structure of Mn3Si4Al2, single-crystal x-ray measurements were performed and solved with SheLX and Jana2006Reference Petricek, Dusek and Palatinus31. Details of the data collection and structural refinements of the Mn3Si4Al2 phase are gathered in Table III. Mn3Si4Al2 phase crystallizes in the hexagonal CrSi2-type (C40) structure (space group P6222 no 180). The structural refinement leads to unit cell parameters a = 4.4711 Å and c = 6.4264 Å and to the atomic coordinates of Mn, Si, and Al (Table III). The modeling highlights two distinct atomic positions, one for Mn and another one for both Al and Si. It can be pointed out that Al and Si seem to be randomly distributed, indeed the slight difference between these two elements did not allow supposing an eventual periodicity as it can be observed in MnSi1.7.Reference Miyazaki, Igarashi, Hayashi, Kajitani and Yubuta32
Crystal data and data collection parameters for Mn3Si4Al2.
The detailed structure is also investigated by electron diffraction (ED) and transmission electron microscopy (T2EM) measurements from some incident directions [Fig. 17(A)]. Strong fundamental diffraction spots observed were confirmed to be originated from the CrSi2 structure type as indexed in Fig. 17(A), confirming the space group deduced by single crystal XRD. In addition, our careful analysis revealed the presence of weak diffraction spots as indicated by red circles. These spots were present at (1/3, 1/3, and 0) positions in the reciprocal space, which suggest a superlattice structure although no superlattice had been observed in the single crystal analyzed. The high resolution TEM [Fig. 17(B)] analyses also confirm the unit cell parameters of Mn3Si4Al2 obtained by single crystal XRD and show well crystallized sample.
ED patterns (A) along (i) [001], (ii) [100], (iii) [1-10], and (iv) [-111] and (B) lattice image of Mn3Si4Al2.
The single crystal XRD measurement together with the TEM analyses allows presenting a schematic representation of Mn3Si4Al2 (Fig. 18). This hexagonal structure can be described by three different layers along the c-axis direction.
Schematic representation of the layered Mn3Si4Al2 compound.
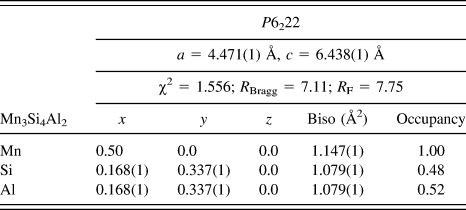
The powder XRD pattern of the synthesized Mn3Si4Al2 recorded at room temperature indicates a single phase and well crystallized compound, through a well-agreement between the calculated Bragg positions (calculated using the crystallographic parameters previously deduced) with those of the experimental peaks as it can be observed in Fig. 19. It can also be mentioned that the bottom line (blue line) in Fig. 18, showing the difference between the experimental and the calculated data, also confirms the purity of this sample. The crystallographic parameters of Mn3Si4Al2, deduced by the Rietveld modeling (WinPLOTR and FullProf softwaresReference Rodriguez-Carvajal33,Reference Roisnel and Rodriguez-Carvajal34 ), are gathered in Table IV. The refined unit cell parameters of Mn3Si4Al2 are close to those obtained by the single crystal XRD, indicating a chemical composition close to the expected nominal stoichiometry. This is in agreement with the refined site occupancies, which correspond to a chemical composition of around Mn3.0Si3.9Al2.1, in accordance with those obtained by energy dispersive x-ray spectrometry (EDX) of both TEM and SEM analyses.
Powder XRD pattern of Mn3Si4Al2; final observed (points) and calculated (solid line) patterns.
Crystallographic parameters of Mn3Si4Al2 deduced from x-ray powder Rietveld refinement at room temperature.
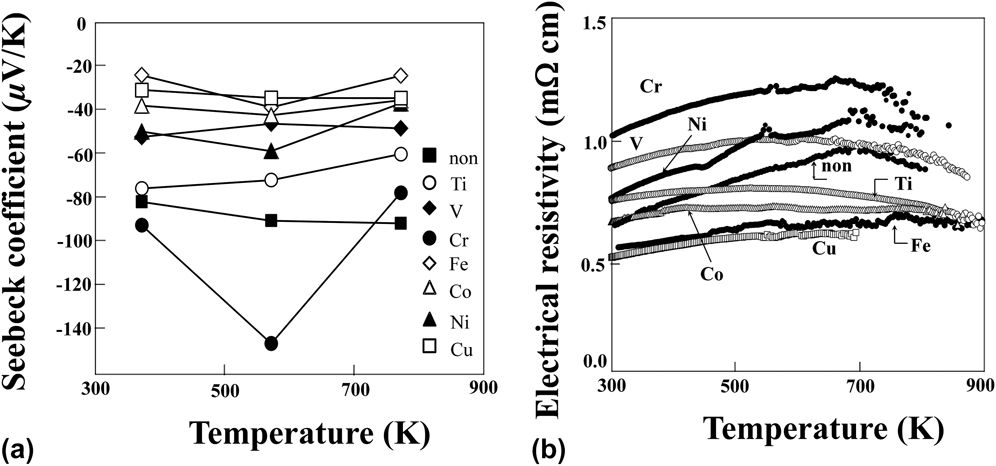
Temperature dependence of the absolute values of Seebeck coefficient for Mn3Si4Al2 shows a maximum as shown in Fig. 20(a). A similar bell-shaped curve can be observed for the resistivity showing a maximum value around 665 K. This electrical conduction behavior changing from metal-like temperature dependence to an insulator-like one at higher temperature can be explained by an intrinsic transition.Reference Funahashi, Matsumura, Tanaka, Takeuchi, Norimatsu, Combe, Suzuki, Wang, Wan, Katsuyama, Kusunoki and Koumoto15Figure 20(b) indicates the temperature dependence of the thermal conductivity and dimensionless thermoelectric figure of merit ZT. A slight temperature dependence of the thermal conductivity reaching around 4 W/m K can be observed on the full temperature range studied. The ZT values of Mn3Si4Al2 increase with increasing temperature from 0.1 at 373 K to 0.21 at 773 K. These values are lower than n-type Mg2Si compound,Reference Zaitsev, Fedorov, Gurieva, Eremin, Konstantinov, Samunin and Vedernikov35,Reference Tani and Kido36 however, comparable to p-type MnSi1.7 compound or higher than n-type FeSi2 compound.Reference Yamada, Miyazaki and Yamane11,Reference Morikawa, Chikauchi, Mizoguchi and Sugihara14 To enhance the ZT values of Mn3Si4Al2, controlling the career density by atomic substitution for the elevation of the transition temperature in the intrinsic range and optimizing the microstructure are vital.
(a) Temperature dependence of Seebeck coefficient and (b) electrical resistivity for Mn3Si4Al2 (nonsubstituted sample) and Mn2.7M0.3Si4Al2 (M: Ti, V, Cr, Fe, Co, Ni, and Cu).
The single crystal XRD measurement highlighted two crystallographic distinct positions leading to the following writing: Mn3(Si4, Al2). To increase the thermoelectric properties of this material, different substitutions were carried out on the manganese site with 3d transition metals, leading to an optimization of the carrier density. The first step of this optimization study is to select the more relevant element regarding the structural stability and carrier concentration. Based on this trend, the following compositions were synthesized using arc melting and SPS processes: Mn2.7M0.3Si4Al2 with M: Ti, V, Cr, Fe, Co, Ni, and Cu. Figure 20(a) indicates temperature dependence on Seebeck coefficient for these samples. The outstanding increase in S values is observed only for the Cr-substituted sample, indeed these values decrease in all other substituted samples; similar improvement of the Seebeck coefficient was recently reported in MnSiδ (δ = 1.73–1.75), confirming the behavior observed in the present study.Reference Ponnambalam, Morelli, Bhattacharya and Tritt37 The S values tend to be more affected by elements, which possess smaller atomic radii such as Cu (1.45 Å), Ni (1.49 Å), and Co (1.52 Å) than Mn (1.56 Å) (Fig. 21)Reference Clementi, L Raimondi and P Reinhardt38 Moreover, since the substitution by these elements after Mn in the periodic table introduces the electron carriers, the simultaneous decreases in both Seebeck coefficient and electrical resistivity are observed. The reason for the obvious effect by the Cr-substitution is an open question. To optimize the Cr composition, the Mn3Si4Al2 samples with different x values of Mn3−xCrxSi4Al2 have been prepared.
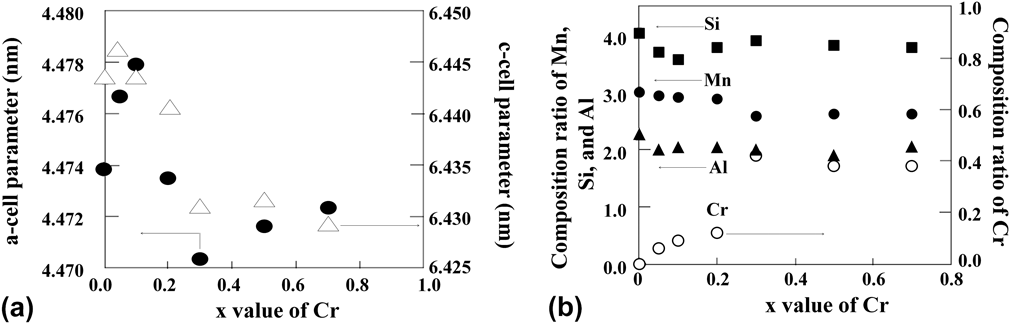
Changing of a- and c-cell parameters (a) and composition ratio of each element (b) with Cr substitution level for Mn3−xCrxSi4Al2.
The a- and c-unit cell parameters are calculated from the powder XRD patterns by the Rietveld refinements. Figure 21(a) indicates that both a- and c-cell parameters obtained from the XRD patterns increase up to x = 0.1 and 0.05, respectively, and decrease with increasing Cr composition. The decrease in the parameters becomes almost constant at x higher than 0.3. According to Vegard's law, the lattice parameters should be increased by substitution of Mn with Cr, which tends to have larger ionic radii than Mn in the case of the same coordination number, valence, and so on.Reference Shannon39 The reason for the shrinkage of the lattice is an open question and should be investigated in more detail with consideration of the coordination number, valence, and so on. The a- and c-cell parameters are independent of the starting composition of Cr with x ≥ 0.3. The average compositional ratios for all elements of each grain measured by EDX are plotted in Fig. 21(b). The ratio of Cr increases steadily up to x = 0.2, then discontinuously jumps up and is saturated in x > 0.3. The composition ratios of Si and Al are almost independent of the x values in the Cr-substituted samples. The changes of the cell parameters and compositional ratios indicate that the solubility limit of the Cr at the Mn site is around x = 0.3.
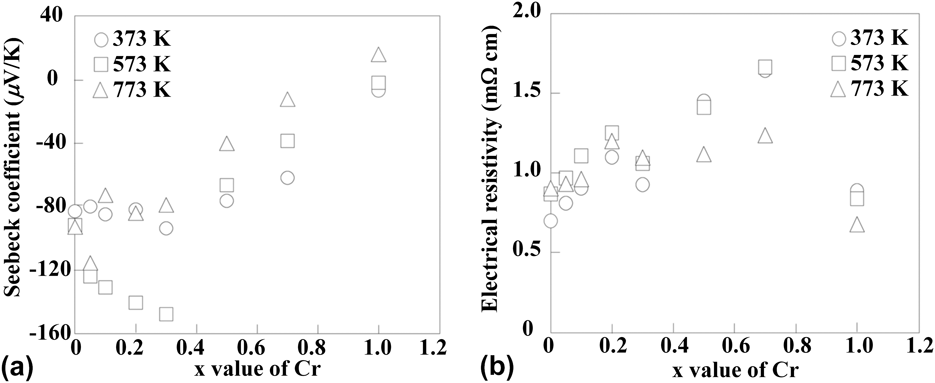
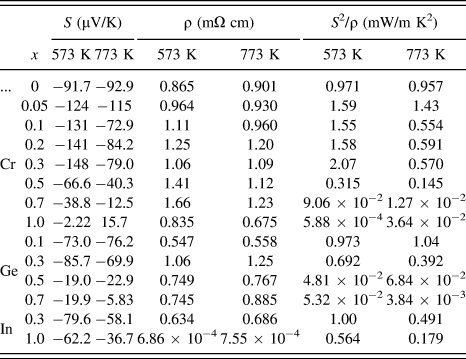
Figure 22 indicates the x value dependence of Seebeck coefficient and electrical resistivity measured in air for Mn3−xCrxSi4Al2. The absolute value of the Seebeck coefficient increases continuously with increasing x value up to 0.3 at 573 K. The increase tendency is also observed at 373 K. On the other hand, electrical resistivity increases with increasing x values. These results indicate that the electron carrier density decreases with the Mn substitution by Cr at the x values lower than 0.3. As mentioned above, the solubility limit of Cr at the Mn site is around x = 0.3, the increase in the ρ values would come from the formation of the secondary phases. The absolute values of Seebeck coefficient seem to be caused by the same reason. The maximum power factor reaches 2.07 mW/m K2 for Mn2.7Cr0.3Si4Al2 at 573 K. The values of S, ρ, and power factor at 573 and 773 K for the substituted samples are summarized in Table V.
Cr substitution level dependence of Seebeck coefficient and electrical resistivity for Mn3−xCrxSi4Al2.
Seebeck coefficient S, electrical resistivity ρ, and power factor S 2/ρ for Mn3−xCrxSi4Al2, Mn3Si4Al2−xGex, and Mn3Si4Al2−xInx at 573 and 773 K.
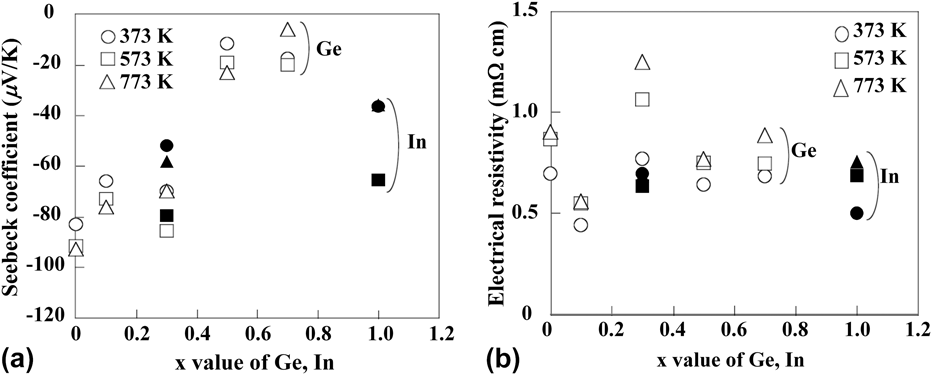
There are other substitutable sites in the Mn3Si4Al2 phase. Thermoelectric properties of Mn3Si4Al2−xGex and Mn3Si4Al2−xInx have been investigated in the temperature range 373–773 K. Both substitutions at the Al site decrease the values of Seebeck coefficient (Fig. 23). The values of power factor are fixed about 1.0 mW/m K2 at 573 K with 0.1 and 0.3 of the x values for Ge and In, respectively, because of the decrease in electrical resistivity. These results indicate that the electrons are doped by Al substitution with Ge and In.
Ge and In substitution level dependence of Seebeck coefficient and electrical resistivity for Mn3Si4Al2−xGex and Mn3Si4Al2−xInx.
VI. CONCLUSION
As mentioned above, the waste heat with the middle and high temperature ranges is high quality energy. At present, such waste heat, especially small scale heat, cannot be used efficiently. Oxide thermoelectric modules have been commercialized and tested on the actual industrial furnaces and incinerators. The durability of the oxide thermoelectric modules is demonstrated by the testing. The cost for power generation, however, is about three times higher than the commercial power supply. To reduce the cost, the development of thermoelectric devices with high ZT values and manufacturing technologies should be indispensable. On the other hand, recently, the authors have succeeded to improve the durability of the silicide modules at the heat source temperature of 773 K in air. The real thermoelectric application for waste heat recovery is close at hand.
Thermoelectric generation could be a revolution of the thermal engines. Namely, the present thermal engines, which were developed in 18th century, are using the pressure of the medium gas caused by heat. Thermoelectric conversion can remove such hollow by small solid devices and make possible to convert directly the low quality energy to the high quality electricity.