One week away from Election Day 2012, with national polls indicating a closely divided electorate, both presidential campaigns were forced to suspend public appearances and fund-raising efforts in anticipation of a potentially devastating storm. Making landfall in the United States on the night of October 28, Hurricane Sandy left large parts of the Northeast with widespread blackouts and flooding. In the end, the storm caused damage estimated to exceed $50 billion, making it among the largest and most costly hurricanes to hit the United States in 100 years (Plumer Reference Plumer2012). A disaster of this magnitude, so close to a presidential election, was unprecedented;Footnote 1 no one could be sure what the impact would be on voters' decision at the polls.
Nevertheless, before the storm made landfall, political commentators were eager to make a guess. No clear consensus emerged. New York Times columnist Frank Bruni ironically summarized the pundits' conjectures: Sandy could diminish the effect of last-minute advertising because people without power could not see or hear the ads; that is, if it did not make the ads more effective because people in disasters tend to consume as much media as they can. The storm could hurt the president's chances by depressing early voting and Election Day turnout; or else it could help him by giving him a chance to “look presidential” (Bruni Reference Bruni2012). Moreover, it would be difficult to tell if the storm would have any real effect at all: analyst Nate Silver argued that, with Obama's fortune having begun to rise prior to the storm, a Romney bounce seen after the first debate fading, and elections generally tending to break toward one candidate at the end of campaigns, it was hard to determine how strong an effect the storm would have, if any. The result was “overdetermined” (Silver Reference Silver2012).
The existing political science literature is only somewhat helpful in guiding these analyses. Prior work has shown that the electorate tends to punish incumbents who preside over natural disasters (Achen and Bartels Reference Achen and Bartels2004a). Yet, it has also been suggested that voters reward leaders who intervene in response to disasters (Gasper and Reeves Reference Gasper and Reeves2011; Reeves Reference Reeves2011). In this particular case, the media and the public appeared to approve of the president, auguring well for him come Election Day. It was not, however, a foregone conclusion that citizens would blame public utilities or global climate change rather than the incumbent for the extent of the damage and delays in recovery.
We use storm data provided by the Federal Emergency Management Agency (FEMA) to estimate the effect of Hurricane Sandy on President Obama's share of the popular vote. Comparing affected to unaffected areas, we find that the proportion of voters who supported the president was larger in counties affected by the storm than in those that were not affected. Of course, while storms do not have preferences for one party or another, some voters might be more likely to be affected by them than others: for instance, residents of coastal or low-lying areas that are more prone to flooding. To account for these potential biases, we use matching methods to isolate the unique effect of the storm on the 2012 election, net of additional factors such as median income, prior voting patterns, or historical weather damage.
Now, a skeptic may note that the brunt of the storm only affected a handful of states that were safely within the Obama camp. The odds of Connecticut, New York, or New Jersey defecting to Romney were quite slim. And yet, these were not the only states that were affected. In some states where the race was particularly close, the impact of the storm could have had substantive consequences for the Electoral College results. By applying our estimate of the storm's impact to the electoral outcomes in two swing states—Virginia and North Carolina—we investigate counterfactual scenarios that could reasonably have occurred had the storm taken a different path. We show that, while only some Virginia counties were affected, absent the hurricane's effect Obama would likely have lost the state. In North Carolina, another hotly contested race, we find that if all counties were affected by the storm to some degree, the state would have been won by the president rather than Romney. In other words, while the fate of the national election did not hinge on the direct impact of the storm, the advantage to Obama in affected areas was strong enough that it could have potentially swung closely divided states. In a broader sense, our results provide further evidence of the degree to which events beyond the immediate control of either candidate can drive an election's results.
STORM DAMAGE AND VOTE SHARE
It is worth first considering why a storm should affect vote choice at all. A longstanding finding in the literature indicates that voters are responsive to the actions of the incumbent and reward or punish him or her accordingly (Key Reference Key1966). In particular, voters tend to respond to bad economic times with punishment for the parties and incumbents associated with those bad times (Fiorina Reference Fiorina1981). Voters have also been shown to punish incumbents for military deaths in wartime (Karol and Miguel Reference Karol and Miguel2007) and to punish school boards for falling test scores (Berry and Howell Reference Berry and Howell2007), all of which the average voter is liable to attribute, to some degree, to the competence of political leaders. Yet, in the case of the national economy, while executives know they will be punished or rewarded based on economic performance, they have limited control over broader trends.Footnote 2 This logic of reward and punishment follows even in situations where it would be impossible to attribute any responsibility to political authorities: for example, voters have been shown to give incumbents a bump when their local college football team is winning (Healy, Malhotra, and Mo Reference Healy, Malhotra and Mo2010).Footnote 3 President Wilson appears to have been taken to task at the polls for a series of highly publicized shark attacks off the New Jersey coast that happened on his watch (Achen and Bartels Reference Achen and Bartels2004a). And there is evidence that US governors of oil-producing states are punished by voters for swings in international oil prices (Wolfers Reference Wolfers2007). So, while voters may base their decisions in the voting booth on their assessments of their collective welfare, they may attribute responsibility to their elected officials for things well above their pay grade.
The weather is one example of a phenomenon that cannot be plausibly under the control of government,Footnote 4 yet voters often appear to take this into their consideration. Achen and Bartels (Reference Achen and Bartels2004a), in a study that spans more than 100 years of data from the 48 contiguous US states, find that incumbent presidents are punished for extremes of weather, either too much or too little rain. Others find similar results (Gasper and Reeves Reference Gasper and Reeves2011). Arcenaux and Stein find that Houston residents who were more directly affected by flooding from Tropical Storm Allison were more apt to blame local government (Reference Arcenaux and Stein2006).
And yet, while political leaders are not responsible for the weather per se they are expected to act in its aftermath. In this light, the response to disaster represents an opportunity for citizens to observe the competence of their elected officials as orchestrators of relief. Gasper and Reeves (Reference Gasper and Reeves2011) find that damage from natural disaster is negatively associated with an incumbent governor's vote share in a given county, but they also show that the governor is rewarded for granting disaster declarations. Healy and Malhotra (Reference Healy and Malhotra2010) also find that the main effect of tornado damage in a county is to diminish the incumbent party's vote share in a presidential election, but the effect is contingent on whether a disaster declaration is made. There is no significant relationship between tornado damage and incumbent vote share in those counties where a disaster declaration was made, but a negative relationship is found when no declaration is made. The authors take this as an indication that those affected by a storm are willing to accept damage that is beyond officials' control, provided the government has taken at least some action to intervene. Yet, in a separate study, the same authors find that the reward to incumbents for their intervention may not be strictly related to competent governance: incumbents are rewarded for postdisaster spending but not for preparedness spending (Healy and Malhotra Reference Healy and Malhotra2009). The authors find, specifically, that preparedness spending does not translate to an incumbent's vote share, only postdisaster relief that comes as direct transfer payments to the individual affected benefit the incumbent. Clearly, the voters have a preference for a “pound of cure” in lieu of an “ounce of prevention,” and only when the check is made out directly to the individual. So while there is conflicting evidence about whether voters respond negatively to storm damage per se, they are sensitive to intervention by government following disaster. However, this may not be only because of the authorities' competent handling of the situation, but rather because a disaster provides the opportunity for voters to reap immediate, tangible, and excludable benefits directly from these authorities.
The effect of the storm is difficult to predict, in part, because catastrophic storms such as Sandy are relatively rare, and in such rare events it can be difficult to distinguish idiosyncratic features from broader trends. As Achen and Bartels (Reference Achen and Bartels2004a) point out, the prevailing narrative surrounding a given incident matters a great deal for its electoral outcome. This narrative tends to vary by case. For example, in a study of attributions of blame for Hurricane Katrina, Malhotra and Kuo (Reference Malhotra and Kuo2008) find that partisans are more inclined to blame officials in the opposite party for disaster. However, this is in the context of one of the most catastrophic storms in history, in which aging infrastructure built specifically to mitigate flooding failed and in which there was a widespread sense that this failure led back to one political leader or another. In the case of Katrina, the question was not whether to blame officials, but rather which ones. Arcenaux and Stein (Reference Arcenaux and Stein2006) find that, after Tropical Storm Allison caused widespread flooding, residents in the Houston area largely blamed the local government and the state or federal officials almost not at all. Again, this reaction was due to perceived failures in flood management policy set by the county. In this case, those with more information were more likely to correctly identify the county as the body that was responsible for floodplain management (as opposed to the City of Houston), but in this case as well, there was a consensus that someone was responsible.
In the case of Sandy, despite widespread damage to one of the most populous metropolitan areas in the United States, the public appeared to be satisfied with the federal government's handling of disaster recovery. By all accounts, the public's assessment of the disaster response was highly positive at all levels of government. In polls during or directly after the storm, broad majorities gave positive ratings to President Obama, FEMA, or “the federal government” in their handling of the crisis (e.g., ABC News/Washington Post 2012). In a poll of registered New York State voters roughly a month after the storm, a majority gave a positive rating to the handling of the disaster by president Barack Obama, governor Andrew Cuomo, New York City mayor Michael Bloomberg, and FEMA (Siena 2012). In roughly the same period, 85% of New Jersey residents gave governor Chris Christie an A or B letter grade for his handling of the storm (Monmouth 2012). The only people or institutions to receive criticism were the power utilities. Nearly a third of New Yorkers lost power for more than a week. Long Island's utility, in particular, received blame, leading to high-level resignations shortly afterward (Herbert and Harrington Reference Herbert and Harrington2012). Although previous research suggests that natural disasters can often hurt incumbents, we believe that Sandy was different. Because of the positive narrative surrounding Obama's handling of the storm as well the government's swiftness in providing assistance for disaster-ravaged areas, Sandy, as the 2012 election's October surprise, should have given Obama a greater proportion of the vote than he otherwise would have received. In the following sections, we subject this proposition to empirical examination.
DATA AND METHODS
This study examines Sandy's effect on President Obama's vote share during the 2012 presidential election. Specifically, we are interested in the electoral impact of the storm passing through a given area. Using data provided by FEMA, we construct a dummy variable that denotes whether a given county was affected by Sandy.Footnote 5 In this case, an area is affected by Sandy if and only if FEMA documented Sandy's impact on that area. This allows us to group areas into affected and unaffected areas. Data for the 2012 election are taken from Dave Leip's Atlas of United States Presidential Elections (Leip Reference Leip2012). We measure Obama vote share as the percentage of the total vote President Obama received in a given county.
In this study we assume that being affected by the storm is “as-if” random and thus the storm can be viewed as a natural experiment.Footnote 6 We assume this for two reasons. First, because the weather is independent of the political system, we can safely rule out the existence of a third variable that affects both the storm and Obama's general election vote share. The weather has no preference about the people it affects, and thus, being affected by the storm can be considered as independent of individual and aggregate-level characteristics. Second, individuals or groups could not have self-selected into being a part of the affected group. People in many of the areas that Sandy hit had never experienced a storm of such magnitude and so they would not have changed their behavior in anticipation of a storm like Sandy. One can make a credible argument that individuals residing in hurricane-prone areas differ from those who do not, and thus, the assumption of randomly being affected by the storm is untenable; however, many of the areas that were affected were far from hurricane-prone. As a Baltimore Sun reporter remarked, Sandy was a “once-in-a lifetime” storm (Wenger Reference Wenger2012).
Whereas we assume that being affected by Sandy is “as-if” random, randomization is not sufficient to generate comparable “treatment” and control groups (Sekhon Reference Sekhon2009). Even in controlled experiments, imbalances between treatment and control groups on relevant variables can emerge because randomization only ensures balance on average (Moore Reference Moore2012). Although we consider treatment assignment to be “as-if” random, we do find lack of balance in our sample. Specifically, the areas that were affected by Sandy also happened to be areas that favored Obama during the 2008 election. In 2008, then-candidate Obama received roughly 48% of the vote in Sandy-affected areas, as opposed to 40% in unaffected areas. This lack of balance poses a threat to inference by making it difficult to separate the actual effect of Sandy from preexisting differences between those areas that happened to get hit by the storm and those that did not.
To address this problem, we use matching methods to ensure that affected and unaffected areas are comparable on a range of relevant variables. Matching is a nonparametric method that improves balance between groups prior to the estimation of treatment effects by minimizing differences between treatment and control groups in terms of pretreatment variables (see Sekhon Reference Sekhon2009 and Ho et al. Reference Ho, Imai, King and Stuart2007 for reviews of the method). Essentially, it is a method of holding variables constant—to borrow the language of ordinary least squares (OLS) regression—but unlike OLS, matching does not make any assumptions about how variables are distributed. After implementing the matching procedure, the analyst is left with comparable groups that mostly differ in terms of whether they were treated or not. If all relevant pretreatment variables are matched on, then unbiased estimates of treatment effects can be determined by calculating a simple difference of means.Footnote 7
In this study, we use genetic matching to preprocess our data (see Sekhon Reference Sekhon2009 for a detailed description of the estimator and its desirable properties).Footnote 8 Genetic matching uses a genetic algorithm to maximize covariate balance as much as possible given the data. Its objective is to find the optimal set of matches that minimizes differences between treated (affected counties) and control cases (unaffected counties) with regard to observed pretreatment variables, thus ensuring that differences between groups are mostly due to the “treatment” (i.e., Sandy). This approach has been applied recently to much notable political science research (Boyd, Epstein, and Martin Reference Boyd, Epstein and Martin2010; Hopkins Reference Hopkins2010; Ladd and Lenz Reference Ladd and Lenz2009). We implement the technique within the R package MatchIt (Ho et al. Reference Ho, Imai, King and Stuart2007). As described earlier, affected and unaffected areas are unbalanced with regard to lagged vote share. Therefore, we match on this variable. In addition to lagged vote share, we match on historical weather damage, median income, percent white, percent black, percent Hispanic, median age, gender, percent with a college degree, population density, median gross rent, unemployment, and lagged turnout. All of these covariates are measured at the county level. Historical weather damage data are taken from the Spatial Hazards Events Losses Database for the United States (SHELDUS). This variable is measured as the logged average level of property damage from 1960 to 2011 as a result of storm surge.Footnote 9 Unemployment is measured as the county-level civilian unemployment rate during the month preceding the election. These data are obtained from the Bureau of Labor Statistics (BLS). All other data are either taken from the 2010 Decennial Census or 2010 American Community Survey (ACS).
We begin our analyses by examining the unadjusted effect of Sandy on Obama vote share. Then, to achieve greater balance, we preprocess our data using genetic matching and reestimate the Sandy effect within the matched sample. To illustrate the importance of the Sandy effect on the election, we simulate outcomes in two swing states—North Carolina and Virginia—and estimate how Sandy's presence (or absence) in these areas might have altered the electoral map from what was actually observed after Election Day.
RESULTS
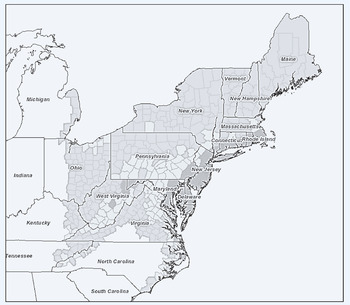
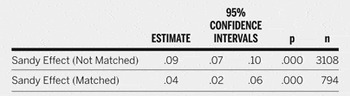
Sandy passed through approximately 500 counties during its nearly week-long course up the East Coast. As seen in figure 1, its reach extended from the North Carolina coast to parts of Michigan and Ohio. According to assessments made by FEMA's modeling task force (MOTF) (modeling and risk analysis experts who produce damage estimates for natural disasters) Sandy had its greatest impact on New York, New Jersey, Pennsylvania, and Connecticut. How did these affected areas, along with others, react to the storm? Did feelings of frustration motivate voters to punish the incumbent, or was he rewarded at the polls for his handling of the situation? The results in table 1 give us an indication of how affected areas like these reacted to the storm.
Map of Areas Affected by Sandy
Colored areas denote affected areas. Areas with low, medium, and high Sandy impact scores are gray, light gray, and dark gray, respectively. Note: Data were obtained from the FEMA Modeling Taskforce (MOTF) and plotted using the ArcGIS Javascript API.

The Effect of Sandy on County-Level Obama Vote Share

Note: Estimate is the difference in mean Obama vote share for affected versus unaffected areas. Estimate for the matched sample is computed after using Genetic Matching (Sekhon Reference Sekhon2009). Confidence intervals are calculated using Hodges-Lehmann interval estimation.
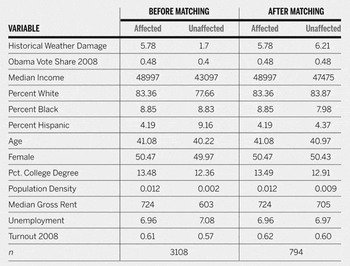
Paying no attention to balance, President Obama did substantially better in affected areas, receiving about nine percentage points more than in unaffected areas. This effect means little however, because many of the affected areas were already likely to go to Obama. As seen in table 2, Sandy produced comparable groups on a range of key variables. This gives additional credence to our argument that Sandy can be considered “as-if” random. However, there are noticeable imbalances between affected and unaffected areas in terms of historical weather damage, Hispanic composition, and lagged vote share. Matching addresses this issue by providing better balance between the affected and unaffected areas. Matching on variables such as lagged vote share, historical weather damage, and several demographic variables, we find that President Obama received about a 4% increase, plus or minus two percentage points,Footnote 10 in vote share from Sandy.
Balance Before and After Matching

Note: Entries are means for each group.
Although the storm's effect was limited to only some states, some of these states are elevated to particular importance by their weight in the Electoral College. Our data are at the county level, thus an analysis at the state level is necessary to determine whether this effect would have been consequential. Obama and Romney's margins of victory in some of these states were well within this range. To examine how Sandy might have affected the ultimate Electoral College outcome, we estimate counterfactuals for two important swing states: North Carolina and Virginia. These simulations are important because we can aggregate from a unit of analysis that is not electorally consequential to one that can determine the fate of a campaign. Although Obama won other swing states by a comfortable margin, an October surprise coupled with the absence or presence of Sandy might have led to a different outcome on Election Day.
COUNTERFACTUAL ANALYSES
North Carolina
Although some storm projection maps had Sandy passing through parts of North Carolina, the storm barely grazed the state as it made its way north to New York. North Carolina was considered to be a toss-up state, with preelection polls suggesting a knife-edge Romney victory. In their preelection poll conducted on November 3, Public Policy Polling (PPP) found both candidates to be tied among likely voters (Jensen Reference Jensen2012a). To determine what would have happened if Sandy had veered in the direction of North Carolina, we conduct a counterfactual analysis, simulating 10,000 elections in which Sandy passes through the entire state.
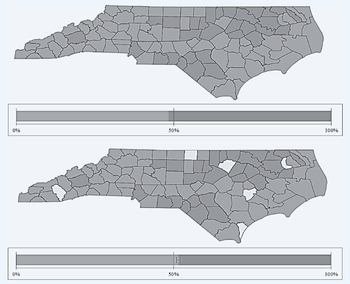
For each unaffected county within each simulation, a random draw from a normal distribution with parameters μ equal to .042 and σ equal to .009 is taken and added to the actual vote share. After every trial of the simulation, Obama's total vote share in the state is computed. At the end of the simulation, the average county- and state-level vote share across simulations is taken. As displayed in the bottom portion of figure 2, the effect of Sandy passing through North Carolina would have given Obama a slight edge over Romney. Across simulations, the mean vote share for President Obama in North Carolina is 52.1% ± .3%. This suggests that if Sandy would have swung in the direction of North Carolina, Obama would have gained 15 Electoral College votes; augmenting Obama's victory on Election Day.
2012 Election Results in North Carolina
Top panel shows the actual 2012 election results for each county in North Carolina. Counties depicted in light gray were won by Mitt Romney, those depicted in dark gray were won by Barack Obama. The bottom panel displays the simulation results. White colored counties are those counties that would have gone to Barack Obama had Sandy affected them. The two bar plots below each map depict the total state-level vote share for each candidate. Error bars are 95% CI. Quantum GIS 7.0 was used to produce the maps, while Excel 2010 was used to produce the accompanying bar plots.

Although most parts of North Carolina escaped Sandy's impact, the storm plowed through another swing state—Virginia—and devastated some of its coastline. Polls conducted in mid-October by various firms showed a dead heat in the state, with Romney enjoying a slight advantage (Politico 2012). However, the candidate's fate started changing toward the end of October. In the week of October 31—the week that Sandy hit the East Coast—several polls began showing a noticeable increase in support for Obama (Politico 2012). Interestingly, a PPP poll conducted as the storm made landfall showed Obama with a 3% lead over Romney (Jensen Reference Jensen2012b).
Virginia
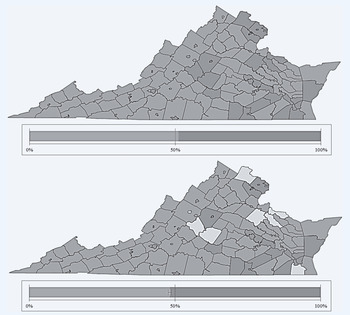
To examine what would have happened if Sandy had not hit Virginia, we conduct another counterfactual analysis to estimate the “absence of Sandy” effect. We follow many of the same simulation procedures we used for North Carolina, except we take a random draw from a normal distribution with parameters μ equal to .042 and σ equal to .009 and subtract this number from affected areas' vote share. The average outcomes for these simulations are displayed in figure 3. As can be seen, removing the Sandy effect from affected areas gives Romney a slight edge over Obama. The mean vote share for Obama across simulations is 47.4% ± .3%. Thus, without Sandy's help, our simulation results suggest that Obama might have lost 13 electoral votes in the “Mother of States.”
2012 Election Results in Virginia
Top panel shows the actual 2012 election results for each county in Virginia. Counties depicted in dark gray were won by Mitt Romney, those depicted in light gray were won by Barack Obama. The bottom panel displays the simulation results. White colored counties are those counties that would have gone to Mitt Romney had Sandy affected them. The two bar plots below each map depict the total state-level vote share for each candidate. Error bars are 95% CI. Quantum GIS 7.0 was used to produce the maps, while Excel 2010 was used to produce the accompanying bar plots.

Taken together, the primary analysis and simulation results suggest that the Sandy effect was consequential, but not enough to have tipped the election in Romney's favor. Even if Florida had gone to Romney and Sandy happened to miss all of Virginia and North Carolina, Romney would still have had to win another swing state. Given the trajectory of the storm, we do not know of any way that Sandy (or its absence) could have reversed the outcome of the 2012 election.Footnote 11
DISCUSSION
Based on our analyses, we conclude that Hurricane Sandy had a net positive effect on President Obama's share of the vote in the 2012 general election relative to areas that were not affected. In the grand scheme of electoral campaigns, the average effect is sizeable: roughly four percentage points. We illustrate the substantive consequences of this effect with simulations showing that, absent the effect of Sandy, Obama would have lost Virginia to Romney and, had it been affected across its entire area, North Carolina would have gone to Obama. This is surprising because existing research suggests that the main effect of a violent storm is expected to be negative (Achen and Bartels Reference Achen and Bartels2004a). In light of polling evidence that the American public looked favorably on the role various government institutions played in the disaster recovery both in areas directly affected by the storm and in the United States overall—it makes sense that the electoral response itself would not be negative. It is not clear, in this case, why the narrative of this storm was so positive.
We observe a net positive effect of the storm on Obama's general election vote share, but several possible causal mechanisms for this effect exist that we cannot address in our data, although some are more likely than others. First, bad weather should have a negative impact on turnout on Election Day (Gomez, Hansford, and Krause Reference Gomez, Hansford and Krause2007). Even though the skies had largely cleared in the northeast by Election Day, insofar as turnout is the result of weighing the benefit of voting against its costs (Downs Reference Downs1957; Riker and Ordeshook Reference Riker and Ordeshook1968), any additional cost should depress turnout. For many voters in areas hit by the storm, these costs came in the form of large-scale failures of transit systems, damage to roads, and personal displacement far from their electoral districts. In many cases, polling places were unable open, likely resulting in higher levels of confusion as voters were directed to alternate locations. And yet, if one of the effects of the storm was to decrease turnout, this should have had an asymmetrical impact: Republicans tend to benefit from lower turnout (Gomez, Hansford, and Krause Reference Gomez, Hansford and Krause2007). If this was the case, that would suggest—as we observed a net increase in vote share in affected counties—that ours is an underestimate of the causal effect of the storm.Footnote 12
A second plausible mediator is the effect of diversion of the public's attention. As Mississippi governor Haley Barbour said after Romney's defeat, “Any day in a campaign that wasn't about the economy or jobs was a good day for Obama” (Memoli Reference Memoli2012). Certainly shifts in the public's attention to one issue over another can cause people to judge institutions and leaders differently than they otherwise would (Iyengar and Kinder Reference Iyengar and Kinder1987). Attention to the storm crowded out attention to the campaign, and while news about the campaign and the storm were largely reported separately, President Obama was highly visible and widely mentioned in the press in his role as the head of the federal government's disaster relief effort while Romney had no similar role to play (Pew 2012). Given that public opinion about the storm was generally positive and prevalent, Obama likely benefited not only from the apparent absence of his opponent and the lack of direct challenges to his record, but he also probably benefited from greater attention to an issue that was a net positive for him.
Moreover, as exemplified by the notable response of Republican governor of New Jersey Chris Christie's “embrace” of the president, normal politics can be disrupted in a crisis whereby the exigencies of disaster relief may momentarily trump partisanship (or at least it may be expedient for officials to behave as if this is the case). Christie told Fox News host Steve Doocy in response to whether he would receive Governor Romney to tour disaster sites after he had done so with the president, “If you think right now that I give a damn about presidential politics then you don't know me” (Fox News 2012). Comedy news commentary program The Daily Show aired a segment (unironically) titled “A Daily Show Tribute to Institutional Competence” in which the host explicitly credited a lack of “partisan gamesmanship” for the seemingly uncanny ability of government agents at all levels to respond to the storm as they should (Daily Show 2012).
The above notwithstanding, these media effects likely affected the nation as a whole. In this study, the objective is to estimate the unique causal effect of the storm by comparing those areas where the storm was present with those areas where it was not. Assuming the media environment was similar in one area compared to another, this diversion likely occurred uniformly across the nation. However, perhaps local news outlets in areas more strongly affected by the hurricane covered it more heavily resulting in a stronger diversion effect. Also, during a crisis when individuals are more anxious or fearful, they tend to pay greater attention to relevant political phenomena (Marcus and Mackuen Reference Marcus and Mackuen1993). Perhaps those individuals in affected areas not only received different news coverage, but were exposed to more of it. This question cannot be addressed by our data, but it would be a worthwhile avenue for further research.
And while there are many other plausible mediators of the effect we observe, a third major mechanism may be the one implied by much of the prior literature: the active intervention of the government. Some previous work (Chen Reference Chen2013; Healy and Malhotra Reference Healy and Malhotra2009) stresses that part of the electoral benefit of a disaster is that it provides an opportunity for governments to dispense pork to their favored constituents. Whether or not citizens otherwise observe the signs of competence from their government in response to a disaster, a check in the mail may go a long way to winning their support. In this case, however, this was not likely as large a factor as it would have been had the storm hit earlier. Given the short time from the hurricane making landfall to Election Day, citizens would have had less time to apply, be approved, and receive individual grants from FEMA. Still, some grant money was disbursed, and individuals certainly received direct services from government agencies.
Obviously government agencies are highly visible during disasters in a way that they are not at other times. Citizens receive frequent advisories from local authorities; they may seek help from first responders or disaster relief agencies; or they may simply see them on the news in a helping capacity. Salient events can have a profound effect on support for government generally, and specific officials in particular, in part because some aspects of government become more salient than others. During international security crisis, individuals tend to associate “government” and its leaders with the military, whereas at other times the idea of “government” conjures up more divisive social welfare policies, taxation, bureaucracy, partisan gridlock, and so on, and their trust in government changes accordingly (Hetherington and Husser Reference Hetherington and Husser2012). Indeed, after the storm, candidate Romney needed to backpedal on earlier statements he had made about returning the functions of FEMA to the states (Mehta and Hennessey Reference Mehta and Hennessey2012) while support for the federal government's emergency response was high (ABC News/Washington Post 2012). In short, by seeing government agencies in action and otherwise displaying competence, citizens might attribute this competence to the incumbent president's administration, or generally associate it with his office. Future research should investigate the potential causal mechanisms of this storm to determine the unique contribution of these factors to the effect that we estimate.
If nothing else, this study reminds us of the degree to which the outcome of electoral contests can be the result of unanticipated events beyond the control of either campaign. For Governor Romney, the storm presented him with a situation in which he had little visibility and was unable to forcefully make his case in the week leading up to the election. As for Obama, Sandy gave him an opportunity to showcase his role as leader of a competent federal administration that was capable of providing crucial services to a public in need. Insofar as voters weigh recent information more heavily than evidence from the past (Achen and Bartels Reference Achen and Bartels2004b), this can alter the result of a close election. Whereas election results are the outcome of any number of factors, and the storm was unlikely to change the ultimate result at the national level, these events do have the power to change voting behavior in meaningful ways.
ACKNOWLEDGMENTS
The authors thank those who offered comments on earlier versions of this article, including Matthew Lebo and participants in the Stony Brook political science graduate students' colloquium. Thanks as well to those who helped sourcing the data for this study: Hannah Vick and Douglas Bausch of FEMA. Our thanks also to the anonymous reviewers for their suggestions and consideration.
APPENDIX
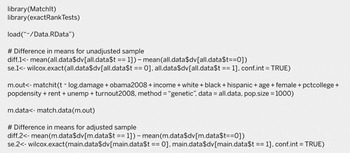
R Code for Main Analyses

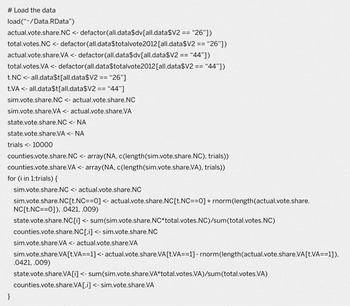
R Code for Simulations

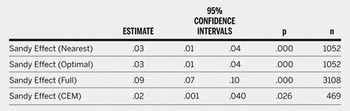
The Effect of Sandy on County-Level Obama Vote Share using Moderate to Very High Damage as the Treatment Indicator

Table A4 : The Effect of Sandy on County-Level Obama Vote Share