




No CrossRef data available.
Article contents
Decreased corpus callosum size in sickle cell disease: Relationship with cerebral infarcts and cognitive functioning
Published online by Cambridge University Press: 23 January 2006
Abstract
We assessed midsagittal corpus callosum size in sickle cell disease (SCD) and its relationship to lesion volume, lesion location, and cognitive functioning. Twenty-eight children with SCD and 16 demographic controls completed magnetic resonance imaging (MRI) and neuropsychological testing. Corpus callosum (CC) size was smaller for children with silent infarcts (n = 8) or overt stroke (n = 8) than for those without visible infarcts (n = 12) or control participants. Lesion volume was a robust predictor of IQ and other cognitive scores; total CC size did not typically add explanatory power for these measures. The size of the rostral body of the CC, however, independently predicted measures of distractibility, speeded production, and working memory. Posterior CC size was also decreased among many of the children with SCD, even in the absence of visible infarcts in this region. Brain morphology appears to provide additional information about SCD-related effects on the brain above and beyond visible infarcts. (JINS, 2006, 12, 24–33.)
Keywords
Information
- Type
- Research Article
- Information
- Journal of the International Neuropsychological Society , Volume 12 , Issue 1 , January 2006 , pp. 24 - 33
- Copyright
- © 2006 The International Neuropsychological Society
INTRODUCTION
Cerebral vascular disease during childhood is a relatively rare phenomenon, however, in certain childhood conditions cerebral vascular disease occurs at a high rate (Pavlakis et al., 1991; Earley et al., 1998). One such condition is sickle cell disease (SCD), which refers to a group of genetically inherited hemoglobinopathies. The most prevalent form of SCD is hemoglobin type SS (HbSS) in which the person inherits the sickle cell trait for type S hemoglobin from both parents; this subtype is also associated with the highest risk of stroke (Pavlakis et al., 1989). In SCD, overt strokes have been estimated to occur in approximately 5% of children by age 12 and approximately 7% of children before the age of 15 years (Armstrong et al., 1996; Bernaudin et al., 2000). At least an additional 12–15% of children with HbSS in this age range may have silent cerebral infarcts, which are focal regions of cerebral vascular injury evident on neuroimaging exams in children with no history of stroke (Armstrong et al., 1996; Bernaudin et al., 2000). The pathophysiology of stroke in SCD has indicated that overt stroke frequently involves both small and large vessel disease (Pavlakis et al., 1989; Adams et al., 2001). Arterial border-zone regions and tissue supplied by middle cerebral artery branches are frequently affected, resulting in watershed cortical infarcts, deep white matter lesions, and basal ganglia infarcts. Silent cerebral infarcts typically result in less tissue injury than overt strokes, and occur more often in deep white matter than in the cortex (Moser et al., 1996).
Studies of the neuropsychological effects of cerebral infarction in SCD have demonstrated deficits in Full Scale IQ, Verbal IQ, and Performance IQ, as well as measures of more specific neuropsychological functions such as fine motor control, attention and mental control, memory skills, and executive functions (Cohen et al., 1994; Armstrong et al., 1996; DeBaun et al., 1998; Watkins et al., 1998; Bernaudin et al., 2000; Brown et al., 2000). Studies of silent cerebral infarcts typically have shown neuropsychological effects that are similar but less severe than for overt stroke (Armstrong et al., 1996; Bernaudin et al., 2000; Brown et al., 2000; DeBaun et al., 1998; Watkins et al., 1998). Studies that have examined the impact of focal frontal or frontal-subcortical infarcts in both silent cerebral infarcts and overt stroke have shown an association with poorer selective and sustained attention (Craft et al., 1993; Schatz et al., 1999) and executive functions (Craft et al., 1993; Schatz et al., 1999; Watkins et al., 1998; Brown et al., 2000; White et al., 2000). The cognitive effects of lesions restricted to posterior brain regions have not been well described in the SCD literature to date, though injury to both anterior and posterior regions results in deficits in visuospatial skills not seen with anterior injury alone (Craft et al., 1993; Schatz et al., 1999). The volume of injured tissue evident on MRI exams has also shown large correlations with Full Scale IQ, language ability, and visuospatial ability suggesting that both location and volume of injury need to be considered in understanding the lesion effects (Schatz et al., 1999, 2002).
Brain morphology may provide additional information about cognitive functions beyond visible tissue injury. Chronic lesions are frequently associated with atrophy, and the volume of hyperintense tissue on MRI may therefore underestimate the extent of the lesion (Ganesan et al., 1999). The purpose of the present study was to investigate the relationship between cerebral vascular disease, quantitative MRI measurements, and cognitive functioning in SCD. Three issues were investigated. First, corpus callosum (CC) morphology was assessed in children with SCD and no infarcts as compared to those with silent infarcts, overt stroke, or demographic controls without SCD. Second, the functional impact of tissue loss and visible injury was examined by assessing the CC and lesion size on MRI scans as independent predictors of cognitive functioning. Third, the relationship between injury along the anterior-posterior axis and cognitive abilities was examined by assessing regional CC morphology.
The CC is the largest white matter pathway between the two hemispheres. The midsagittal area of the CC not only provides a reliable estimate of total CC size, but also is related to total forebrain tissue volume in humans (Jäncke et al., 1997; Tramo et al., 1998). There are potential concerns with using automated tissue segmentation routines in children with SCD due to alterations in the T1 value of gray matter. In school age children with SCD, T1 in gray matter tends to be reduced, which could result in the underestimation of gray matter volumes (Steen et al., 1998, 1999). Midsagittal CC area may be a useful measure that would reflect both injury-related degeneration of axons (and therefore correlate with the extent of visible tissue injury) and differences in normal appearing tissue volume.
The CC also has a specific anterior-posterior organization as demonstrated in both humans and nonhuman primates (de Lacoste et al., 1985; Pandya & Seltzer, 1986; Yu-ling et al., 1991; Moses et al., 2000). The anterior-most portion of the structure (rostrum and genu) contains axons from prefrontal regions, including orbital frontal and inferior premotor pathways. The anterior portion of the body of the CC contains connections between more posterior portions of the frontal region including the middle and superior frontal gyrus. The middle portion of the body contains axons from primary motor and sensory cortex. The posterior portion of the body contains axons from parietal and superior temporal cortex, as well as those from the inferior temporal and parahippocampal gyrus. The most posterior portion of the CC (splenium) primarily contains axons from occipital cortex, but inferior temporal, parahippocampal, and posterior parietal axons may also be partially represented in the border area between the splenium and the posterior body (Moses et al., 2000). Therefore, the examination of regional CC area may provide a useful measure of changes in tissue volume across the anterior-posterior axis.
There were three specific hypotheses for the current study. First, we predicted that smaller midsagittal CC area would be related to lower general cognitive functioning (IQ) after controlling for the total amount of visible tissue injury. Second, we predicted smaller anterior CC regions would be related to poorer performance on measures of attention and executive skills after controlling for the total amount of visible tissue injury. Finally, we expected that a smaller size of posterior CC regions would be related to poorer performance on measures of visual-spatial processing after controlling for the total amount of visible tissue injury.
METHODS
Research Participants and Recruitment
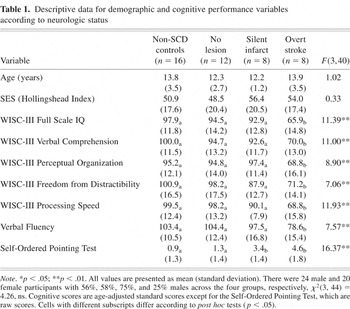
Twenty-eight children with hemoglobin SS subtype of SCD participated in the study. Sixteen healthy comparison children participated who were similar in age, gender ratio, and socioeconomic status (SES) to the SCD participants (see Table 1). All participants identified themselves as being Black/African-American on a demographic questionnaire that contained race and ethnicity categories from the United States Census 2000 (U.S. Census Bureau, 2002). Participants with SCD were children at a large pediatric hematology clinic who had previously volunteered for research studies that included MRI exams and neuropsychological testing. The comparison group was recruited from the same local metro area through flyers distributed at public schools. Parents of all participants signed informed consent for research and children provided assent. Eight of the participants had a clinical history of stroke; the remainder of the participants had no history of stroke according to medical records or parent report. Descriptive data are provided in Table 1.
Descriptive data for demographic and cognitive performance variables according to neurologic status

Cognitive Testing
Participants were administered cognitive testing in one session with a trained examiner that typically lasted 90–120 minutes. Testing included the Wechsler Intelligence Scale for Children, 3rd edition (WISC-III; Wechsler, 1991); the letter fluency condition of the Verbal Fluency Test (Delis et al., 2001); and the Self-Ordered Pointing Test (SOPT; Petrides & Milner, 1982; Spreen & Strauss, 1998). All children reported feeling well on the day of testing and parents denied any acute effects of illness in their child that day. The measures of attention and executive skills selected for the study were the Freedom from Distractibility factor from the Wechsler scale, the Verbal Fluency Test, and the SOPT. The measure of visual-spatial processing selected was the Wechsler scale's Perceptual Organization factor. Age-adjusted standard scores were computed for each measure except for the SOPT. The SOPT was the only test that was not a commercially available, norm-referenced test. The measure assesses working memory, organizational strategy, and response monitoring; it has been shown to be dependent on intact prefrontal cortex and basal ganglia circuits (Petrides & Milner, 1982; Spreen & Strauss, 1998). The SOPT used for this study consisted of three stimulus sets with each set administered twice in succession. The sets consisted of 6 line drawings of common objects, 8 colored squares each approximately 3 cm in height and width, and 10 squares each approximately 3 cm in height and width filled with a unique pattern of lines and/or dots. Instructions were provided to select each item in the stimulus set only once during a series of trials. Item location on the page of stimuli changed with each trial. Instructions were repeated with additional demonstration if any errors were made during the first series of trials. The total number of errors (i.e., selecting a previously chosen item within a series of trials) was the variable of interest (possible scores of 0 to 60).
Magnetic Resonance Imaging
All participants completed a thin slice T1-weighted volumetric MRI scan obtained in the sagittal plane. SCD participants also received a T2-weighted axial sequence. Nineteen of the participants (13 with SCD, 6 controls) completed magnetization prepared rapid acquisition gradient echo (MPRAGE) imaging in the sagittal plane with 1.25 mm contiguous slices on a 1.5 tesla Siemens scanner (TE/TR = 7/12). Clinical imaging for these participants consisted of 5 mm thick slices with a 2 mm gap (TE/TR = 93/3500). Twenty-five participants (15 with SCD, 10 controls) completed radio frequency spoiled incoherent gradient echo (SPGR) imaging with 1.25 mm contiguous slices in the sagittal plane on a 1.5 tesla GE scanner (TE/TR = 6/22). T2-weighted imaging for these participants consisted of 3 mm thick slices collected in an interleaved manner to provide contiguous slices (TE/TR = 98/3567).
Cerebral vascular lesions were defined as hyperintense regions of tissue 3 mm in diameter or greater evident on T2-weighted MRI exams. All lesions were corroborated as cerebral infarcts by a neuroradiologist. The location of each lesion was recorded according to standard anatomical maps. Eight of the participants with a normal neurologic history had cerebral vascular lesions evident on MRI exams (silent cerebral infarcts). Two of these silent infarct cases had unilateral punctate lesions in the head of the caudate nucleus (one case in left hemisphere, one case in right hemisphere), two cases had bilateral white matter lesions in frontal regions, one case had unilateral lesions in both left frontal cortex and the underlying white matter, one case had bilateral lesions in both frontal cortical regions and underlying white matter, one case had a bilateral lesion in the frontal cortical region along with white matter lesions in both frontal and parietal regions, and one case had bilateral white matter lesions in the posterior portion of the centrum semiovale.
Quantitative MRI Measurements
Lesion quantification was conducted as described previously (Schatz et al., 2002). T2-weighted images were viewed as 16-bit images and areas of hyperintense tissue were outlined and measured using NIH v.1.63 software (Rasband, 2002). Two raters independently measured lesion area on each MRI image twice in separate sessions. Average area measurements across all ratings were summed for each participant and multiplied by slice thickness plus the gap to create a volume measurement. Participants with SCD who had no visible lesions were assigned lesion volume scores of zero for the purpose of the regression analyses described later.
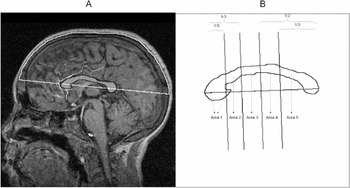
Head size and CC measurements were completed by two raters with each rater completing measurements three times. The midsagittal slice for each participant was identified on T1-weighted volumetric scans by identifying the slice with the maximal view of the CC and the cerebral aqueduct. If head tilt was evident, volumetric scans were rotated using MRIcro software v.1.32 to provide a more accurate representation of the CC (Rorden, 2000). A straight line was drawn between the anterior and posterior limits of the CC using NIH Image v.1.63 software (Rasband, 2002). This line was extended to the inner limits of the skull to measure the intracranial length and vault (see Figure 1, panel a). Scans were then resliced into a transverse view in the plane of the intracranial length line. From the midpoint of the intracranial length line a perpendicular line was drawn to the left and right inner limits of the skull to measure intracranial width. Intracranial vault area was multiplied by intracranial width as an index of head size.

A midsagittal slice is shown in panel A with the intracranial vault region outlined in white and the corpus callosum outlined in black. In panel B a tracing of the corpus callosum is shown with regions of interest demarcated.
The CC was manually outlined on the midsagittal slice of T1-weighted volumetric scans using a mouse. The method for subdividing the CC was adapted from Witelson (1989). The line between the anterior and posterior limits of the CC was used as a linear axis for subdivisions (see Figure 1, panel b). Perpendicular lines were drawn from the anterior CC at one-fifth and one-third the distance of the CC length, and from the posterior CC at one-third and one-half the distance of the CC length. The five sections roughly corresponded to the rostrum and genu (region 1), rostral body (region 2), anterior midbody (region 3), posterior midbody (region 4), isthmus, and splenium (region 5). Age-adjusted scores for the total CC area were computed based on the regression formula: CC area = (age * 12.2) + 515, as reported by Giedd (Rajapaske, Giedd, et al., 1996). Among participants without cerebral infarcts the predicted CC area correlated r = .77 with observed CC area using a Spearman rank-order correlation.
Inter- and intrarater reliabilities were assessed for the quantitative MRI measurements via Spearman rank order correlation coefficients. Inter- and intrarater reliability for lesion volume were r = .78–.80 and .82–.84, respectively. For head size inter- and intrarater reliability were r = .99 and r = .98–.99, respectively. Total CC area demonstrated inter- and intrarater reliability of r = .96–.99 and r = .95–.97, respectively. Regional CC areas demonstrated inter- and intrarater reliability of r = .90–.99 (median = .97) and r = .83–.97 (median = .92), respectively. There was no difference in mean CC area between the two MRI protocols (596.6 mm2 vs. 567.7 mm2), F(1,41) = 0.80, ns.
Statistical Methods
For descriptive purposes demographic, neuropsychological, and MRI variables were compared among the subgroups of participants with one-way analysis of variance (ANOVA). Univariate rank order correlations between study variables were also examined for descriptive purposes for SCD participants only and for all study participants.
For Hypothesis 1, hierarchical multiple regression was used to predict Full Scale IQ from total lesion volume, age, and head size for the SCD participants in step 1. In step 2, total CC area was entered to determine if this measure accounted for additional unique variance. The alpha level was set at .05. As exploratory analyses parallel regression models were run for other neuropsychological measures with a more conservative alpha level of .01 was used to interpret the analyses because they were exploratory.
For Hypothesis 2, three hierarchical multiple regression procedures were conducted for the SCD participants, one for each of the attention or executive skill measures. In step 1, each variable was predicted from total lesion volume, head size, and age. In the second step, CC areas for region 1 and 2 were added to the model to determine the incremental explanatory power of anterior CC size. The alpha level was set at .05.
For Hypothesis 3, a hierarchical multiple regression procedure was run for the SCD participants. In step 1, WISC-III Perceptual Organization factor scores were predicted from total lesion volume, head size, and age. In the second step, CC areas for region 5 were added to the model to determine the incremental explanatory power of posterior CC size. The alpha level was set at .05.
RESULTS
The data for demographic and cognitive scores are shown in Table 1. Group differences were evident for all cognitive variables. Post hoc tests indicated the stroke group performed worse than the SCD with no lesion group and non-SCD comparison group for all cognitive variables. The stroke group also performed worse than the silent infarct group for all variables except for the SOPT. Finally, the silent infarct group did not differ statistically from the SCD with no lesion group or non-SCD comparison group except for SOPT, which indicated a higher rate of errors in the silent cerebral infarct group than either of these two groups.
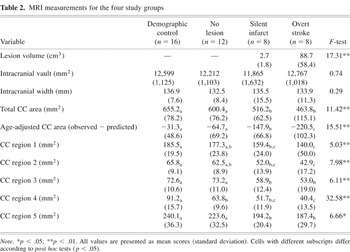
MRI measurements are shown in Table 2. Children with SCD and no visible infarcts did not differ statistically from the non-SCD group for any MRI measurements. Children with silent infarcts showed smaller lesion volume than those with overt stroke. There were no differences in intracranial vault area or head width among groups (all Fs < 1). Both the group with overt stroke and the group with silent cerebral infarcts had smaller midsagittal CC areas than the non-SCD group for all subregions and total area. The overt stroke group also had smaller CC areas than the no infarct group for total CC area, age-adjusted CC area, and regions 2, 3, 4, and 5. The group with silent infarcts had smaller CC areas than the SCD with no infarct groups for age-adjusted total area, region 3, and region 5. Children with silent infarcts only differed from children with stroke for age-adjusted total CC area.
MRI measurements for the four study groups

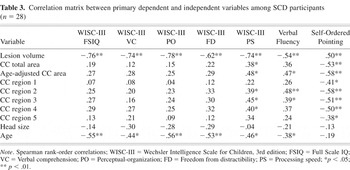
The correlation matrix among study variables is shown for SCD participants in Table 3. Lesion volume correlated robustly with cognitive variables for children with SCD. There was a medium to large correlation between lesion volume and CC area, r = .44, p < .05. Age-adjusted total CC area showed a significant univariate correlation with the WISC-III Processing Speed factor, Verbal Fluency, and the SOPT. Age showed a significant negative correlation with cognitive performance levels among the SCD group, but not when including the non-SCD participants in the analyses: The relationships were no longer significant due to the low (near zero) correlations between age and cognitive performance in the non-SCD comparison group.
Correlation matrix between primary dependent and independent variables among SCD participants (n = 28)

The test of Hypothesis 1 predicted Full Scale IQ from lesion volume, age, and head size with the total area of the CC added in the second step of the regression to test for its added explanatory power. The overall model was significant, F(4,23) = 17.73, p < .01, R2 = .825, however, the addition of total CC area in step 2 did not show a significant incremental prediction of scores, F(1,23) = 3.36, p < .08, IR2 = .039. Total lesion volume, Beta = −.80, t(23) = −4.73, p < .01, was the only independent predictor of Full Scale IQ. The exploratory analyses generally showed a similar pattern as the primary analysis, with lesion volume as a significant independent predictor for all WISC-III domains (all ts > 2.5). Lesion volume was not an independent predictor for the Verbal Fluency test, Beta = −.19, t(23) = −0.69, ns, or the SOPT, Beta = −.26, t(23) = 1.42, ns. CC area did not add unique explained variance to any of the exploratory models except for the SOPT, F(1,23) = 9.23, p < .01, IR2 = .164.
The test of Hypothesis 2 involved a hierarchical model predicting each of three measures of attention and executive functioning from lesion volume, head size, age (step 1), and CC regions 1 and 2 (step 2). For WISC-III Freedom from Distractibility scores the overall model was significant, F(5,22) = 5.47, p < .01, R2 = .554, however, the addition of CC regions 1 and 2 did not show a significant incremental prediction of scores, F(2,22) = 1.32, ns, IR2 = .053. In the final model, CC region 2 was noted to be a unique individual predictor of Freedom from Distractibility, Beta = .58, t(22) = 2.12, p < .05. For Verbal Fluency the overall model was again significant, F(5,22) = 4.23, p < .01, R2 = .490. CC regions 1 and 2 added significant incremental prediction of scores, F(2,22) = 3.93, p < .05, IR2 = .163. In the final model, CC region 2 was noted to be a unique individual predictor of Verbal Fluency, Beta = .62, t(22) = 2.34, p < .01. For SOPT, the overall model was also significant, F(5,22) = 8.65, p < .01, R2 = .663. CC regions 1 and 2 added significant incremental prediction of scores, F(2,22) = 8.78, p < .01, IR2 = .27. In the final model, CC region 2 was a unique individual predictor of SOPT, Beta = −.71, t(22) = −3.30, p < .01.
The test of Hypothesis 3 was parallel to the tests of Hypothesis 2 except that CC region 5 was added in step 2 of the hierarchical regression model. For WISC-III Perceptual Organization scores the overall model was significant, F(4,23) = 13.15, p < .01, R2 = .696, however, CC region 5 did not show a significant incremental prediction of scores, F(1,23) = 0.62, ns, IR2 = .008. In the final model, only age, Beta = −.40, t(23) = −3.01, p < .01, and lesion volume, Beta = −.59, t(23) = −4.35, p < .01, were significant unique predictors.
Finally, all regression models were evaluated for the influence of outliers on Beta coefficients. Residual scores were computed for cognitive variables, eliminating one of the significant unique predictor variables (e.g., CC area in region 2), and these residual scores were examined in relation to the eliminated predictor variable with scatter plots. These scatter plots did not suggest that the significance of any of the unique predictor variables was due to unusual data points.
DISCUSSION
MRI measurements of lesion volume, midsagittal CC size, and their ability to predict cognitive functioning were evaluated in children with SCD and a demographically matched comparison group. Previous studies using quantitative MRI to study children with SCD and cerebral infarction have demonstrated large correlations between the volume of visible tissue injury and cognitive deficits (Schatz et al., 1999, 2002). CC size was used in the present study to provide an index of tissue loss as an additional parameter to understand the effects of SCD on the brain and brain function.
CC area on midsagittal section was smaller in both children with silent infarcts and overt stroke compared to those without visible brain lesions. The reduction in the size of the CC with cerebral infarction would be expected given the known effects of cerebral tissue injury on interhemispheric axons (de Lacoste et al., 1985; Clarke & Miklossy, 1990; Moses et al., 2000). The CC is the largest white matter pathway between the two hemispheres, and the size of the CC has shown a moderate to large correlation with total forebrain tissue volume in adult humans (Jäncke et al., 1997; Tramo et al., 1998). Therefore, these CC differences may represent specific reductions in white matter or a combination of reductions in both gray and white matter.
We had hypothesized that CC size, as an indicator of tissue loss, would provide additional explanatory power for general cognitive functioning beyond visible tissue injury. This hypothesis was not supported. Reductions in CC size have been reported to correlate with intellectual declines in children with spastic diplegic cerebral palsy (Fedrizzi et al., 1996) and childhood onset epilepsy (Atkinson et al., 1996; Strauss et al., 1994). However, other reports of pediatric populations have not consistently found this pattern (Hynd et al., 1995; Peterson et al., 2000). The present study indicates that although the amount of visible tissue injury on MRI may not represent the full extent of cerebral vascular injury in SCD, it nonetheless functions well as a single index of lesion severity in predicting the general cognitive effects of the injury. The caveat to this interpretation of the data is that this study has a limited sample size and may not have had adequate statistical power to detect the relationship between CC area and general cognitive ability. In the regression model CC area accounted for approximately 4% unique variance in general cognitive ability after controlling for other variables, and this was sufficient for a trend toward statistical significance (p < .08). Thus, one could argue that there would be a unique relationship between CC area and general cognitive ability if the study had greater power. However, given that lesion volume accounted for 58% of the variance in general intellectual ability, it is difficult to argue that the CC measure added a robust degree of explanatory power.
The one exception to the utility of total lesion volume as a primary predictor of cognitive functioning was in explaining the extent of attention and executive skill deficits. Anterior CC area, particularly in the anterior body of the CC, provided additional explanatory power for predicting deficits in all three tests from this domain. The additional explained variance of anterior CC area was in the range of 16–27%, which was both statistically significant and seems meaningful in terms of the added explanatory power. The anterior body of the CC likely contains interhemispheric connections originating from the posterior portions of the middle and superior frontal gyrus, including premotor and supplementary motor cortex (Witelson, 1989; Moses et al., 2000). These cortical regions appear to be involved in executive aspects of motor control (Ball et al., 1999; Roland et al., 1980), as well as broader attention and executive skills (Petit et al., 1998; D'Esposito et al., 2000; Simon et al., 2002). The present study provides strong support for the specificity of these anterior regions for attention and executive skill deficits in children with SCD.
In contrast, posterior portions of the CC failed to predict visual-spatial deficits, which is consistent with previous reports indicating that lesion location in posterior regions and lesion severity are difficult to disentangle in pediatric SCD (Craft et al., 1993; Schatz et al., 1999). The weight of the evidence from this and previous studies is that lesion severity may be a stronger influence over this cognitive domain than lesion location. However, assessing more specific visual-spatial skills rather than general domain performance may be a better strategy for identifying these specific relationships between locus of injury and visual-spatial skills (Schatz et al., 2004). We have found that differences in left versus right hemisphere injury can be detected in children with stroke from SCD by administering tests that evaluate specific visual-spatial skills (Schatz et al., 2004). For example, the efficiency of visual search in the left and right visual fields, the relative efficiency of identifying global versus local-level targets, and relative difficulties in perceiving categorical versus coordinate spatial relationships differed between children with left versus right hemisphere strokes in the study. It may be that posterior brain injury from childhood stroke is more strongly related to narrower component visual-spatial skills than indexed by the Perceptual Organization factor from the WISC-III. Thus, if the group of component visual-spatial skills represented by the Perceptual Organization factor may be affected by both anterior and posterior injury, then narrower measures of component skills may be needed to isolate the cognitive effects of posterior brain injury. One difficulty of testing hypotheses about the effects of posterior brain injury in stroke from SCD is the high prevalence of anterior injury (Brown et al., 2000; Schatz et al., 1999). An alternate explanation for the absence of a specific relationship between posterior injury and visual-spatial skills is that the typical patterns of brain injury in SCD make it difficult to detect these relationships due to the infrequency of injury occurring only in posterior regions.
There were two findings in this study that were not related to the main study hypotheses but are worthy of further consideration. First, age showed a negative correlation with cognitive performance in children with SCD, but not in the non-SCD participants. This finding may be due to at least two factors. Children with SCD and normal brain MRI have been noted to show declines in age-adjusted cognitive performance on certain cognitive measures, most notably, Verbal IQ and the Coding subtest of the Wechsler scales (Wang et al., 2001). It is unclear if this finding reported by Wang and colleagues is due to subtle effects of the disease on the brain or non-neurologic factors such as having more frequent school absences from illness. In addition, children with brain injury often show deficits at the time of injury plus a failure to make subsequent age-appropriate gains in some areas of cognitive ability (e.g., Ewing-Cobbs et al., 1997; Palmer et al., 2001). Thus, older age may be associated with a longer period of time post injury (and relatively lower cognitive performance compared with peers). In SCD the high prevalence of silent cerebral infarcts often makes identifying the precise onset of injury difficult. Therefore, we were not able to assess time since injury independently of chronological age.
The second notable finding was the reduction in CC size for children with silent cerebral infarcts that appeared to be disproportionate to the volume of visible tissue injury. MRI indicated the children with silent infarcts in the present study had much smaller amounts of visible tissue injury than those with overt strokes, and in this sample predominantly had lesions in anterior brain regions. This large difference in the amount of visible cerebral infarction did not result in a proportional difference in CC size between the two groups. As shown in Table 2, the overt stroke group had approximately 30 times more tissue appearing abnormal on T2-weighted imaging yet they only had twice the volume reduction in the CC relative to the silent infarct group. In addition, the regional assessment indicated CC reductions in the silent infarct group were quite notable in the posterior half of the CC. A review of the silent infarct cases' lesions indicated that 75% of the lesions identified and at least 80% of the lesion volume were in anterior regions. Thus, there was an apparent dissociation between visible cerebral infarction and CC size along the anterior-posterior axis.
These data suggest that more widespread tissue involvement may be present in children with silent infarcts beyond what might be predicted from lesions visible on MRI. More microscopic brain injury may occur in SCD due to insufficient arterial supply in the microvasculature (Koshy et al., 1990). Perhaps this or some other process affecting brain tissue is more pronounced in children with silent cerebral infarcts. Alternately, the anterior CC has been found to develop earlier than the posterior CC (Barkovich & Kjos, 1988; Rajapakse et al., 1996; Jäncke et al., 1999). It is possible that the smaller posterior CC in children with silent infarcts is due to a developmental process in this group rather than injury-related degeneration of axons. Physical growth delays in height, weight, and the onset of puberty are relatively common complications of SCD (Platt et al., 1984). The impact of general growth delays on the development of specific internal organs in children with SCD is not well understood. One recent study examined whether there are volumetric delays in brain growth in SCD (Steen et al., 2005). This study suggested possible differences in the timing of brain maturation between children with SCD and community controls. Specifically, within the community controls, total brain volume did not change significantly beyond age 5 years, whereas in the children with SCD total brain volume continued to increase with age beyond age 5. The study examined age in a cross-sectional manner, however, which limits the strength of the inferences about actual differences in the trajectory of brain growth in SCD. Nevertheless it may be that some of the differences in CC area (particularly in posterior regions) found in the present study are related to delayed myelination rather than a persistent deficit in tissue volume. Longitudinal measurements of brain growth would be needed to address this issue.
An additional explanation for the disproportionate CC reduction in children with silent cerebral infarcts is that the imaging sequences were not adequate to detect the full amount of cerebral infarction present. Steen et al. (2003) have reported that the use of 3 mm-thick slices and fluid attenuated inversion recovery (FLAIR) sequences significantly improves the detection of silent infarcts compared with 5 mm-thick slices using traditional T2-weighting. Thin slice T1-weighted sequences and T2-weighted sequences were available for all participants in the current study; more than half of the sample also received a thin-slice T2-weighted sequence to detect lesions. Thus, the sequences available for review in the current series of patients are likely more sensitive to silent infarcts than traditional 5 mm-thick T1- and T2-weighted sequences; however, the use of FLAIR and consistent use of thin T2-weighted sequences would have been a more sensitive set of scans for detecting cerebral infarction. Although we cannot rule out that our sequences missed cerebral infarction that may be detectable with MRI, this potential explanation for our findings does not diminish the point that there may be significant brain disease occurring in children with silent cerebral infarcts that has gone undetected with traditional methods. Future work will be needed to determine if these brain differences are undetected focal cerebral infarction or a more diffuse process affecting the brain that requires quantitative MRI for detection.
Several limitations of the present study are worth noting. The relatively small sample size limited the power of the study to detect less robust relationships between brain structure and cognitive functioning, and also potentially limits the generalizability of the findings to the larger population. Given the sample size of 28 children with SCD and an alpha level of .05 for testing hypotheses, the study power for detecting directional hypotheses of a “large” (r ≥ .5), “medium” (r ≥ .3), or “small” (r ≥ .1) size using Cohen's (1988) terminology would be .86, .45, and .12, respectively. Thus, given a typical desired power of .80 or higher the study was only powered to detect large effects. In addition, CC size is only one aspect of brain structure that could be examined. It is possible that other measurements on MRI would provide greater information about the factors leading to poorer cognitive functioning. Automated tissue segmentation to assess whole brain gray matter, white matter, and CSF volumes is an attractive technique, but can be problematic if cerebral infarction is present in regions where healthy tissue is expected. In addition, subtle changes in the T1-value of gray matter in SCD may also impact automated tissue classification (Steen et al., 1998). Inherent properties of tissue, such as T1-values, T2-values, or MR spectroscopy may provide additional information about structural tissue changes that occur outside of visible areas of cerebral infarction (Steen et al., 1998, 1999). Understanding the full range of structural and functional effects of SCD on the brain remains a critical issue for preventing organ damage and improving the quality of life for individuals with this disease.
ACKNOWLEDGMENTS
The authors thank the families who volunteered for this research and Alecia Ayer, Robert Finke, Sarah McKeown, and Ed O'Conner for help with MRI measurements. This work was supported in part by a University of South Carolina Research and Productive Scholars Award (Schatz) and the March of Dimes Birth Defects Foundation (award #12-FY02-109).
References
REFERENCES
Adams, R.J.,
Ohene-Frempong, K., &
Wang, W.
(2001).
Sickle cell and the brain. In
Hematology: American Society of Hematology Education Program
2001,
31–46.
Armstrong, F.D.,
Thompson, R.J.,
Wang, W.,
Zimmerman, R.,
Pegelow, C.H.,
Miller, S.,
Moser, F.,
Bello, J.,
Hurtig, A., &
Vass, K.
(1996).
Cognitive functioning and brain magnetic resonance imaging in
children with sickle cell disease.
Pediatrics,
97,
864–870.Google Scholar
Atkinson, D.S.,
Abou-Khalil, B.,
Charles, P.D., &
Welch, L.
(1996).
Midsagittal corpus callosum area, intelligence, and language
dominance in epilepsy.
Journal of Neuroimaging,
6,
235–239.Google Scholar
Barkovich, A.J. &
Kjos, B.O.
(1988).
Normal postnatal development of the corpus callosum as demonstrated
by MR imaging.
American Journal of Neuroradiology,
9,
487–491.Google Scholar
Ball, T.,
Schreiber, A.,
Feige, B.,
Wagner, M.,
Lucking, C.H., &
Kristeva-Feige, R.
(1999).
The role of higher-order motor areas in voluntary movement as
revealed by high-resolution EEG and fMRI.
Neuroimage,
10,
682–694.Google Scholar
Bernaudin, F.,
Verlhac, S.,
Fréard, F.,
Roudot-Thoraval, F.,
Benkerrou, M.,
Thuret, I.,
Mardini, R.,
Vannier, J.P.,
Ploix, E.,
Romero, M.,
Cassé-Perrot, C.,
Helly, M.,
Gillard, E.,
Sebag, G.,
Kchouk, H.,
Pracros, J.P.,
Finck, B.,
Dacher, J.N.,
Ichowitz, V.,
Raybaud, C.,
Poncet, M.,
Lesprit, E.,
Reinert, P.H., &
Brugieres, P.
(2000).
Multicenter prospective study of children with sickle cell disease:
Radiographic and psychometric correlation.
Journal of Child Neurology,
15,
333–343.Google Scholar
Brown, R.T.,
Davis, P.C.,
Lambert, R.,
Hsu, L.,
Hopkins, K., &
Eckman, J.
(2000).
Neurocognitive functioning and magnetic resonance imaging in
children with sickle cell disease.
Journal of Pediatric Psychology,
25,
207–218.Google Scholar
Clarke, S. &
Miklossy, J.
(1990).
Occipital cortex in man: Organization of callosal connections,
related myelo- and cytoarchitecture, and putative boundaries of functional
visual areas.
Journal of Comparative Neurology,
298,
188–214.Google Scholar
Cohen, J.
(1988).
Statistical power analysis for the behavioral sciences.
Hillsdale, NJ:
L. Erlbaum.
Cohen, M.J.,
Branch, W.B.,
McKie, V.C., &
Adams, R.J.
(1994).
Neuropsychological impairment in children with sickle cell anemia
and cerebrovascular accidents.
Clinical Pediatrics,
33,
517–524.Google Scholar
Craft, S.,
Schatz, J.,
Glauser, T.A.,
Lee, B., &
DeBaun, M.R.
(1993).
Neuropsychologic effects of stroke in children with sickle cell
anemia.
Journal of Pediatrics,
123,
712–717.Google Scholar
DeBaun, M.R.,
Schatz, J.,
Siegel, M.J.,
Koby, M.,
Craft, S.,
Resar, L.,
Chu, J.Y.,
Launius, G.,
Dadash-Zadeh, M.,
Lee, R.B., &
Noetzel, M.
(1998).
Cognitive screening examinations for silent cerebral infarcts in
sickle cell disease.
Neurology,
50,
1678–1682.Google Scholar
Delis, D.C.,
Kaplan, E., &
Kramer, J.H.
(2001).
Delis-Kaplan Executive Function System (D-KEFS) Examiner's
manual.
San Antonio, TX:
Psychological Corporation.
de Lacoste, M.C.,
Kirkpatrick, J.B., &
Ross, E.D.
(1985).
Topography of the human corpus callosum.
Journal of Neuropathology and Experimental Neurology,
44,
578–591Google Scholar
D'Esposito, M.,
Ballard, D.,
Zarahn, E., &
Aguirre, G.K.
(2000).
The role of the prefrontal cortex in sensory memory and motor
preparation: An event-related fMRI study.
NeuroImage,
11,
400–408.Google Scholar
Earley, C.J.,
Kittner, S.J.,
Feeser, B.R.,
Gardner, J.,
Epstein, A.,
Wozniak, M.A.,
Wityk, R.,
Stern, B.J.,
Price, T.R.,
Macko, R.F.,
Johnson, C.,
Sloan, M.A., &
Buchholz, D.
(1998).
Stroke in children and sickle-cell disease: Baltimore-Washington
Cooperative Young Stroke Study.
Neurology,
51,
169–176.Google Scholar
Ewing-Cobbs, L.,
Fletcher, J.M.,
Levin, H.S.,
Francis, D.J.,
Davidson, K., &
Miner, M.E.
(1997).
Longitudinal neuropsychological outcome in infants and preschoolers
with traumatic brain injury.
Journal of the International Neuropsychological Society,
3,
581–591.Google Scholar
Fedrizzi, E.,
Inverno, M.,
Bruzzone, M.G.,
Botteon, G.,
Saleti, U., &
Farinotti, M.
(1996).
MRI features of cerebral lesions and cognitive functions in preterm
spastic diplegic children.
Pediatric Neurology,
15,
207–212.Google Scholar
Ganesan, V.,
Ng, V.,
Chong, W.K.,
Kirkham, F.G., &
Connelly, A.
(1999).
Lesion volume, lesion location, and outcome after middle cerebral
artery territory stroke.
Archives of Diseases in Childhood,
81,
295–300.Google Scholar
Hynd, G.W.,
Hall, J.,
Novey, E.S.,
Eliopulos, D.,
Black, K.,
Gonzalez, J.J.,
Edmonds, J.E.,
Riccio, C., &
Cohen, M.
(1995).
Dyslexia and corpus callosum morphology.
Archives of Neurology,
52,
32–38.Google Scholar
Jäncke, L.,
Preis, S., &
Steinmetz, H.
(1999).
The relation between forebrain volume and midsagittal size of the
corpus callosum in children.
Neuroreport,
10,
2981–2985.Google Scholar
Jäncke, L.,
Staiger, J.F.,
Schlaug, G.,
Huang, Y., &
Steinmetz, H.
(1997).
The relationship between corpus callosum size and forebrain
volume.
Cerebral Cortex,
7,
48–56.Google Scholar
Koshy, M.,
Thomas, C., &
Goodwin, J.
(1990).
Vascular lesions in the central nervous system in sickle cell
disease (neuropathology).
Journal of the Association for Academic Minority Physicians,
1,
71–78.Google Scholar
Moser, F.G.,
Miller, S.T.,
Bello, J.A.,
Pegelow, C.H.,
Zimmerman, R.A.,
Wang, W.C.,
Ohene-Frempong, K.,
Schwartz, A.,
Vichinsky, E.P., &
Gallagher, D.
(1996).
The spectrum of brain MR abnormalities in sickle-cell disease: A
report from the Cooperative Study of Sickle Cell Disease.
American Journal of Neuroradiology,
17,
965–972.Google Scholar
Moses, P.,
Courchesne, E.,
Stiles, J.,
Trauner, D.,
Egaas, B., &
Edwards, E.
(2000).
Regional size reduction in the human corpus callosum following pre-
and perinatal brain injury.
Cerebral Cortex,
10,
1200–1210.Google Scholar
Palmer, S.L.,
Goloubeva, O.,
Reddick, W.E.,
Glass, J.O.,
Gajjar, A.,
Kun, L.,
Merchant, T.E., &
Mulhern, R.K.
(2001).
Patterns of intellectual development among survivors of pediatric
medullablastoma: A longitudinal analysis.
Journal of Clinical Oncology,
19,
2302–2308.Google Scholar
Pandya, D.N. &
Seltzer, B.
(1986).
The topography of commissural fibers. In
F. Leporé,
M. Ptito, &
H.H. Jasper (Eds.),
Two hemispheres—one brain: Functions of the corpus
callosum (pp.
47–73).
New York:
Liss.
Pavlakis, S.G.,
Gould, R.J., &
Zito, J.L.
(1991).
Stroke in children.
Advances in Pediatrics,
38,
151–179.Google Scholar
Pavlakis, S.G.,
Prohovnik, I.,
Piomelli, S., &
DeVivo, D.C.
(1989).
Neurologic complications of sickle cell disease.
Advances in Pediatrics,
36,
247–276.Google Scholar
Peterson, B.S.,
Vohr, B.,
Staib, L.H.,
Cannistraci, C.J.,
Dolberg, A.,
Schneider, K.C.,
Katz, K.H.,
Westerveld, M.,
Sparrow, S.,
Anderson, A.W.,
Duncan, C.C.,
Makuch, R.W.,
Gore, J.C., &
Ment, L.R.
(2000).
Regional brain volume abnormalities and long-term cognitive outcome
in preterm infants.
Journal of the American Medical Association,
284,
1939–1947.Google Scholar
Petit, L.,
Courtney, S.M.,
Ungerleider, L., &
Haxby, J.V.
(1998).
Sustained activity in the medial wall during working memory
delays.
Journal of Neuroscience,
18,
9429–9437.Google Scholar
Petrides, M. &
Milner, B.
(1982).
Deficits on subject-ordered tasks after frontal- and temporal-lobe
lesions in man.
Neuropsychologia,
20,
249–262.Google Scholar
Platt, O.S.,
Rosenstock, W., &
Espeland, M.A.
(1984).
Influence of sickle hemoglobinopathies on growth and
development.
New England Journal of Medicine,
311,
7–12.Google Scholar
Rajapakse, J.C.,
Giedd, J.N.,
Rumsey, J.M.,
Vaituzis, C.,
Hamburger, S.D., &
Rapoport, J.L.
(1996).
Regional MRI measurements of the corpus callosum: A methodological
and developmental study.
Brain and Development,
18,
379–388.Google Scholar
Rasband, W.
(2002).
NIH Image v.1.63 (software program).
Research Services Branch, National Institutes of Health.
Roland, P.E.,
Larsen, B.,
Lassen, N.A., &
Skinhof, E.
(1980).
Supplementary motor area and other cortical areas in organization of
voluntary movements in man.
Journal of Neurophysiology,
43,
118–136.Google Scholar
Rorden, C.
(2000).
MRIcro, version 1.27 (On-line). Available: http://www.psychology.nottingham.ac.uk/staff/cr1/mricro.html.
Schatz, J.,
Craft, S.,
Koby, M.,
Siegel, M.J.,
Resar, L.,
Lee, R.R.,
Chu, J.Y.,
Launius, G.,
Dadash-Zadehm, M., &
DeBaun, M.R.
(1999).
Neuropsychologic deficits in children with sickle cell disease and
cerebral infarction: Role of lesion site and volume.
Child Neuropsychology,
5,
92–103.Google Scholar
Schatz, J.,
White, D.A.,
Moinuddin, A.,
Armstrong, M., &
DeBaun, M.R.
(2002).
Lesion burden and cognitive morbidity in children with sickle cell
disease.
Journal of Child Neurology,
17,
891–895.Google Scholar
Schatz, J.,
Craft, S.,
Koby, M., &
DeBaun, M.R.
(2004).
Asymmetries in visual-spatial processing following childhood
stroke.
Neuropsychology,
18,
340–352.Google Scholar
Simon, S.R.,
Meunier, M.,
Piettre, L.,
Berardi, A.M.,
Segebarth, C.M., &
Boussaoud, D.
(2002).
Spatial attention and memory versus motor preparation:
Premotor cortex involvement as revealed by fMRI.
Journal of Neurophysiology,
88,
2047–2057.Google Scholar
Spreen, O. &
Strauss, E.
(1998).
A compendium of neuropsychological tests: Administration, norms, and
commentary
(2nd ed.).
New York:
Oxford University Press.
Steen, R.G.,
Emudianughe, T.,
Hankins, G.M.,
Wynn, L.W.,
Wang, W.C.,
Xiong, X., &
Helton, K.J.
(2003).
Brain imaging findings in pediatric patients with sickle cell
disease.
Radiology,
228,
216–225.Google Scholar
Steen, R.G.,
Emudianughe, T.,
Hunte, M.,
Glass, J.,
Wu, S.,
Xiong, X., &
Reddick, W.E.
(2005).
Brain volume in pediatric patients with sickle cell disease:
Evidence of volumetric growth delay?
AJNR: American Journal of Neuroradiology,
26,
455–462.Google Scholar
Steen, R.G.,
Reddick, W.E.,
Mulhern, R.K.,
Langston, J.W.,
Ogg, R.J.,
Bieberich, A.A.,
Kingsley, P.B., &
Wang, W.C.
(1998).
Quantitative MRI of the brain in children with sickle cell disease
reveals abnormalities unseen by conventional MRI.
Journal of Magnetic Resonance Imaging,
8,
535–543.Google Scholar
Steen, R.G.,
Xiong, X.,
Mulhern, R.K.,
Langston, J.W., &
Wang, W.C.
(1999).
Subtle brain abnormalities in children with sickle cell disease:
Relationship to blood hematocrit.
Annals of Neurology,
4,
279–286.Google Scholar
Strauss, E.,
Wada, J., &
Hunter, M.
(1994).
Callosal morphology and performance on intelligence tests.
Journal of Clinical and Experimental Neuropsychology,
16,
79–83.Google Scholar
Tramo, M.J.,
Loftus, W.C.,
Stukel, T.A.,
Green, R.L.,
Weaver, J.B., &
Gazzaniga, M.S.
(1998).
Brain size, head size, and intelligence quotient in monozygotic
twins.
Neurology,
50,
1246–1252.Google Scholar
U.S.Census Bureau.
(2002).
Census 2000 basics.
Washington, DC:
U.S. Government Printing Office.
Wang, W.,
Enos, L.,
Gallagher, D.,
Thompson, R.,
Guarini, L.,
Vichinsky, E.,
Wright, E.,
Zimmerman, R., &
Armstrong, F.D.,
Cooperative Study of Sickle Cell Disease
(2001).
Neuropsychologic performance in school-aged children with sickle
cell disease: A report from the Cooperative Study of Sickle Cell
Disease.
Journal of Pediatrics,
139,
391–397.Google Scholar
Watkins, K.E.,
Hewes, D.K.M.,
Kendall, B.E.,
Kingsley, D.P.E.,
Evans, J.E.P.,
Gadian, D.G.,
Vargha-Khadem, F., &
Kirkham, F.J.
(1998).
Cognitive deficits associated with frontal-lobe infarction in
children with sickle cell disease.
Developmental Medicine and Child Neurology,
40,
536–543.Google Scholar
Wechsler, D.
(1991).
Wechsler Intelligence Scale for Children, 3rd edition
(WISC-III).
New York:
Psychological Corporation.
White, D.A.,
Saloria, C.F.,
Schatz, J., &
DeBaun, M.R.
(2000).
Preliminary study of working memory in children with stroke related
to sickle cell disease.
Journal of Clinical and Experimental Neuropsychology,
22,
257–264.Google Scholar
Witelson, S.F.
(1989).
Hand and sex differences in the isthmus and genu of the human corpus
callosum: A postmortem morphological study.
Brain,
112,
799–835.Google Scholar
Yu-ling, T.,
Bing-huan, C.,
Jiong-da, Y.,
Jun, Z.,
Yi-chong, W.,
Song-hai, C.,
Zhi-yu, W.,
Qing-hai, L.
(1991).
Localization of functional projections from corpus callosum to
cerebral cortex.
Chinese Medical Journal,
104,
851–857.Google Scholar
Descriptive data for demographic and cognitive performance variables according to neurologic status
A midsagittal slice is shown in panel A with the intracranial vault region outlined in white and the corpus callosum outlined in black. In panel B a tracing of the corpus callosum is shown with regions of interest demarcated.
MRI measurements for the four study groups
Correlation matrix between primary dependent and independent variables among SCD participants (n = 28)
 You have
Access
- 51
- Cited by