
I. INTRODUCTION
Uniaxial tensile test has been used to describe the mechanical behavior of sheet metal for many years. Tremendous researches have been published to explain the relations between the fundamental mechanical properties of the material and the tensile test observations. Reference Vegter, Mulder, Liempt and Heijne1–Reference Ramazani, Abbasi, Prahl and Bleck8 Many of these studies have been regarded as the fundamental theories in material science and also have been wildly accepted in industry. In 1885, Considère firstly suggested that the instability initiates when the strain hardening is at the equivalent level with the geometrical softening. Reference Considère9 In 1952, Swift further developed this idea into plane stress state and proposed the diffuse necking theory. Reference Swift10 Hill also discussed this phenomenon in the same year and established the mathematical model of localized instability for an in-plane deforming rigid-plastic sheet. Reference Hill11 Many theories of plasticity such as the yield criterion were established following his initial work. Reference Hill12–Reference Hill16 Thereafter, Keeler and Backofen in 1962 clearly put forward the concept of diffuse and localized instability. Reference Karafillis, Ostrowski, Carter and Graham17 Tvergaard studied the tensile test of rectangular cross-section bar based on the two necking modes: diffuse necking and localized necking, and concluded the transition between the two modes is a function of cross-section aspect ratio. Reference Tvergaard18 Marciniak and Kuczyński studied the instability propagation of sheet metal in biaxial tensile test. Reference Marciniak and Kuczyński19 In their explanation, a groove is running in a direction perpendicular to the larger principle stress during instability process. In this groove, local strains begin to concentrate gradually. Ling proposed a method to predict the true stress–strain curve of sheet metal tensile specimen from engineering stress–strain data after necking occurred. A material function can be defined for finite element analysis (FEA) with a proper selection of a calibrated weight factor. Reference Ling20 However, some details regarding the forming of instability and fracture are not well explained yet.
If tension continues after local necking starts, material would fracture. The study of fracture initiation is also crucial in understanding the material's fundamental behavior. However, the investigation of fracture remains difficult due to the fact that the material's deformation during local necking and fracture is so complex. A better understanding of the stress and strain distribution in the tensile strip is necessary. Theoretical calculation of the stress and strain distribution inside the sheet metal exhibits difficulty. Abbassi observed both diffuse and localized necking during uniaxial and biaxial loading by experiments and simulation. Reference Abbassi, Nasri, Brault, Mistou and Zghal21 Nevertheless, few studies focus on stress or strain analysis during necking. In experiment, different kinds of conventional extensometers were used in tensile test Reference Nasser, Yadav, Pathak and Altan22–Reference Everhart, Sawyer, Neidt, Dinardo and Brown24 but they cannot accurately measure the strain in necking area because of the highly concentrated local deformation. The deformation history during necking is critical to the investigation of instability and fracture. Komori analyzed tensile tests of round bars using the rigid-plastic finite element method and an analysis model with an initial defect and, by making predictions of the maximum tensile force and the related strain, found that the material properties coincide with the experimental results. Reference Komori25 Shahbeyk developed a numerical method that is capable of determining the nonuniform stress and strain fields in the minimum cross-section of necked cylindrical bars under uniaxial tension and showed that both the largest axial stress and strain appeared in the center. Reference Shahbeyk, Rahiminejad and Petrinic26 Chen et al. made a similar conclusion for tube tension that crack occurred first at the inner wall of the tube and subsequently propagates to outer wall. Meanwhile, the maximum axial stress is generated in the area close to the inner wall due to unloading in the outer wall. Reference Chen, D.X.E. and Zhang27 For cylindrical bar and tube, the largest stress and strain appears at the internal of the material. But those conclusions for round cross-section samples cannot be used directly for sheet metal, due to its nonaxial symmetry.
Cabezas and Celentano characterized the mechanical response of tensile bars and sheets and conducted finite element simulation to study the tensile deformation process. The results provided by simulation have been satisfactorily validated with experimental data and especially, the necking formation has been properly described. Reference Cabezas and Celentano28 Joun, et al. used very similar method to predict the onset of necking. Hollomon's constitutive law was used to describe the material's stress–strain curve and the strain-hardening exponent was defined as the true strain at the necking point of the experimental engineering stress–strain curve. The necking point was exactly predicted by this approach. The mechanism of necking was also explained using the finite element solutions. Reference Joun, Choi, Eom and Lee29 These work made significant progress on the fracture initiation and more studies are still necessary to investigate the stress and strain distributes in a metal trip and the location of fracture initiation.
Hill claimed that the angle between fracture edge and longitude axial is 54.74°, which is proposed by Nadai et al. Reference Hill15,Reference Nádai30 However, a large number of uniaxial tensile experiments have shown that for thin sheet specimens of different ductile metals and dimensions, the angle between the fracture plane and the tensile axial are obviously larger than 54.74°. Reference Brooks and Choudhury31
In this paper, a commonly used auto body material, dual phase steel CR340LA, is selected to study the development of necking and fracture process in uniaxial tensile test. The stress–strain evolution during instability and fracture process was investigated in a great detail in this study. Relying on FEA, a reasonable explanation of the fracture initiation was suggested and indirectly proved by the experiment. Besides, one of the reasons for the fracture angle error between calculated and experimental values has been discussed.
II. EXPERIMENTAL PROCEDURE
A. Uniaxial tensile test
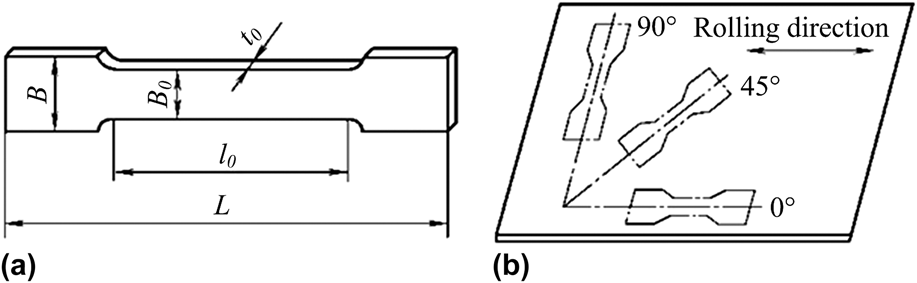
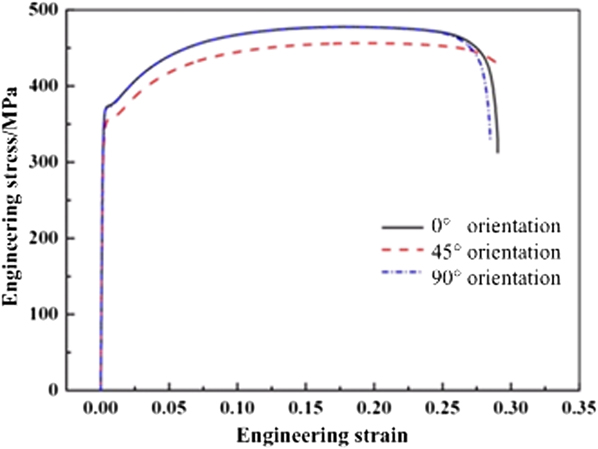
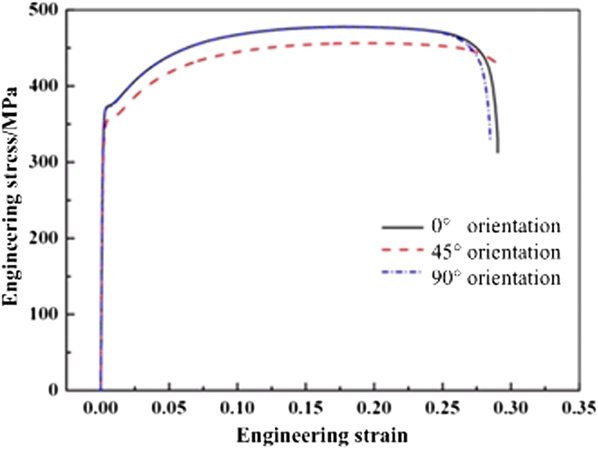
Dog-bone specimens of CR340LA (C < 0.1%, Mn 0.95%, Si 0.4%, Al 0.2%, Nb 0.09%, P < 0.025%, S < 0.025%) with thickness t 0 = 3 mm were prepared by Electrical Discharge Machining process as shown in Fig. 1. For each orientation (0, 45, and 90° with respect to the rolling direction), at least twelve samples were prepared. The samples were cut with the dimension of overall length 180 mm, grip 35 × 30 mm, gauge 70 × 15 mm. WDW-E100D universal testing machine (Ji'nan Shijin Group Co. Ltd., Jinan, China) was used in the test. A constant loading speed of 2.5 mm/min was selected. Before test, the specimen was properly aligned with the loading axis and gripped carefully to avoid twisting. The engineering strain was recorded using extensometer till 8% (±0.5%) of extension and then measured using the displacement of the frame until fracture. A micrometer with are solution of 0.01 mm (±0.005 mm) was used to measure the width and thickness of the samples for anisotropy calculation. The gauge length after fracture was measured with a vernier caliper to calculate the percentage of elongation. The Engineering stress–strain curve is plotted in Fig. 2. The mechanical properties obtained from the tests are summarized in Table I. Hollomon's constitutive law σ = Kε n issued here to describe the plastic behavior of the material.
The tensile specimens with (a) the dog-bone shape and (b) three orientations.

Engineering stress–strain curves of CR340LA.
Mechanical properties of CR340LA.

B. Load-stop test
The process of necking, grooving, and fracture lasts only a few seconds from onset of instability to fracture. To observe the deformation pattern at different instability stages, the loading process has to be terminated at different time intervals within the short time frame. Once the loading stops, we need to take the sample off the machine, conduct measurements and take pictures. Due to the difficulty of the time control, tens of repeated load-stop tests were conducted to cover as many instants as possible during necking. The deformation pattern on the tested samples must be clear enough to show the diffuse necking, intersected grooves, the location of the fracture initiation, and the fracture angle between fracture plane and tensile axial. Samples showing most obvious patterns were picked.
Among many test trails with different materials, CR340LA shows the clearest deformation pattern. That is one of reasons that CR340LA is the most suitable material in this study. The observation and conclusion from this study can be regarded as a general description of many ductile sheet metals' behavior.
III. FINITE ELEMENT SIMULATION
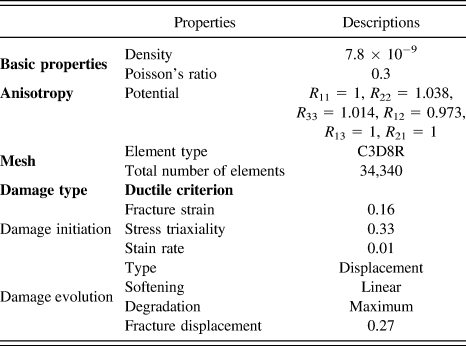
The commercial FEA code ABAQUS 6.10 was used in this study. The geometry and material properties were the same with experiments. Other FEA parameters were set as shown in Table II.
The FEA parameters used for CR340LA tension simulations.
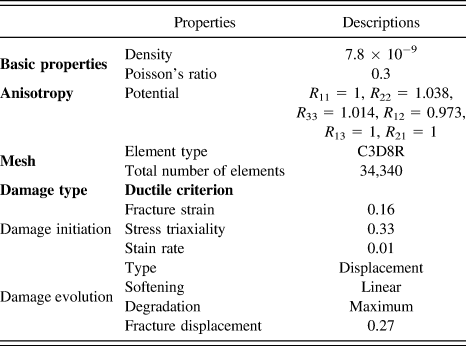
The anisotropy of the material was set by potential parameters in the model. R
11, R
22, R
33, R
12, R
13, R
21 were calculated from the anisotropy ratios r
0, r
45, r
90.
32
To simulate the fracture process, damage initiation, damage evolution, and element removal embedded in ABAQUS solver were introduced. Both ductile and shear criterions were utilized for quasistatic loading simulation and they yield very similar results. The following paragraphs only present the results with ductile criterion. The fracture strain at damage initiation is equal to the strain-hardening index,
Reference Karafillis, Ostrowski, Carter and Graham17
 ${\varepsilon _{\rm{d}}} = n = 0.16$
, which is calculated from material's stress–strain curve. The fracture displacement 0.27 was calibrated using test data.
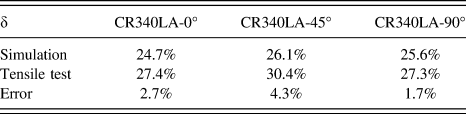
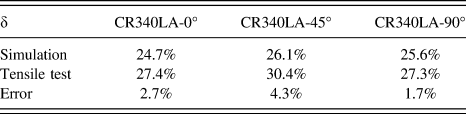
The gauge elongation from FEA and experiment after fracture are listed in Table III. The elongation after fracture was calculated by
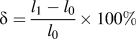 $\delta = {{{l_1} - {l_0}} \over {{l_0}}} \times 100\%$
, where l
0 and l
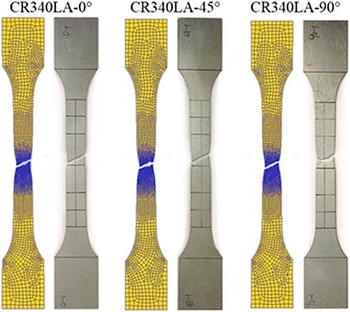
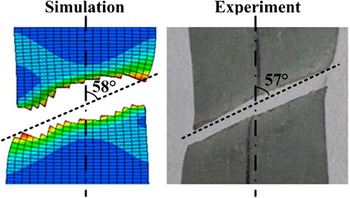
1 are gauge length of samples before tension and after fracture, respectively. The error between FEA prediction and experimental measurement is 1.7–4.3%, which indicates the FEA has an accurate prediction on the elongation during tension. Figure 3 shows that deformed geometries from FEA are very close to the experimental results. The average fracture angle predicted from FEA is 58°, which is also close to the experimental measurement 57°. The initial comparison demonstrates the accuracy of the FEA calculations and we can rely on FEA results to study material's behavior.
Elongations of CR340LA in three orientations from simulations and experiments.
The fractured geometries of CR340LA in three orientations from simulations and experiments.

IV. RESULTS AND DISCUSSION
A. Deformation pattern of the necking region
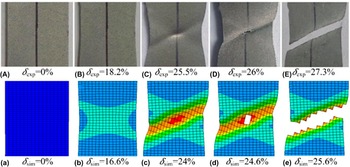
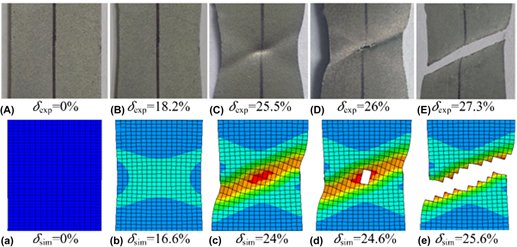
Figure 4 shows the deformation pattern of the necking region at different stages as elongation δ increases (δexp and δsim denote δ from experiments and simulations, respectively). When the maximum load is reached in the strip, nonuniform deformation starts. Reference Hill12 It is associated with geometrical instability, which results in a neck. At the end stage of instability, two intersected necking grooves are generated and the deformation concentrates in the grooves. As tension continues, one local necking groove stops growing while the other one keeps going deeper. The fracture occurs firstly at the location where the two local necking grooves intersect and extends along the deeper groove.
Deformation pattern of CR340LA tensile strip in experiments (A–E) and simulations (a–e): (A/a) the origin geometry; (B/b) the neck becomes visible; (C/c) two necking grooves; (D/d) the initial crack in the sheet surface; and (E/e) the final fracture along the deeper groove.

B. Direction change of the maximum principle stress before fracture
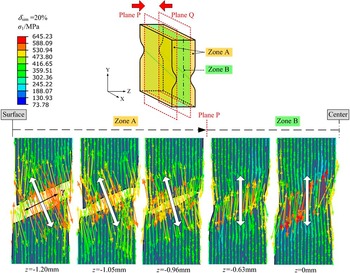
The stress distribution during localized necking Reference Karafillis, Ostrowski, Carter and Graham17 directly affects the fracture initiation. If the direction along the deeper groove is γ, the strain rate along this necking groove is εγ = 0. Reference Hill11 So γ is a principle strain direction, and the stress in this direction is mean stress σγ = σm. γ is also a principle stress direction. The directions of the other two principle stresses have to be perpendicular to γ and parallel to the thickness direction (ignore the effect of the necked curve shape in thickness direction). Figure 5 shows the maximum principle stresses in different cross-sections parallel to XY plane at δsim = 20% during localized necking. The cross-section moves along Z-axis from one surface to center of the sheet (z = −1.20 mm to z = 0 mm). Plane P and Q are tangential to the bottoms of the deeper necking grooves. The zone between plane P and Q is defined as zone B; the rest are zone A. The white arrows indicate the general direction of the maximum principle stress near the necking groove in each section.
The maximum principle stress distribution and direction change during localized instability process.

The direction of the maximum principle stress σ1 in zone A, where the necking groove has already formed, is perpendicular to γ, and σ1 max = 580 MPa. In zone B, where necking groove has not formed yet, the direction of σ1 is still almost parallel to Y-axis and σ1 max = 645 MPa. As the depth of the necking groove increases, plane P and Q keeps moving toward the center of thickness (z = 0 mm). That means there will be more elements/material whose maximum principle stress direction will turn from parallel to Y-axis to perpendicular to the necking groove. Thus it could be deduced that the final fracture will occur in the direction along the groove.
C. The depth of the necking grooves
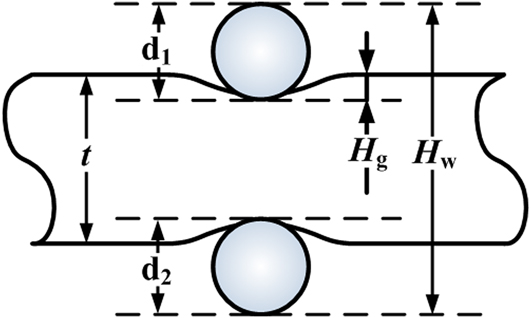
To understand the development of necking band, the geometry of the sheet at the instant right before fracture is measured with vernier caliper and two small steel balls. The measuring method is schematically shown in Fig. 6. The depth of the groove H g can be calculated using Eq. (1), assuming the part is symmetric.
 $${H_{\rm{g}}} = {1 \over 2}\left( {t - {H_{\rm{w}}} + {d_1} + {d_2}} \right)\quad ,$$
where t is the thickness of the sheet outside the necking region at current stage. H w is the distance between the centers of the two balls plus the two radii of the balls. d 1 and d 2 are diameters of two assistant steel balls.
Schematic diagram of the necking groove depth measuring method.
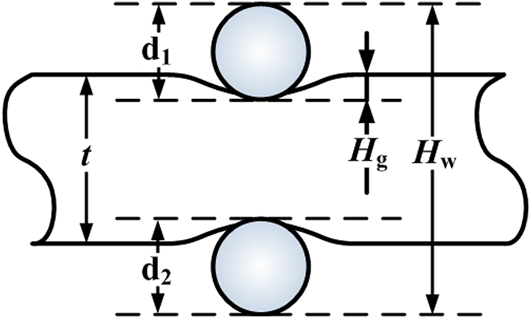
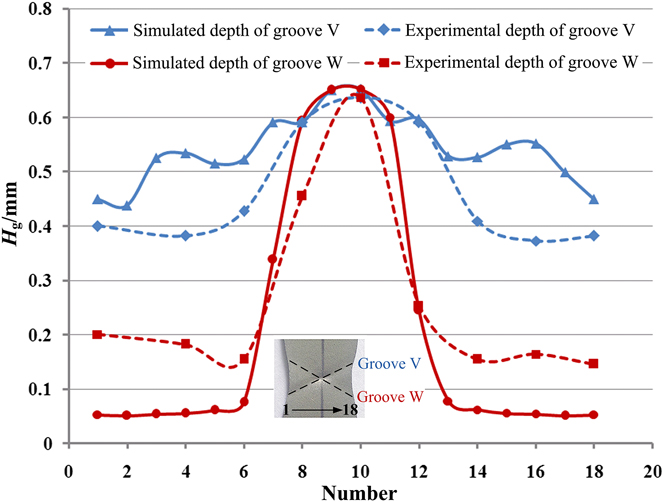
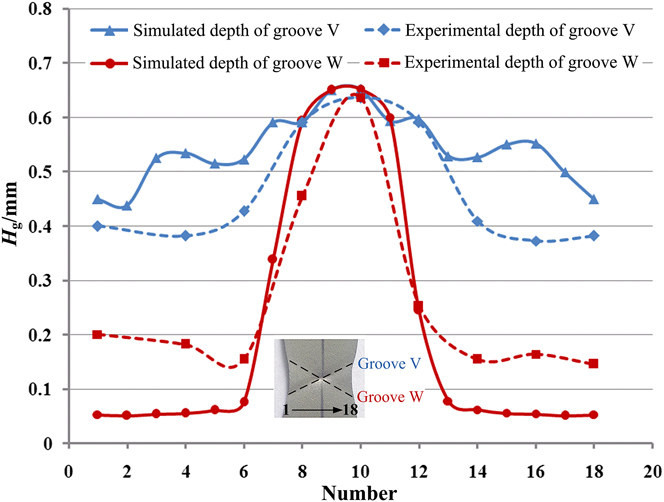
Figure 7 shows the H g values along the grooves right before fracture from experimental measurement and FEA. Between the two necking bands, we name the shallower one W and the deeper one V. The two bands intersect at the center of the strip, where H g reaches the max value H g max = 0.64 mm. Outside of the intersection, the FEA predicts the average depths of band W and V are 0.06 mm and 0.55 mm and the measurements of W and V are 0.17 mm and 0.4 mm, respectively. It suggests that the maximum depth at the intersection is obtained due to the super imposing of the thinning of the two necking bands.
The simulated and experimental depth of the necking grooves before fracture.
D. The initial fracture location
In general, ductile fracture is described as fracture initiation and propagation. Many tensile test results show that the ductile fracture initiates at the location where the two necking grooves intersect, such as shown in Fig. 4(D) and the simulation captured same result [Fig. 4(d)]. We can only see that the crack starts at center in the width direction. However, it is still unclear where crack firstly appears in thickness direction.
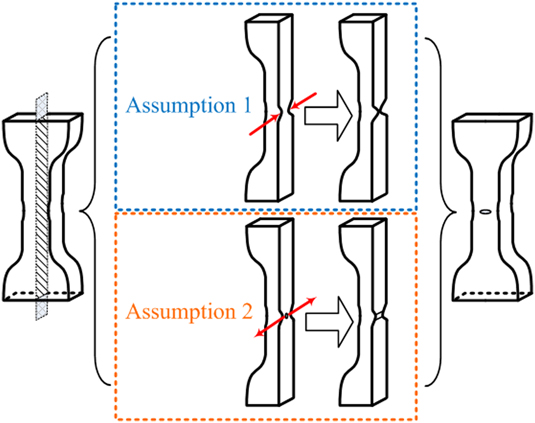
There are two possible fracture mechanisms where fracture initiates in thickness direction, as shown in Fig. 8. Assumption 1: as the depth of the necking groove getting deeper, plane P and Q meet at the center of the thickness (t → 0). Since the groove is deepest in the center of the necking region [Fig. 4(C)], a hole will first appear here. Assumption 2: at the center of the thickness, the voids, maybe associated with inclusions, nucleate and grow preferentially as a result of the triaxial tensile stress state. The voids link up by plastic flow and raise the initial crack in the internal of the sheet. Then the crack grows to the surface of the sheet.
Two assumptions of the fracture initiation in thickness direction.
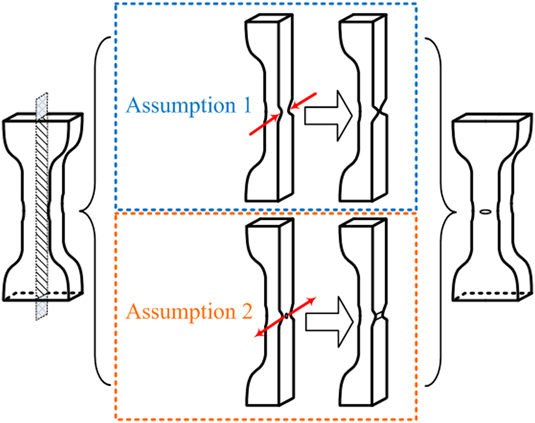
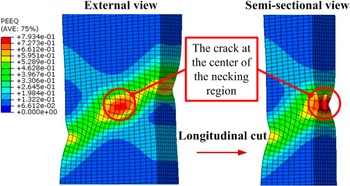
It is very difficult to observe the initial crack via tensile test if it forms in the internal of the material. Thus, we have to rely on FEA to study the initiation of the fracture. Figure 9 plots the deformed geometry of the necking region when the initial fracture occurs. It can be seen from the semisectional view that the material at the center of the thickness has already cracked while at this time the external does not show cracking in the external view. So the FEA result indicates that the fracture initiates from the internal of the sheet, at the center of both width and thickness directions in the necking region. On the other hand, the experimental observation shows after fracture, the thickness at the fracture edge is 1.7 mm. This is another evidence to prove that the material thickness is not approaching zero before fracture (not the same as assumption 1).
The simulated prediction of the initial crack in sheet uniaxial tension.

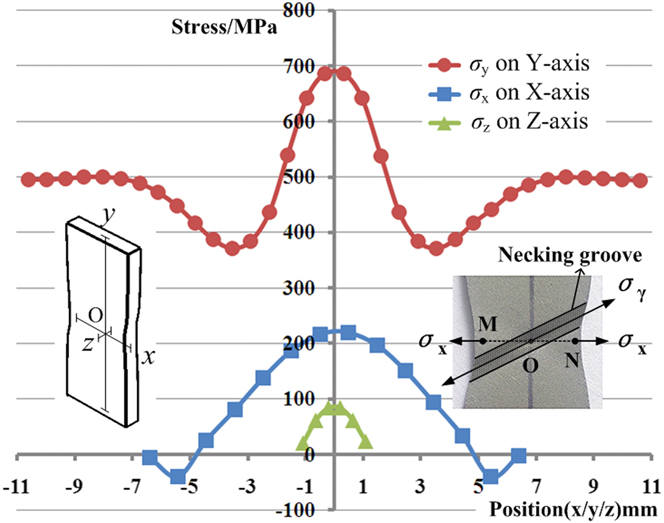
To describe the spatial location in the strip, a coordinate system is established first. The origin is selected as the center of volume of the specimen. X-axis is along the width direction of the specimen, Y-axis is along the gauge length direction, and Z-axis is the thickness direction. To explore the stress distribution, σ x on X-axis, σ y on Y-axis, and σ z on Z-axis in the necking region are plotted in Fig. 10 at one frame before fracture. The depth at the boundary of necking zone is gradually changing, so it is not able to define a clear boundary of necking zone. As a result, the width of necking zone can be reflected by the sudden change of stress state. At point O (x = 0, y = 0, z = 0), the stress in each direction reaches maximum, σ1 = σ y = 685 MPa, σ2 = σ x = 220 MPa, and σ3 = σ z = 84 MPa. In the longitudinal direction, since the tensile strains majorly concentrate around point O and no additional strains are generated outside the groove during localized necking, the materials away from point O within the groove are partially unloaded for equilibrium. Thus the minimum value σ y min =372 MPa appears at the borders of the necking groove. Outside the necking region, σ y recovers to about 500 MPa and stabilizes. In the width direction, σ x min = −48 MPa appears close to the sheet surface, M and N in Fig. 10. This is because the tensile stress along the groove σγ = σm is constant and greater than σ x at point M and N, which results in local compressive resultant stress here. In the thickness direction, σ z rises up from surface to the center of the thickness sharply because the sheet is thin.
The axial stresses on each axis at the center of the sheet before fracture.
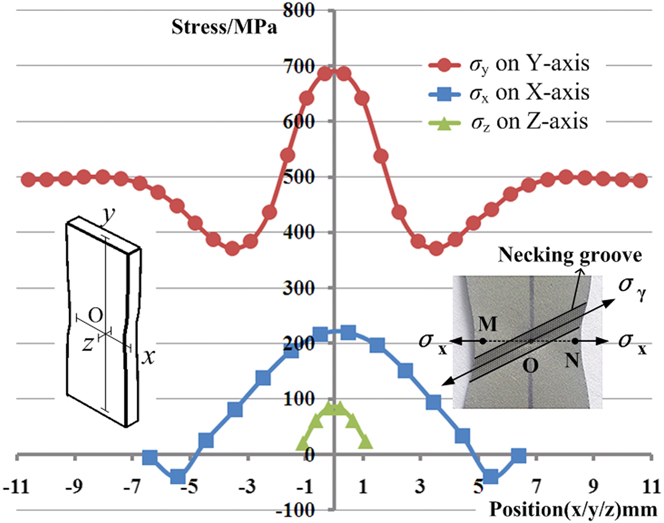
From the plot in Fig. 10, we can easily conclude the reason why fracture is initiated at point O. This is because material at O is under the triaxial tensile stress state and the stresses and strains in all directions are the largest. Once the fracture occurs from here, it extends in the principle plane. The final fracture forms along the necking groove since it has the least resistance, as shown in Figs. 4(E) and 4(e).
E. Fracture angle
The occurrence of initial crack results in the fracture of the sheet. The fracture extends along the path of minimum energy gradient, which is exactly the direction along the zero-strain-rate necking groove. Fracture is finally formed under the force in the direction perpendicular to this necking groove (Fig. 5).
From FEA and experimental data, the fracture angles between facture plane and tensile axis are θsim = 58° and θexp = 57°, respectively, as seen in Fig. 11. Both values are slightly but noteworthy different from 54.74°, the theoretical calculation by Hill. The ignorance of anisotropy and the triaxial stress state evolution are some possible reasons for the deviation.
The simulated prediction and experimental result of the fracture angle.

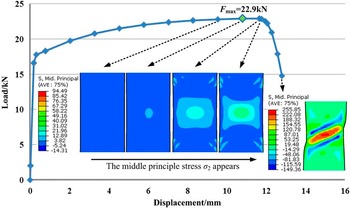
Figure 12 plots the load versus displacement curve of the tensile test and the appearance and growth of the intermediate principle stress. When the maximum load is reached at F max = 22.9 kN. The stress in width direction σ x = σ2 appears and gradually increases during whole instability process. The maximum value is reached right before fracture, σ2 max = 225.85 MPa. The appearance of σ2 enhances the stress concentration at the center of the sheet and prevents further neck in the width direction. It also has certain effect on the final direction of the zero-strain-rate necking groove. As a result, the ignorance of σ2 in the calculation on the fracture angle leads to some error and the influences of σ2 on the fracture angle will be studied in our future work.
Load displacement curve and the appearance of the middle principle stress.

V. CONCLUSIONS
-
(1) At the end of instability stage in uniaxial tension for many ductile metals, the direction of the maximum principle stress near the necking groove turns to being perpendicular to the groove. This tensile stress accelerates the growth of the groove and finally causes the fracture of the specimen.
-
(2) Both FEA and experiments indicate that the fracture initiates from the internal of the sheet at the center of both width and thickness directions, where the two local necking grooves intersect. Then this fracture propagates along the zero-strain-rate necking groove.
-
(3) Fracture of the specimen initiates at the center of the volume. This is due to the fact that the stresses in all three directions at this point are maximum.
-
(4) The fracture angle between the fracture plane and the tensile axial is larger than the theoretical value. An important reason is the calculation did not include the effect of the triaxial stress state and ignored the stress in width direction.