

INTRODUCTION
Recent work has discussed the development of groups of nontraditional or ‘new’ speakers in language revitalisation contexts (Hornsby Reference Hornsby2005; Robert Reference Robert2009; O’Rourke & Pujolar Reference O'Rourke and Pujolar2013; O’Rourke & Ramallo Reference O'Rourke and Ramallo2013; McLeod, O'Rourke, & Dunmore Reference McLeod, O’ Rourke and Dunmore2014; Puigdevall Reference Puigdevall2014). Such speakers have usually learned a minority endangered language through immersion education or through adult education classes. New speakers may be constructed as lacking the ‘authenticity’ (see Bucholtz Reference Bucholtz2003; McEwan-Fujita Reference McEwan-Fujita2010) of native speakers, but increasingly represent a significant proportion of the total speakers of the language in question (Grinevald & Bert Reference Grinevald, Bert, Austin and Sallabank2011; O'Rourke & Pujolar Reference O'Rourke and Pujolar2013). Previous research into new speakers has largely concentrated on attitudes towards their varieties (Robert Reference Robert2009), or has investigated language ideologies circulating in their communities (Hornsby Reference Hornsby2005; O’Rourke & Ramallo Reference O'Rourke and Ramallo2013; McLeod et al. Reference McLeod, O’ Rourke and Dunmore2014; Puigdevall Reference Puigdevall2014). Here, I instead investigate the phonetic nature of the speech of new speakers of Scottish Gaelic, a minority language of Scotland undergoing revitalisation. The analysis includes the vowel /u/, lateral consonants, and intonation. Scottish Gaelic revitalisation is taking place both in the language's traditional rural heartlands, and in Scotland's urban centres. This article focuses, in particular, on this latter scenario, and identifies some phonetic features of the Gaelic spoken by young people in immersion schooling in Glasgow. These Glaswegian new speakers are compared (i) to young people in immersion education in the Isle of Lewis, a traditional Gaelic-heartland area, and (ii) to older speakers in Lewis, who grew up in a Gaelic-dominant environment.
This section provides an introduction to previous research into new speakers, and also the context of Scottish Gaelic revitalisation. The following section details the speakers used in this analysis, and the recording conditions. Young people's Gaelic spoken in Glasgow is, perhaps unsurprisingly, different to varieties of Gaelic spoken by young and older speakers in the language's traditional heartlands, as discussed in the following three sections. In the discussion section, I provide some explanations as to where the linguistic characteristics of Glasgow Gaelic are likely to originate, and identify some of the ways new speakers use and identify with Gaelic today. In this article I refer to the language ‘Scottish Gaelic’ as ‘Gaelic’ [ɡalɪk], as is customary in the Gaelic-speaking community.
NEW SPEAKERS
The term ‘new’ or ‘neo’ speaker has been widely used in several minority language revitalisation contexts for some time (O'Rourke & Pujolar Reference O'Rourke and Pujolar2013). For example, the term néo-bretonnant is commonly used to refer to new Breton speakers (McDonald Reference McDonald1989; Jones Reference Jones1998; Quéré Reference Quéré2000; Timm Reference Timm2003, Reference Timm, Ball and Müller2010; Hornsby Reference Hornsby2005; Le Nevez Reference Le Nevez2006; Grinevald & Bert Reference Grinevald, Bert, Austin and Sallabank2011). Similarly, O'Rourke & Ramallo (Reference O'Rourke and Ramallo2013) note that the Galician term neo-falante is widely used in connection with nontraditional Galician speakers, and the term Euskaldunberri (lit. ‘new Basque speaker’) is widely used in relation to new Basque speakers (Ortega, Amorrortu, Goirigolzarri, Urla, & Urange Reference Ortega, Amorrortu, Goirigolzarri, Urla and Urange2014). More recently, the term has been expanded to refer to other contexts such as Welsh, Galician, Irish, Catalan, and Gaelic (Robert Reference Robert2009; O'Rourke Reference O'Rourke2011; O'Rourke & Ramallo Reference O'Rourke and Ramallo2013; McLeod et al. Reference McLeod, O’ Rourke and Dunmore2014; Puigdevall Reference Puigdevall2014).
The innovative aspect to this more recent use of the term ‘new speaker’ is the theoretical underpinning detailed in O'Rourke & Pujolar (Reference O'Rourke and Pujolar2013). Many previous sociolinguistic approaches to studying minority language revitalisation have either explicitly or implicitly relied upon Fishman's (Reference Fishman1991) priority of increasing native-speaker transmission (Romaine Reference Romaine2006; Duchêne & Heller Reference Duchêne and Heller2007). The aim of increasing native-speaker transmission is problematic in several ways. In the first instance, the gold standard of the ‘native-speaker’ benchmark has been widely contested in the applied linguistics literature as unfairly legitimising certain varieties at the expense of others due to an unequal distribution of power (e.g. Davies Reference Davies2003). Secondly, there are many cases of minority language revitalisation where new speakers now outnumber ‘native’ speakers. An extreme example of this would be Manx, where there are no native speakers at all but the language continues to be spoken by new speakers (Ó hIfearnáin Reference Ó hIfearnáin2015). Thirdly, many initiatives aiming to increase native speaker transmission focus on reconstructing the social conditions of when the language in question was widely spoken and transmitted (Fishman Reference Fishman2001:452, as noted by Romaine Reference Romaine2006:464). This is rarely, if ever, socially realistic or desirable.
Amidst the prevailing discourses of the native speaker and native-speaker transmission in revitalisation contexts, new speakers are often not afforded legitimacy or authenticity as speakers of the language in question (McEwan-Fujita Reference McEwan-Fujita2010). Such speakers have been described as ‘nonnative’, ‘L2’, ‘learner’, or ‘second language’, for example (Jones Reference Jones1998; Robert Reference Robert2009; Ó Duibhir & Garland Reference Ó Duibhir and Garland2010). The ‘new speaker’ term aims to move away from a model where new speakers are defined as deficient with respect to native-speaker models—for example, in the use of prefixes such as non-, or second. This is not a merely terminological debate: new speakers often struggle to gain recognition in their respective language communities to such an extent that it can impede their learning and alienate them from the language that they are attempting to revitalise (Robert Reference Robert2009; McEwan-Fujita Reference McEwan-Fujita2010).
Several previous studies have considered the linguistic characteristics of a minority language acquired in an immersion context, without being conducted through the new-speaker social framework. As such, they are relevant to the linguistic aspects under examination here. Many of these studies suggest that varieties acquired in immersion schooling are different from traditional varieties (Ó Giollagáin, Mac Donnacha, Ní Chualáin, Ní Shéaghda, & O'Brien Reference Ó Giollagáin, Donnacha, Chualáin, Shéaghda and O'Brien2007:11). Specifically, complex structures are often simplified (Ravid Reference Ravid1995; Jones Reference Jones1998; Ó Duibhir & Garland Reference Ó Duibhir and Garland2010), and the phonemic inventory of the language is often reduced (Maguire Reference Maguire1991; Jones Reference Jones1998). Such studies also cite phonetic and phonological transfer from the community-dominant language (Maguire Reference Maguire1991; Harada Reference Harada2006; Ó Giollagáin et al. Reference Ó Giollagáin, Donnacha, Chualáin, Shéaghda and O'Brien2007; King, Watson, Keegan, & Maclagan Reference King, Watson, Keegan, Maclagan, Rehner and Lockard2009; Morris Reference Morris2013).
SCOTTISH GAELIC REVITALISATION
Dorian's (Reference Dorian1981) seminal work on ‘language death’ considered the case of East Sutherland Gaelic, suggesting that ongoing decline in some Gaelic-speaking areas will lead to eventual ‘death’. While numbers of speakers from successive UK censuses show continuing decline in the number of Gaelic speakers overall, the contemporary situation of Gaelic is more complex than the context described by Dorian (Reference Dorian1981), due to ongoing revitalisation efforts. Gaelic now legally holds the same status as English in Scotland (Gaelic Language Act (Scotland) 2005).Footnote 1 There are approximately 58,000 speakers of Gaelic in Scotland according to the 2011 census (1% of the Scottish population). Although Gaelic is traditionally associated with Scotland's north-west Highland and Island areas, the 2011 census showed that around 30% of Gaelic speakers live in lowland urban Scotland. The reason for this population shift is two-fold: first, Gaelic speakers have a long history of migration to urban areas looking for work (Withers Reference Withers1998). Secondly, urban central Scotland, in particular Glasgow, is where many revitalisation policies are applied. Subsequently, Glasgow is the location of many Gaelic-essential professional jobs in politics, the arts, media, and publishing, thus attracting existing Gaelic speakers, and creating new ones (McLeod et al. Reference McLeod, O’ Rourke and Dunmore2014).
Gaelic-immersion schooling, otherwise known as Gaelic-medium schooling, is a flagship policy for Gaelic language revitalisation (Bòrd na Gàidhlig 2012). Since the opening of Gaelic-medium primary classes in 1985, Gaelic-medium education has grown rapidly: in 2010–2011 there were 3,528 pupils in Gaelic-medium primary, secondary, or nursery classes (Commun na Gàidhlig 2013). The majority of such classes are based in otherwise English-medium schools. There are, however, dedicated Gaelic-medium primary schools in Inverness, Glasgow, and Edinburgh, and a dedicated Gaelic-medium secondary school in Glasgow. Schools provide immersion education, rather than bilingual education, where the vast majority of classes are (ideally) in Gaelic (MacLeod Reference MacLeod, Nicolson and MacIver2003). Pupils are typically from English-speaking backgrounds, in both urban and Highland and Island areas (Stockdale, MacGregor, & Munro Reference Stockdale, MacGregor and Munro2003; O'Hanlon, McLeod, & Paterson Reference O'Hanlon, McLeod and Paterson2010). Even in heartland communities, immersion schooling has become the normal method of Gaelic acquisition: a detailed recent study of a rural Outer Hebridean community described intergenerational transmission as ‘broken’ (Munro, Taylor, & Armstrong Reference Munro, Taylor and Armstrong2011).
New Gaelic speakers themselves do not use the term ‘new speaker’. As mentioned earlier, this is an emerging term from the literature to refer to such contexts of minority language revitalisation (e.g. McLeod et al. Reference McLeod, O’ Rourke and Dunmore2014). The participants recognise, however, that their Gaelic is socially different from traditional speakers in some way, and also recognise that their Gaelic might be influenced by local varieties of English. This is illustrated in extract (1) below. Izzie lives in a suburb of Glasgow and has attended Gaelic medium schooling all her life. She has no family connection with the language but said that her mother ‘always liked’ Gaelic so decided to give her daughter an education in the language. I asked Izzie whether she thought that there were different accents in Gaelic.
(1) Interview with Izzie (20:36–21:10); I: Izzie, R: researcher (myself)


Izzie's response suggests that she thinks ‘accents’ belong to someone who has grown up in a Gaelic-speaking community, and are not permitted to someone such as herself. She implies here that ‘accents’ denote a traditional way of speaking, reserved for ‘local’ speakers of the language. She suggests that people from islands, citing Barra as an example of a traditional Gaelic-speaking place, would have ‘accents’, but people from her school speak English as their first language so cannot speak a traditional variety of Gaelic. Izzie suggests that young people do recognise that their method of Gaelic acquisition is new and different, but without using the term ‘new speaker’. Additionally, as identified by McLeod et al. (Reference McLeod, O’ Rourke and Dunmore2014:16), the Gaelic equivalent for ‘new speaker’, neach-labhairt ùr, is somewhat awkward sounding, and seems unlikely to come into widespread usage.
SUMMARY AND REMAINING QUESTIONS
Previous research, then, has identified new speakers as a distinctive social group emerging from language revitalisation policies. I focus in particular on young Scottish Gaelic speakers who have acquired Gaelic removed from the language's traditional heartlands. Previous quantitative research into new and immersion school speakers of other languages has mainly concentrated on morphosyntactic and lexical variables (e.g. Jones Reference Jones1998; Gathercole & Thomas Reference Gathercole and Thomas2009; Ó Duibhir & Garland Reference Ó Duibhir and Garland2010), and studies of phonetics have not examined the context of Scottish Gaelic (e.g. Harada Reference Harada2006; King et al. Reference King, Watson, Keegan, Maclagan, Rehner and Lockard2009; Morris Reference Morris2013). Here, I contribute phonetic analysis of the understudied context of Scottish Gaelic, and add to knowledge about identity construction as a new speaker. Specifically, I address two questions: (i) What is the phonetic nature of new Gaelic speakers' speech? and (ii) How can the characteristics of new speakers' Gaelic be explained?
In addressing these two questions I examine variation and change in the Gaelic context using the apparent time model (Gauchat Reference Gauchat, Morf and Betz1905; Labov Reference Labov1963). The limitations of this model have been well documented (e.g. Bailey, Wilke, Tillery, & Sand Reference Bailey, Wilke, Jan and Sand1991; Eckert Reference Eckert and Coulmas1997; Bailey Reference Bailey, Chambers, Trudgill and Schilling-Estes2002; Sankoff & Blondeau Reference Sankoff and Blondeau2007; Wagner Reference Wagner2012; Cukor-Avila & Bailey Reference Cukor-Avila, Bailey, Chambers and Schilling-Estes2013), but most of the limitations identified are in relation to change in individuals across the lifespan. A second assumption of the apparent time model is that the community in question remains stable as a social entity. For example, the assumption is that there is stability in what is meant by ‘Philadelphia’, ‘women’, or ‘working class’, and that such speech communities remain consistent over the course of an apparent time study. Discussions surrounding the speech community have noted considerable fluidity in how the term is defined and operationalised in variationist studies (see Patrick Reference Patrick, Chambers, Trudgill and Schilling-Estes2002, Rampton Reference Rampton, Coupland and Jaworski2009, and Coupland Reference Coupland, Llamas and Watt2010 for overviews). In the discussion section of this article, I examine how a near lack of intergenerational transmission in Gaelic leads to a reassessment of the appropriateness of the apparent-time model for examining language change in some contexts, as it is difficult to conclude that different groups of Gaelic speakers in this study form part of the same speech community.
METHOD
Data and speakers
The twenty-one young people from Glasgow considered here were aged thirteen to fourteen and were attending Gaelic-medium secondary schooling at the Gaelic secondary school in Glasgow. Three of them spoke Gaelic with one parent at home; none spoke Gaelic with two parents. The school in Glasgow is Scotland's only Gaelic-medium secondary school; in other cases, such as the Lewis school in this study, Gaelic-medium classes are provided within an otherwise English-medium school. Due to shortages of appropriately qualified teachers at the time of recording, however, the students at the Glasgow school received around half of their classes in English. The school in Glasgow opened in 2006 and as such there is no older generation of Glasgow speakers to whom young people can be appropriately compared.
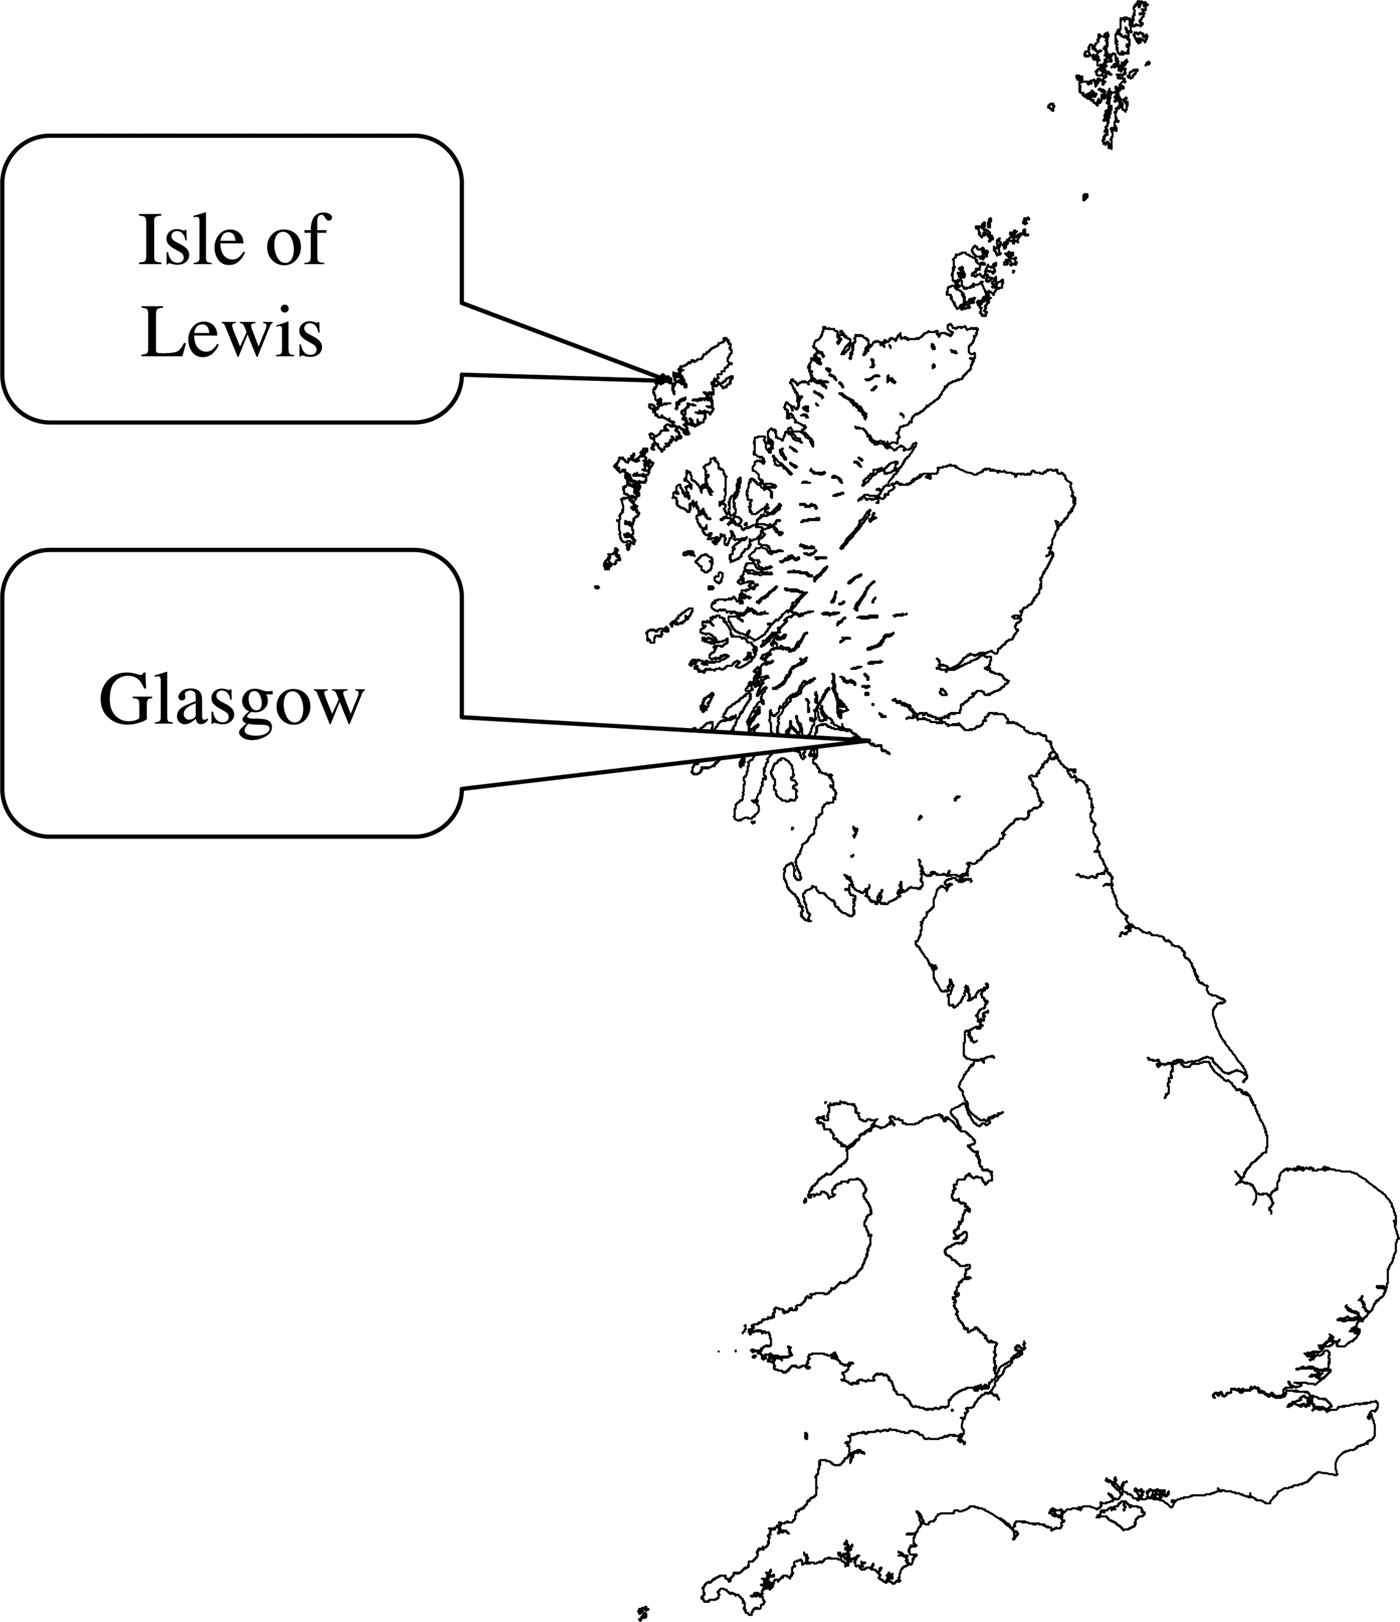
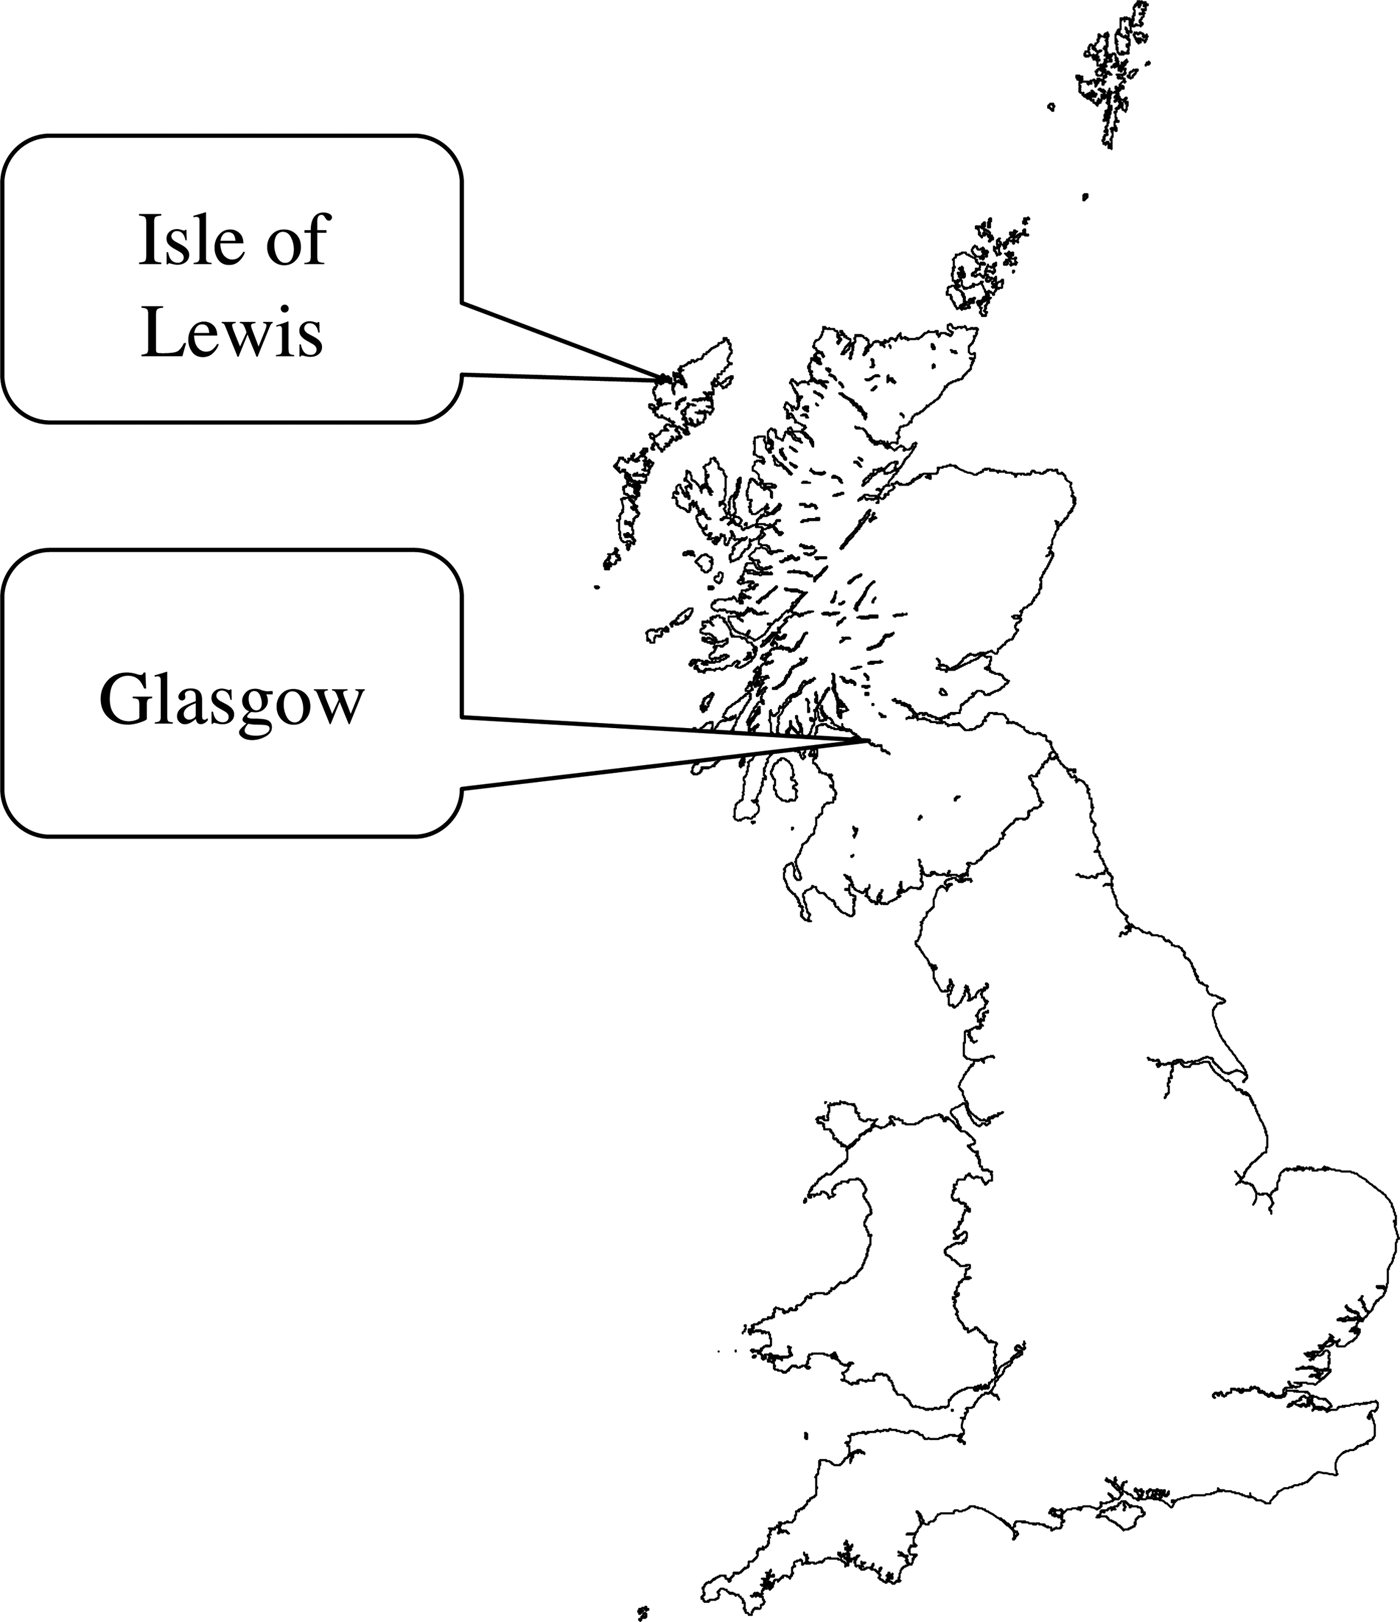
The comparison groups in this study are from the Isle of Lewis. Lewis is the location of the densest concentration of Gaelic speakers with around 60% of people on the island reporting some knowledge of Gaelic (2011 census). The Lewis dialect is frequently heard in the media because of the relatively large number of speakers available, and also because several Gaelic media facilities are located in Lewis. Over half of the teachers at the Glasgow school were from Lewis. Given the above reasons, Lewis was considered a suitable dialect for comparison. The twelve young Lewis speakers considered here were aged thirteen to fourteen and were attending Gaelic-medium classes at Lewis' only secondary school. Three of them spoke Gaelic at home with one parent; none spoke Gaelic with both parents. As in Glasgow, due to teacher shortages, the students in the Gaelic-medium class at the Lewis school received around half of their lessons in Gaelic and the rest in English. Figure 1 presents a map showing the location of Glasgow and Lewis within the UK.
Lewis and Glasgow.
Speaking Gaelic with one of your parents can be interpreted in many different ways. The extract below highlights some of the realities of a bilingual upbringing within the context of Gaelic's minority endangered status. Sophie's mother is from a Gaelic-speaking background in Lewis, and now works in Glasgow in Gaelic media. I asked Sophie (in Gaelic) if her mother spoke Gaelic to her.
(2) Interview with Sophie (01:40–02:04)

In her response above, Sophie code-switches and replies in English ‘all the time’. In addition, this phrase is audibly elongated and produced with low pitch, suggesting that she finds this practice somewhat irritating. Sophie was brought up mainly by her Gaelic-speaking mother, but the reality of her home language environment, and her attitudes towards it, seem somewhat mixed as she does not actually receive monolingual Gaelic input from her mother (line 4). Sophie seems to associate Gaelic with school and sometimes wants to leave it behind like her school uniform at the end of the day (lines 2–3), but eventually concludes that it is not so bad really (line 5). Although ‘speaking Gaelic to one parent’ might imply that solely Gaelic is used in exchanges between that parent and child, this extract suggests that the reality is more messy and challenging to negotiate.
Previous work suggests that Gaelic-medium students are generally from middle-class backgrounds (Johnstone, Harlen, MacNeil, Stradling, & Thorpe Reference Johnstone, Harlen, MacNeil, Stradling and Thorpe1999; Stockdale et al. Reference Stockdale, MacGregor and Munro2003; O’ Hanlon et al. Reference O'Hanlon, McLeod and Paterson2010), and this was reflected in the current sample. The reasons behind this are multiple (see O’ Hanlon et al. Reference O'Hanlon, McLeod and Paterson2010). For example, while Gaelic-medium education is funded by the state, it remains an optional choice for parents. Those parents willing to do the research necessary to make a choice with respect to their child's education tend to be from more middle class backgrounds (Posey-Maddox Reference Posey-Madox2014). Additionally, the perception remains among many Lewis inhabitants that English is associated with ‘getting on’ in the world, and an English-medium education is necessary (O’ Hanlon et al. Reference O'Hanlon, McLeod and Paterson2010). In Glasgow, relatively few members of the public are aware that Gaelic-medium education is a possibility, and even fewer are aware of the potential benefits. Again, those parents who put in the time to do the necessary research are those who take up the Gaelic-medium opportunity. While the relationship between social class and the rural/urban dichotomy is not a straightforward one (e.g. Shucksmith Reference Shucksmith2012), students from both the Glasgow and Lewis schools shared a similar ethos of educational attainment, aspiration towards a professional career, and a supportive parental background.
To form a further comparison with so-called ‘traditional’ speakers, I also present data from older Gaelic speakers from the Isle of Lewis. These six older Lewis speakers grew up in Gaelic-speaking environments in a rural part of Lewis, one hour's drive from the main town, Stornoway. They were aged sixty-one to eighty-six and all spoke Gaelic on a daily basis. Unlike the young people in this study, the older Lewis speakers learned English when they began to attend compulsory schooling. Many still feel more comfortable in Gaelic, as suggested in the extract below. Magaidh runs a community initiative in her area of Lewis, as well as being heavily involved with the local church. She is extremely proficient in English but explains here how Gaelic has a different feeling to it, and she feels more comfortable using the language.
(3) Interview with Magaidh (16:38–17:56)

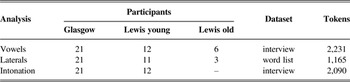
Summary of participants and tokens counts for each analysis.

Recordings
The data reported here are from sociolinguistic interviews I conducted in 2011 in Glasgow and in Lewis. The interviews were conducted in Gaelic and took place in a quiet room in the participant's school (in the case of the young people), or in the participant's home (in the case of the older Lewis speakers). The interviews lasted thirty to fifty minutes and discussed topics of interest to the participants such as school and popular culture (in the case of the young people), community issues (in the case of the older speakers), and their use of Gaelic (in both cases). The vocalic and intonation analyses reported here are based on data from these interviews. I also collected word-list data, on which the lateral analysis is based. The three older male participants from Lewis did not complete the word list task, as they were not able to read Gaelic. Participants were recorded onto a laptop computer using a Beyerdynamic Opus 55 headset microphone, a Rolls LiveMix pre-amplifier, and a USB audio interface.
Analysis
A summary of the number of participants included in each analysis, along with token counts and the data used, is in Table 1. This study investigates three linguistic features: variation in the realisation of the vowel /u/, variation in the production of the lateral system, and intonational variation. /u/ was selected as this vowel has been shown to vary across generations in a previous study (Nance Reference Nance2011). Laterals and intonation were chosen as variables that would illustrate the differences between the groups of speakers in this study since the Gaelic and English lateral and intonation systems are very divergent, and there are also large differences between Glasgow English on the one hand, and Highland and Island English on the other with respect to these features. The details of these differences are explained in the relevant sections below. In the case of each linguistic feature investigated, general-to-specific modelling was conducted where nonsignificant predictors were removed from the model until an optimum model was achieved (Baayen Reference Baayen2008:205). The details of the relevant models are given in the section relating to that particular feature.
VOWELS
In Gaelic, most consonants can be either velarised or nonvelarised (similar to Irish, e.g. Ní Chasaide Reference Ní Chasaide1999). Previous work has identified that Gaelic /u/ is realised as [ʉ] in nonvelarised consonantal environments, and [u] in velarised environments (Ladefoged, Ladefoged, Turk, Hind, & Skilton Reference Ladefoged, Ladefoged, Turk, Hind and Skilton1998; Nance Reference Nance2011). This study considers the nonvelarised [ʉ] only. In English, several studies have noted that English /u/ is fronting in the acoustic space (e.g. Cox Reference Cox1999; Watson, Maclagan, & Harrington Reference Watson, Maclagan and Harrington2000; Gordon, Campbell, Hay, Maclagan, Sudbury, & Trudgill Reference Gordon, Campbell, Hay, Maclagan, Sudbury and Trudgill2004; Labov, Ash, & Boberg Reference Labov, Ash and Boberg2006; Harrington Reference Harrington, Cole and Hualde2007; Maclagan, Watson, Harlow, King, & Keegan Reference Maclagan, Watson, Harlow, King and Keegan2009; Mesthrie Reference Mesthrie2010; Cheshire, Kerswill, Fox, & Torgersen Reference Cheshire, Kerswill, Fox and Torgersen2011). Such studies typically exclude /u/ preceding liquids due to the lowering effect on F2. In Scottish English, /u/ is already a central-to-front vowel [ʉ] in nonliquid environments (Grant Reference Grant1913; Johnston Reference Johnston and Jones1997; Scobbie, Stuart-Smith, & Lawson Reference Scobbie, Stuart-Smith and Lawson2012), and recent research indicates it may have begun backing among some groups of speakers, including young people in Glasgow (Rathcke, Stuart-Smith, Timmins, & José Reference Rathcke, Stuart-Smith, Timmins and José2012).
Lexically stressed tokens of (phonemically short) Gaelic [ʉ] were taken from the interviews. Ten tokens each of stressed /i/ and /a/ were also taken for normalisation purposes. Tokens preceding or following liquids and /w/ were excluded (Watson et al. Reference Watson, Maclagan and Harrington2000; Mesthrie Reference Mesthrie2010). Code-switched words from English were excluded as this study considers Gaelic vowels only. This resulted in a total of 2,231 Gaelic vowel tokens (an average of fifty-seven per speaker).
The data were coded for preceding and following environment, word position, and word class in ELAN (Sloetjes & Wittenburg Reference Sloetjes and Wittenburg2008). Word class was coded as research suggests different grammatical functions of even the same word may have different phonetic properties (e.g. Drager Reference Drager2011). Tokens were then labelled for vowel onset and offset in Praat (Boersma & Weenik Reference Boersma and Weenik2012), and formant measures derived in Emu (Harrington Reference Harrington2010). F2 measures were taken at peak F2 within the 25–75% duration of the vowel (Harrington Reference Harrington2010:180). The data were then auditory scaled to Bark (Traunmüller Reference Traunmüller1990) and normalised using Lobanov normalisation (Lobanov Reference Lobanov1971). In order to assess whether a token was ‘front’ in acoustic space, the F2 of each [ʉ] token was subtracted from each speaker's average F2 value for /i/. This results in a measure that I call ‘F2 distance’.
Results
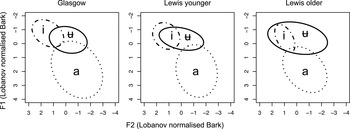
The tokens of Gaelic [ʉ] for each group of speakers are plotted in Figure 2. Tokens of /i/ and /a/ are also plotted for contextualisation. The circles around the data show 95% confidence intervals. The plots indicate that Glasgow speakers have the acoustically backest tokens of [ʉ] compared to /i/. There is a large amount of overlap between tokens of /i/ and [ʉ] among the Lewis older speakers, indicating fronter [ʉ], and the Lewis young speakers lie in between these two extremes.
Gaelic [ʉ]m /i/ and /a/.

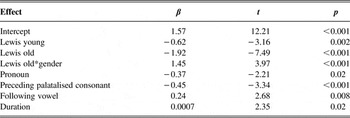
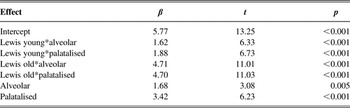
The F2 distance data were subjected to multiple mixed effects regression modelling. The fixed factors in the model were: speaker group (Glasgow, Lewis young, Lewis old), gender, the interaction of speaker group and gender, vowel preceding environment, vowel following environment, word class, word position, and vowel duration. The preceding and following environments were as follows: palatalised consonant, nonpalatalised coronal consonant, nonpalatalised nasal consonant, vowel, pause, other. The baseline speaker group was set as Glasgow. The random effects of speaker and word were also included in the final model, which is shown in Table 2. Numbers are rounded to two decimal places.
Final regression model of F2 distance (n = 1454).

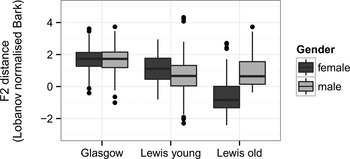
The model shows that Lewis young and Lewis older speakers have a significantly lower F2 distance (fronter [ʉ]) compared to Glasgow speakers. There is a significant interaction in the model, showing an effect of gender among the Lewis older speakers. This interaction is shown in Figure 3, which indicates that the Lewis older females have a lower F2 distance (fronter vowels) than the Lewis older males.
Speaker gender and F2 distance.

The model also shows that fronter [ʉ] is found in the context of a pronoun or a preceding palatalised consonant. This latter finding is consistent with previous studies of [ʉ] in English (Harrington, Reference Harrington, Cole and Hualde2007; Mesthrie, Reference Mesthrie2010), and is probably due to tongue body raising in the palatal region. On exploring the model's random effects, the finding relating to pronouns seems to stem from the words cuid ‘some [people]’ and cuideigin ‘someone’, both of which are produced with an auditorily extremely front vowel close to [ɪ]. The random effect of word in the model will mitigate the effects of individual words, but not remove them completely. [ʉ] with a following vowel is significantly backer, perhaps because of the audible tendency among some speakers to produce a [w]-like glide between [ʉ] and a following vowel, which would lower F2. An [ʉ] with longer duration is also significantly backer.
As there were no older Lewis speakers with only one Gaelic-speaking parent, the potential effect of having one Gaelic-speaking parent could not be investigated in the model described in Table 2. Instead, I constructed a separate model on the 1,227 [ʉ] tokens from the young people. The fixed and random factors were the same as the model, above, but included the additional factors of having a Gaelic-speaking parent, and the interaction of a Gaelic-speaking parent and gender, and a Gaelic-speaking parent and location (Glasgow or Lewis). The Gaelic-speaking parent factor and its interactions were not significant. The rest of the results mirrored those in Table 2, so are not repeated here.
LATERALS
Gaelic is described as having three phonemic laterals (Borgstrøm Reference Borgstrøm1940; Oftedal Reference Oftedal1956; Shuken Reference Shuken1980; Ladefoged et al. Reference Ladefoged, Ladefoged, Turk, Hind and Skilton1998; Ternes Reference Ternes2006; Nance Reference Nance2014). These are: /l̪ɣ l l̪ʲ/, which I refer to as velarised, alveolar, and palatalised respectively. Previous acoustic studies found lowest F2 and highest F1 in the velarised lateral, highest F2 and lowest F1 in the palatalised, and the alveolar values lying in between these two extremes (Shuken Reference Shuken1980; Ladefoged et al. Reference Ladefoged, Ladefoged, Turk, Hind and Skilton1998). The single English phonemic lateral is described as velarised or pharyngealised (‘dark’) in Glasgow (Wells Reference Wells1982; Macafee Reference Macafee1983; Stuart-Smith Reference Stuart-Smith, Foulkes and Docherty1999; Lambert, Alam, & Stuart-Smith Reference Lambert, Alam and Stuart-Smith2007; Stuart-Smith, Timmins, & Alam Reference Stuart-Smith, Timmins, Alam, Gregersen, Parrot and Quist2011). In Lewis, by contrast, the English lateral is typically produced with little or no velarisation (‘light’) (Wells Reference Wells1982; Shuken Reference Shuken and Trudgill1984).
Lateral tokens in this study were taken from the word-list section of the interview, as there were not enough tokens of the alveolar lateral occurring in word-initial position in the conversation section. As mentioned earlier, three older Lewis male speakers did not participate in the word-list study as they could not read Gaelic; and one female young Lewis speaker did not complete the word-list task. This analysis therefore considered data from thirty-five speakers in total. The words were presented three times in random order on a computer screen alongside thirty-seven distractors. The word list used is shown in the appendix. I here consider word-initial and word-medial laterals only. This analysis contains examples of twelve words containing laterals designed to be as close as possible to minimal pairs or triplets of the Gaelic lateral system.
The measure I used here to investigate Gaelic laterals is F2-F1, in order to capture the differences reported in both F2 and F1 Gaelic laterals, similar to Sproat & Fujimura (Reference Sproat and Fujimura1993) and Simonet (Reference Simonet2010). Formant measures were taken in Emu from Praat-labelled files at lateral steady-state midpoint (Carter & Local Reference Carter and Local2007). This study considers 1,165 lateral tokens (average thirty-five per speaker). The total numbers of tokens of each word is given in the appendix.
Results
Regression modelling was also conducted on the lateral data. In this case, the model was constructed to ascertain whether all speakers distinguished three laterals, and whether there were phonetic differences in the production of each lateral category. The fixed effects in this model were speaker group (Glasgow, Lewis young, Lewis old), lateral category (velarised, alveolar, palatalised), speaker group*lateral category interaction, word position, word position*lateral category interaction. Gender was not tested because of the lack of older Lewis male speakers in this analysis. Glasgow speakers were set as the baseline group, and velarised laterals were the baseline lateral category. The random effects in this model were speaker and word. The final model is shown in Table 3.
Final regression model of F2-F1 for the laterals (n = 1165).

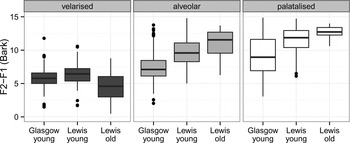
The model shows that alveolar and palatalised laterals are significantly different from velarised laterals, indicating that, overall, all lateral phonemes are phonetically distinct. There are significant interactions between Lewis young speakers and alveolar and palatalised laterals, and interactions between Lewis older speakers and alveolar and palatalised laterals. These interactions are displayed in Figure 4, which shows that Glasgow speakers have lower F2-F1 than Lewis speakers in both alveolar and palatalised laterals (suggesting ‘darker’ laterals).
Speaker age and laterals.

A separate model of the young people's data was constructed to consider the potential effect of having a Gaelic-speaking parent. This subset of the data contained 1,060 tokens. The model contained the same fixed as random factors as above, but included the additional factor of having a Gaelic-speaking parent and speaker gender. These factors were not significant in the final model. Other results were similar to those reported above so are not repeated here. Variation among individual speakers is not discussed here, but see Nance (Reference Nance2014) for details.
INTONATION
Previous research has described the Lewis dialect of Gaelic as a ‘word accent’ language, using lexical tone in a limited fashion to distinguish one word from another (Borgstrøm Reference Borgstrøm1940; Oftedal Reference Oftedal1956; Ladefoged et al. Reference Ladefoged, Ladefoged, Turk, Hind and Skilton1998; Ternes Reference Ternes2006). A previous study (Nance Reference Nance2013, Reference Nance2015), found that while older speakers use this ‘word accent’ system, this is not the case among either young Lewis speakers or young Glasgow speakers. Instead, young Gaelic speakers speak Gaelic as an ‘intonation language’ similar in prosodic structure to English. In this article, I investigate the intonation of young speakers only, and consider whether there are production differences between young Lewis and young Glasgow speakers.
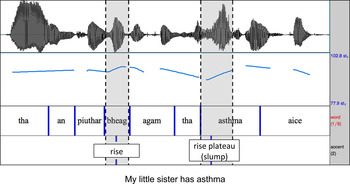
Descriptions of Glasgow English intonation state that intonation is most commonly rising, and that phrase-final contours can be described as a ‘rise plateau’ or ‘rise plateau slump’ (Mayo Reference Mayo1996; Cruttenden Reference Cruttenden2007; Ladd Reference Ladd2008). Examples of these contours in Gaelic are shown in Figure 5. Intonation is not discussed in descriptions of Lewis English, although authors comment that, in general, the phonology of Lewis English is heavily influenced by that of Gaelic (Wells Reference Wells1982; Shuken Reference Shuken and Trudgill1984), so it is difficult to predict the ways in which young people's Gaelic intonation in Lewis may be influenced by their English.
Phrase-final contours in Gaelic (Glasgow).

Approximately thirty intonation phrases per speaker were extracted from the middle ten minutes of each interview. Intonation phrases (IPs) were selected from those conveying one of two pragmatic functions: either narratives or general accounts, as defined in the Discourse Context Analysis framework (Gregersen, Nielsen, & Thøgersen Reference Gregersen, Nielsen and Thøgersen2009). These IPs were prosodically labelled in Praat (Boersma & Weenik Reference Boersma and Weenik2012) using the labelling system known as IViE (Intonational variation in English) (Grabe, Nolan, & Farrar Reference Grabe, Nolan, Farrar, Mannell and Robert-Ribes1998). In this article, I consider penultimate (prenuclear) and phrase-final (nuclear) pitch accents. Pitch accents are prosodically prominent syllables. Pitch accents usually occur on stressed syllables, but stressed syllables are not always pitch-accented (Ladd Reference Ladd2008).
Penultimate and phrase-final pitch accents were labelled using IViE, and I here consider the two most commonly occurring pitch accents: penultimate H* + L (simple fall) and L* + H (simple rise); and phrase-final H* + L 0% (simple fall) and L* + H 0% (rise plateau/rise plateau slump). I refer to the pitch accents using their descriptive labels (rise, fall) for clarity. Again, see Figure 5 for an example pitch trace from a Glaswegian intonation phrase.
In this analysis, the coding of penultimate and phrase-final contours are combined into one: penultimate rises and phrase-final rise plateaux are referred to as ‘rise’; and penultimate falls and phrase-final fall plateaux are referred to as ‘fall’. In total, I analyse 2,090 pitch accents.
Results
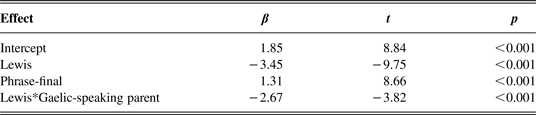
A subset of the data, consisting of ‘rises’ and ‘falls’ as defined above were analysed statistically using a mixed effects logistic regression (1,602 pitch accents). The fixed effects considered were speaker group (Glasgow/Lewis young), gender, penultimate or phrase-final position, whether the participant had one Gaelic-speaking parent, and interactions between these factors. Individual speakers were included as random factors. The final model is given in Table 4. Positive coefficients in this model indicate more rises, negative coefficients indicate more falls.
Final regression model of rising vs. falling intonation (n = 1602).
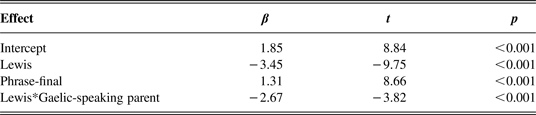
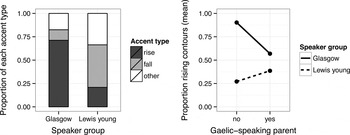
The model shows there are more rising contours in Glasgow than among the Lewis young people. There are also more rising contours in phrase-final position, and there is a significant interaction between speaker group and whether the participant has a Gaelic-speaking parent. Results for the two groups of speakers are shown in Figure 6 (left panel). See Nance (Reference Nance2013) for discussion of the ‘other’ contours in this figure.
Left panel: proportions of rising and falling accents among the younger speaker groups, n = 2,090; Right panel: interaction between speaker group and Gaelic-speaking parent, n = 1,602.

The interaction between speaker group and Gaelic-speaking parent is displayed in the right panel of Figure 6. The figure shows that young people in Glasgow with a Gaelic-speaking parent produced far fewer rising contours than those without a Gaelic-speaking parent. In Lewis, it is the opposite: those with a Gaelic-speaking parent produced more rises. This result appears contradictory, but in fact indicates that those with Gaelic-speaking parents are behaving similar to their counterparts in the other group of speakers. A previous study (Nance Reference Nance2013) found that no young Gaelic speakers use the word-accent system traditionally described for the language (e.g. Ternes Reference Ternes2006). It is potentially the case, however, that those with sustained access to traditional varieties of Gaelic, such as those with a Gaelic-speaking parent, might have acquired the traditional Gaelic pattern of a large variety of rising and falling contours, but might not have acquired the full use of the word-accent system. In other words, those with a Gaelic-speaking parent may be reproducing a relic of the now nonused word-accent system.
PHONETIC RESULTS: SUMMARY
The results suggest that new Gaelic speakers in Glasgow speak differently from traditional older speakers in Gaelic-heartland areas, and also differently from the age-equivalent group of young people in a Gaelic-heartland area. The vocalic analysis shows that Glasgow speakers have backer [ʉ] than Lewis speakers. The analysis of laterals shows phonetic differences between groups of speakers in lateral productions: young people in Glasgow have a lower F2-F1 in alveolar and palatalised laterals, suggesting more tongue backing/raising (‘darker’) productions. The intonational analysis showed that young people in Glasgow produced more rising contours than their counterparts in Lewis. Overall, there is little evidence to suggest that having one Gaelic-speaking parent has any impact on [ʉ] or lateral productions; however, intonation production did pattern with home language background.
DISCUSSION
As stated earlier, this article seeks to investigate the phonetic nature of new Gaelic speakers' speech, and how the particular phonetic characteristics can be explained. The results presented here suggest that new speakers differ from older traditional speakers, both in phonetically gradient terms and also at the level of distinct phonemic/tonemic categories. In this section, I suggest some of the reasons behind the distinct features of new speakers' speech described in this study, and discuss the implications of this study both for Gaelic language revitalisation, and for wider studies of language variation and change.
Explaining the features in new speakers' Gaelic
Previous studies have cited influence of the community-dominant language as a factor explaining phonetic differences in the speech of both new speakers and pupils in minority-language immersion schooling (Harada Reference Harada2006; King et al. Reference King, Watson, Keegan, Maclagan, Rehner and Lockard2009; Morris Reference Morris2013; Nance & Stuart-Smith Reference Nance and Stuart-Smith2013). The data presented here suggest this is also the case among new Gaelic speakers in Glasgow: Glasgow speakers had a lower F2-F1 in alveolar and palatalised laterals than either group of Lewis speakers. Lower F2-F1 suggests more tongue backing/raising (‘darker’ productions), which is widely reported in descriptions of Glasgow English (Wells Reference Wells1982; Macafee Reference Macafee1983; Stuart-Smith Reference Stuart-Smith, Foulkes and Docherty1999; Lambert et al. Reference Lambert, Alam and Stuart-Smith2007; Stuart-Smith et al. Reference Stuart-Smith, Timmins, Alam, Gregersen, Parrot and Quist2011). Similarly, the Glasgow young speakers produced much backer [ʉ] than either group of Lewis speakers. As mentioned earlier, recent research into Glasgow [ʉ] suggests this vowel is now becoming backer than previous generations (Rathcke et al. Reference Rathcke, Stuart-Smith, Timmins and José2012) and that in Glasgow English, backer productions of [ʉ] have been associated with middle class speakers (Macaulay Reference Macaulay1977:39; Stuart-Smith Reference Stuart-Smith, Foulkes and Docherty1999:208). The middle class backgrounds of the Glasgow speakers discussed earlier may explain the slightly backer nature of the Glasgow Gaelic [ʉ] vowels.
The intonation analysis, by contrast, suggests a case of language contact at the phonological level: young people in Glasgow produced significantly more simple rises in penultimate pitch accents, and significantly more rise plateaux in phrase-final position. These intonation contours are very similar to phonological descriptions of Glasgow English (e.g. Mayo Reference Mayo1996; Cruttenden Reference Cruttenden2007; Ladd Reference Ladd2008). Phrase-final rises in declaratives, however, are rare cross the world's languages (Gussenhoven Reference Gussenhoven2004:89). It seems likely, therefore, that language contact with Glasgow English may explain the large number of rising contours in Glasgow Gaelic.
Several previous studies of new speakers have found that home language background has an influence on production of the revitalised language; specifically, young people with parents who speak the language in question are more likely to reproduce traditional structures (Jones Reference Jones1998; Gathercole & Thomas Reference Gathercole and Thomas2009; Morris Reference Morris2013). This study provides only limited evidence in support of this view: young people with one Gaelic-speaking parent did not produce significantly different [ʉ] vowels, and did not produce different patterns of variation in lateral productions, but did produce significantly different intonation patterns. It may be the case that a young person must be brought up by two Gaelic speakers with limited input of English for home language background to make a substantial difference in all areas of the linguistic system (see De Houwer Reference De Houwer2007 for a related discussion). Also, as seen in Sophie's comments in extract (2), having one Gaelic-speaking parent does not necessarily result in monolingual Gaelic input 100% of the time.
THE CHANGING CONTEXT OF BEING A GAELIC SPEAKER
Jones (Reference Jones1998:1) comments that in contexts of language revitalisation, language change can be extremely rapid and widespread. If observed through the apparent-time model of language change (Gauchat Reference Gauchat, Morf and Betz1905; Labov Reference Labov1963), it would appear as though rapid change is taking place in the Gaelic spoken on the Isle of Lewis. As identified above, however, the apparent-time model assumes consistency in the community speaking a particular variety. This is not necessarily the case in the context of Lewis Gaelic, and is not the case in the context of young people's Glasgow Gaelic.
Continuity is present in the fact that young and old speak Gaelic, and can understand one another, but the contexts and fora for language use, and the social situation of the language, are entirely different for the different generations of speakers. The older Lewis speakers grew up in entirely Gaelic-speaking communities, and were monolingual in Gaelic when they started school. This is not the case among contemporary young Gaelic speakers and, unlike in the past, Gaelic is now used as the medium of instruction but rarely in the school playground (Morrison Reference Morrison and McLeod2006; NicAoidh Reference NicAoidh and McLeod2006). Gaelic is now a national minority language with some institutional support, instead of a community majority language with little or no institutional support. Gaelic, therefore, now fulfils entirely different social functions for young and older speakers. This is especially evident in Glasgow, which has no history of a Gaelic-speaking community other than an immigrant one (Withers Reference Withers1998).
Izzie demonstrates how Gaelic is used by young people today in extract (4). This extract is the one example in the Glasgow dataset of a young person admitting to speaking Gaelic voluntarily. During my time at the school in Glasgow I never observed the young people spontaneously using Gaelic outside of the structured environment of their Gaelic-medium lessons. This extract supports my observation that speaking Gaelic to one another is something that Izzie and her friends rarely do. Izzie even says that this one occasion where they decided to speak Gaelic was spòrsail ‘fun’ (line 7). This suggests that speaking Gaelic to one another was a complete novelty, and highlights the rarity of this occurrence.
(4) Interview with Izzie (14:58–15:20)

In such a context of radical social differences between generational varieties, it is not unreasonable to ask whether new and old speakers are speaking the same language. If not, it is problematic to speak of ‘language change’ as studied through the apparent time model. These points have been raised with reference to new speakers of Breton: ‘although both the obsolescent and reviving varieties are termed “Breton”, they are not, strictly speaking, the same language’ (Jones Reference Jones1998:321).
Similar comments are made by Timm (Reference Timm2003:41) and Le Nevez (Reference Le Nevez2006:153). These are strong claims, and perhaps more linguistic and social analysis is needed before such large-scale differences between generations can be fully supported with respect to Gaelic. In the Gaelic context certainly, new speakers are generally recognised by the older community as at least speaking Gaelic; see for example Ciorstaidh's extract below. Ciorstaidh, aged seventy-two at the time of recording, grew up in a very isolated village, which was accessible only by sea or by walking over the mountains. Ciorstaidh received her education at home when the government paid for a teacher to come and live with her family, as they had no other way to access the education system.
(5) Interview with Ciorstaidh (18:03–18:31)
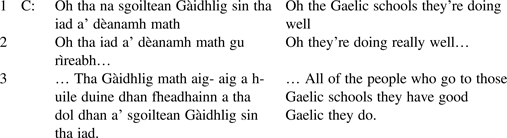
Ina, another older speaker, exhibited a more complex view of the sociolinguistic situation in extract (6) below. Ina spent much of her life as a Gaelic teacher, first in Glasgow and then in Lewis, before retiring. She spent some time in Gaelic-medium primary schools, from where she acquired the impressions to which she refers in this extract.
(6) Interview with Ina (11:42–12:46)

Ina refers to the initial differences between children who had some background in Gaelic before coming to school, and those who had little exposure to Gaelic before immersion schooling. As indicated in this study, by the time pupils are aged thirteen there are few phonetic differences apparent within the peer group, but Ina thinks that there are large differences when pupils enter schooling (line 2). She is, however, pragmatic about the nature of this situation and realises this is one consequence of the revitalisation movement's focus on increasing speaker numbers (line 11). Ina suggests that although there are vast social differences between traditional and new varieties of Gaelic, she still recognises these school pupils as Gaelic speakers, rather than rejecting them entirely (line 12).
The issue of community continuity in apparent time studies is especially salient in contexts of minority language revitalisation, due to the near breakdown in intergenerational transmission. It is difficult to say that the two generations studied here are members of the same speech community, which makes it difficult to conceptualise language change using the apparent-time model. It is clear that ‘Gaelic’ is changing. This is certainly true of its linguistic structure, but also in terms of what it means to belong to a community that speaks this language. Revitalisation contexts bring the issue of community change to the forefront and provide a clear reminder of the inseparability of linguistic structure from social context.
CONCLUSION
The analysis presented here suggests that the vowel [ʉ], laterals and intonation of Gaelic are evolving rapidly. Although only a subset of phonetic features are examined here, there are multiple avenues for future work. For example, anecdotal comments among Gaelic-speakers suggest variation in Gaelic's traditional three phonemic rhotics, that young people do not use Gaelic's traditional nasal vowels, and that traditional dialect variation is no longer widespread. In addition to the phonetic results, the data here indicate that the social context of Gaelic is also evolving extremely rapidly, with different generations using the language in different ways for different purposes. Overall, this study suggests that new speakers use the language differently from previous generations, both in terms of linguistic forms and in terms of the social practices surrounding it. I suggest that both of these factors should be taken into account when speaking of ‘change’ in Gaelic and, potentially, other studies of language change more broadly.
In many ways the findings here suggest a very positive outcome from Gaelic-medium education and revitalisation. At age thirteen to fourteen, there appear to be few linguistic differences between young speakers from a Gaelic-speaking background, and those not from a Gaelic-speaking background: young people are able to use the language and those who do not have a Gaelic-speaking background are not disadvantaged linguistically. By contrast, the data presented here show the fragility of the Gaelic revitalisation program: the young generation of speakers are reliant on the school system for creating a social context where they acquire and use the language. Fishman (Reference Fishman1991) specifically warns against this and while the new speaker paradigm aims to move away from an entirely ‘reversing language shift’ approach to revitalisation, the issue remains that school systems are reliant on political support, which can be very fickle. In the transition from one dominant way of becoming a Gaelic speaker (intergenerational transmission) to another (immersion education), there is still some way to go before new speakers are unconditionally accepted as fully legitimate members of the Gaelic-speaking community (McEwan-Fujita Reference McEwan-Fujita2010; extracts (1) and (6), above). While it seems clear that Gaelic will be socially, geographically, and linguistically different as the new speakers in this study grow up and the older generation passes on, it remains the case that new speakers offer Gaelic a future in the twenty-first century and beyond.
APPENDIX: WORD LIST USED IN THE ANALYSIS OF GAELIC LATERALS