When is intrastate violence a civil war? Case selection criteria is one of the most challenging aspects of quantitatively oriented civil war research. Most scholars would agree that civil wars involve organized armed conflict between a state and domestic political actors which results in fatalities. Determining the appropriate fatality threshold, however, has proven to be a contentious subject in the civil war literature. The most commonly used large-N data sets adopt thresholds that vary from 1000 annual deaths per conflict (Collier and Hoeffler Reference Collier and Hoeffler2004), to 1000 cumulative deaths per conflict (Sambanis Reference Sambanis2000), to 25 annual deaths per conflict (Gleditsch et al. Reference Gleditsch, Wallensteen, Eriksson, Sollenberg and Strand2002). Other scholars adopt coding criteria that require both cumulative totals and yearly averages (Fearon and Laitin Reference Fearon and Laitin2003). Higher death thresholds help set wars apart from other forms of intrastate violence—for example, riots, terrorism, and coups—but it is well known that they also risk excluding conflicts that may be major wars for smaller countries. While a lower death threshold guards against this selection bias, it suffers from an opposite complication: the threshold is so low that it is not limited to civil wars. Faced with these contrary problems, discussion concerned with what qualifies as the “correct” threshold has regularly populated the civil war literature.Footnote 1
While debate has centered on concerns over selection bias arising from the exclusion of low-magnitude conflicts, in this article we highlight an equally pressing methodological concern: causal heterogeneity. Minor and major conflicts often have different origins and manifest in different ways. While studying these varieties of intrastate conflict in tandem may be appropriate for some research questions, doing so can lead to indeterminate or divergent findings when causal mechanisms vary across cases. Thus, rather than search for hard and fast thresholds, we argue that scholars should instead explore their empirical findings across a range of theoretically motivated battle death thresholds. Such an approach can inform the selection of an appropriate threshold that enables testing of a theory’s proposed mechanisms with cases in which they should operate rather than with cases in which they should not. Researchers can then further probe the (im)plausibility of their proposed causal mechanisms by repeating their analyses at battle death thresholds in which their theories should not operate. If results across thresholds do not align with a theory’s observable implications, researchers can refine their theories in ways that better account for variation across different types of conflict.
In developing these arguments, we make three contributions. First, we uncover the extent to which existing research analyzes minor and major conflicts in the same empirical models and identify the consequences of doing so. In a survey of the civil war literature, we find that, to date, less than a quarter of published articles examine their results at both low and high thresholds. The small minority of articles that do examine their results in this way highlight why not doing so is problematic: nearly half report that their results changed at different thresholds, suggesting that low and high-magnitude conflicts often exhibit dissimilar causal patterns. Thus, while the “threshold problem” may be implicitly recognized by researchers studying political violence, it is regularly ignored in practice.
Second, we demonstrate that examining empirical results across a range of theoretically motivated battle death thresholds is a tractable way for scholars to begin addressing concerns about causal heterogeneity. In particular, we re-assess the relationship between drugs and civil war intensity, which we suspect manifests in different ways in minor and major conflicts. To date, existing micro-level studies have found a positive association (Angrist and Kugler Reference Angrist and Kugler2008; Piazza Reference Piazza2012; Dube and Vargas Reference Dube and Vargas2013); large-N cross-national studies suggest a negative relationship (Lujala Reference Lujala2009); and comparative case studies have found mixed results (Ross Reference Ross2004). We help to resolve these divergent findings by explicitly evaluating which cases of intrastate conflict should be affected by drug cultivation and which cases should not. We demonstrate that, despite claims to the contrary, drug cultivation inside the conflict zone has little effect on total battle deaths; rather, the connection between drug cultivation and conflict intensity operates through duration, namely by prolonging civil wars.
Third, we expand upon existing work and develop a dynamic theory that emphasizes the endogeneity of rebel groups’ decisions to turn to drug cultivation during civil war. We argue that rebels in small and/or brief conflicts have neither the opportunity nor incentive to use drug cultivation to finance their war effort. Precisely because gaining control of a narcotics industry is a difficult and time-consuming endeavor, only rebels fighting in larger conflicts, which require sustained or large-scale financing, will have the incentives and capacity to invest the resources needed to establish and sustain profitable drug cultivation. However, once rebels have turned to drug production as a revenue base, it can increase conflict duration by bolstering their fighting capacity and by providing new incentives for rebels to resist negotiated agreements.
The remainder of the article proceeds as follows. We first survey the threshold criteria employed in the existing civil war literature. We show that few articles examine their empirical findings across low and high thresholds, and we demonstrate the significance of this omission for existing research. Next, we describe the mechanics and utility of our varying battle death threshold approach and test the proposition that drug cultivation plays different roles in minor versus major conflicts. Leveraging the empirical anomalies we uncover, the paper proceeds to make two arguments: one methodological, one theoretical. We first present the methodological implications underlying our empirical findings and highlight why common sensitivity analyses are unable to account for causal heterogeneity across different types of conflict. We then develop a dynamic theory that emphasizes the endogeneity of rebel groups’ decisions to turn to drug cultivation during civil war.
Battle Death Thresholds and Varieties of Intrastate Conflict
While the battle death threshold debate has centered on concerns over selection effects arising from the coding criteria employed to define a civil war, we highlight an equally pressing concern: minor and major conflicts often stem from different underlying causes and develop in different ways. Consequently, it is important that researchers account for the fact that political violence can take many forms—for example, riots, border raids, coups, or civil wars. Studying these varieties of intrastate conflict together may be appropriate for some research questions, but can lead to indeterminate or divergent findings when causal mechanisms operate differently in minor and major conflicts.
For a sense of the variety of threshold criteria employed in the existing literature and the extent to which these different thresholds influence empirical findings, we conducted a survey of all quantitatively oriented articles studying civil war published between 2000 and 2013 in four leading political science journals: American Political Science Review, International Organization, Journal of Conflict Resolution, and Journal of Peace Research.Footnote 2 We included all articles that study any aspect of civil war or civil conflict and that analyze cross-national data sets.Footnote 3 We identified 158 articles which employed 23 different threshold criteria.Footnote 4
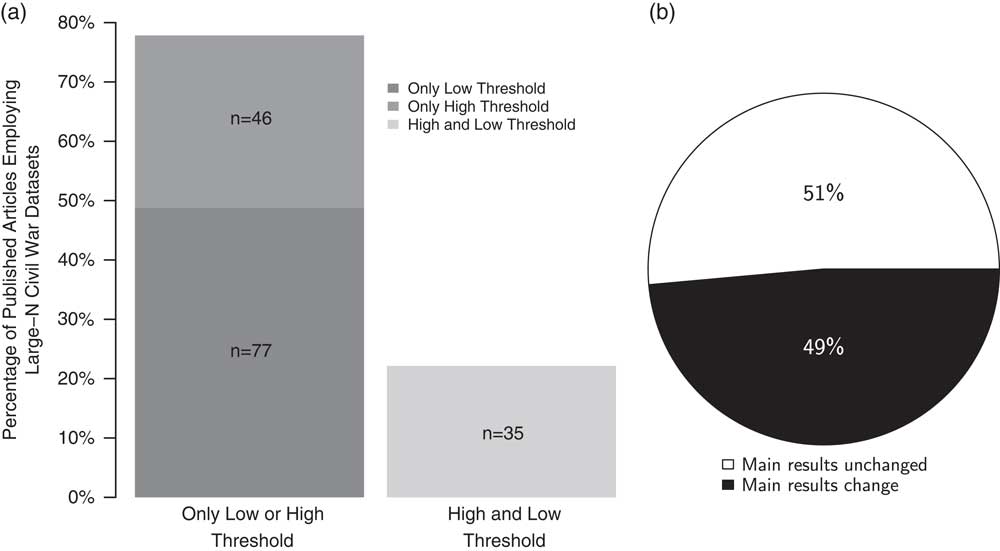
While there may be an implicit recognition among scholars that different thresholds capture different varieties of conflict, our survey finds that existing research often does not take these differences into account—and that the consequences of this omission are significant. As shown in Figure 1, only 35 articles (22 percent) examined the robustness of their results across low (<1000 battle deaths) and high (≥1000 battle deaths) thresholds.Footnote 5 More importantly, our survey found that, of the minority of articles that did examine their results in this way, 17 (49 percent) reported that their results changed substantially at different thresholds. This finding is consequential: it demonstrates that minor and major conflicts may exhibit different causal patterns and suggests that testing theories across different thresholds stands to improve both the theoretical and empirical foundations of existing research.
Survey of quantitatively oriented civil war research articles in American Political Science Review, International Organization, Journal of Conflict Resolution, and Journal of Peace Research from 2000 to 2013 (a) Breakdown of articles using high, low, or both thresholds (b) Breakdown of how often results changed for the articles that tested their findings at a high and low threshold

To illustrate these points, we turn to an often-studied relationship within the civil war literature that we suspect is particularly sensitive to different thresholds—the impact of drug cultivation on conflict dynamics and outcomes. While drug cultivation no doubt plays an important role in financing and even institutionalizing some conflicts, we would not expect drug cultivation to impart similar effects on long-term, high-magnitude conflicts such as civil wars as they do on short-term, low-magnitude conflicts such as coups. Certainly, both civil wars and coups can be classified as “intrastate conflicts,” but theoretically, the suggestion of uniform causal effects seems implausible. While drug production can serve an important economic function in protracted civil wars, it is unlikely that coup leaders would even consider drug production as an effective way to overthrow a government in a putsch.Footnote 6
We argue that this reasoning explains the divergent findings connecting drug cultivation and civil war intensity in the existing literature. To date, the empirical evidence has been mixed and inconclusive. For example, Angrist and Kugler (Reference Angrist and Kugler2008) study the consequences of an exogenous increase in coca prices and cultivation in Colombia to estimate the effect of coca production on violence. They show that departments that increased coca cultivation in response to price increases also saw increases in violent death rates. These results are complemented by Dube and Vargas (Reference Dube and Vargas2013), who replicate Angrist and Kugler’s finding at the municipal level and confirm the link between coca production and violence. Similar findings have been identified in other countries and with other types of narcotics. Piazza (Reference Piazza2012), for example, shows that Afghan provinces that produce higher quantities of opium experience higher rates of attacks and casualties.
Yet, these subnational results that connect drug cultivation to increased conflict intensity have been challenged by other studies that identify the opposite relationship. For example, in an article examining all civil wars fought between 1946 and 2002, Lujala (Reference Lujala2009) uncovers a negative relationship between drug cultivation and conflict intensity and total battle deaths. And while Ross (Reference Ross2004) finds that drug cultivation led to resource battles that increased the casualty rate in the conflict in Peru, he also identifies “cooperative plunder” of drug resources in Burma—that is, intermittent cooperation between combatants for the purposes of mutual exploitation of illicit narcotics.
How can we make sense of these divergent findings? In the following section, we illustrate that the relationship between drug cultivation and conflict intensity is not the same in minor and major conflicts. We then explicate why such divergence exists and present a theory that explains our findings by explicitly identifying which types of conflict drug cultivation should affect and which types it should not.
Reassessing the Link Between Drug Cultivation and Conflict Intensity
We examine the proposition that drug cultivation plays different roles in minor versus major conflicts by exploring the effect of varying the battle death threshold from a lower bound of 25 battle deaths to an upper bound of 1000+ battle deaths in increments of 25.Footnote 7 The lower bound of 25 battle deaths is the well-known threshold adopted by the UCDP/PRIO Armed Conflict Dataset, while the upper bound of 1000+ battle deaths reflects the widely applied coding rule that distinguishes “armed conflicts” from “civil wars” (Gleditsch et al. Reference Gleditsch, Wallensteen, Eriksson, Sollenberg and Strand2002).
The data we employ, compiled by Lujala (Reference Lujala2009), supplement the Armed Conflict Dataset with a geolocated, conflict-level measure of drug cultivation in the conflict zone. These data are of far greater theoretical and empirical utility than country-level measures as they record the presence (or absence) of resources within the geographic zone of a conflict, enabling us to test whether or not the rebels could actually capitalize on drug cultivation if they decided to do so. The data set covers the period 1946 through 2002 and includes all civil conflicts with at least 25 battle-related deaths.Footnote 8
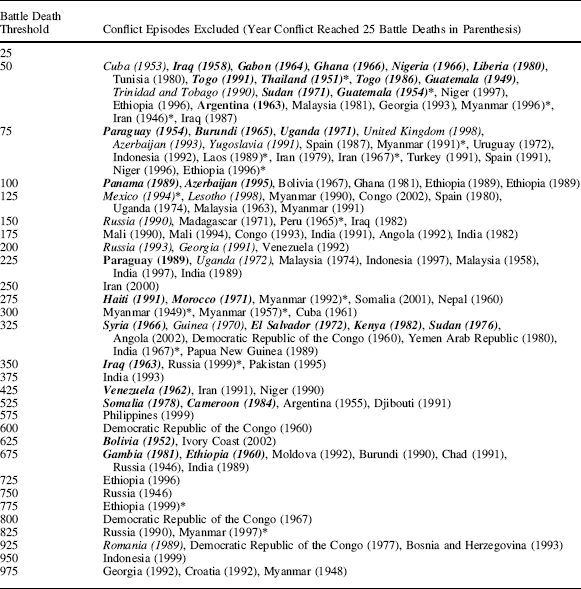
While varying the battle death threshold does not capture all of the features that characterize different forms of political violence, it does capture coarse distinctions between minor and major conflicts. To demonstrate this point, Table 1 lists the conflict episodes excluded at each threshold—conflicts with drug production are marked with an asterisk. As a simple illustration of the distinctions battle death thresholds can capture, we have bolded all coups and italicized all conflicts that lasted less than one month. The table reveals that a number of observations included in the UCDP/PRIO Armed Conflict Dataset at lower battle death thresholds are either coups that did not become major conflicts or very brief periods of violence that did not develop into civil wars, and that our tractable approach can detect these different types of conflict. Because drug cultivation is unlikely to play any role in these cases, we expect their inclusion will generate divergent or indeterminate findings that depend on the specified model to extrapolate relationships not found in the data.
Conflict Episodes Excluded at Each Battle Death Threshold

Note: Bolded observations are coups as per Powell and Thyne (Reference Powell and Thyne2011) and italicized observations lasted less than one month. Asterisks represent episodes with drug production in the conflict zone. Only thresholds which resulted in additional observations being removed are shown.
To investigate how varying the battle death threshold affects the relationship between drug cultivation and conflict intensity we follow existing studies and define intensity as follows:
 $$Conflict\,Intensity{\,\rm {\equals\,}}{{Total\,\,Battle\,\,Deaths} \over {Conflict\,\,Duration}}$$
We investigate total battle deaths (the numerator) and then conflict duration (the denominator) in turn. For each component, we explore whether the relationship with drug cultivation changes across battle death thresholds. While we find that drug cultivation has little effect on total battle deaths after excluding minor cases of political violence, we find evidence that drug cultivation prolongs the duration of larger conflicts.
Total Combat Deaths
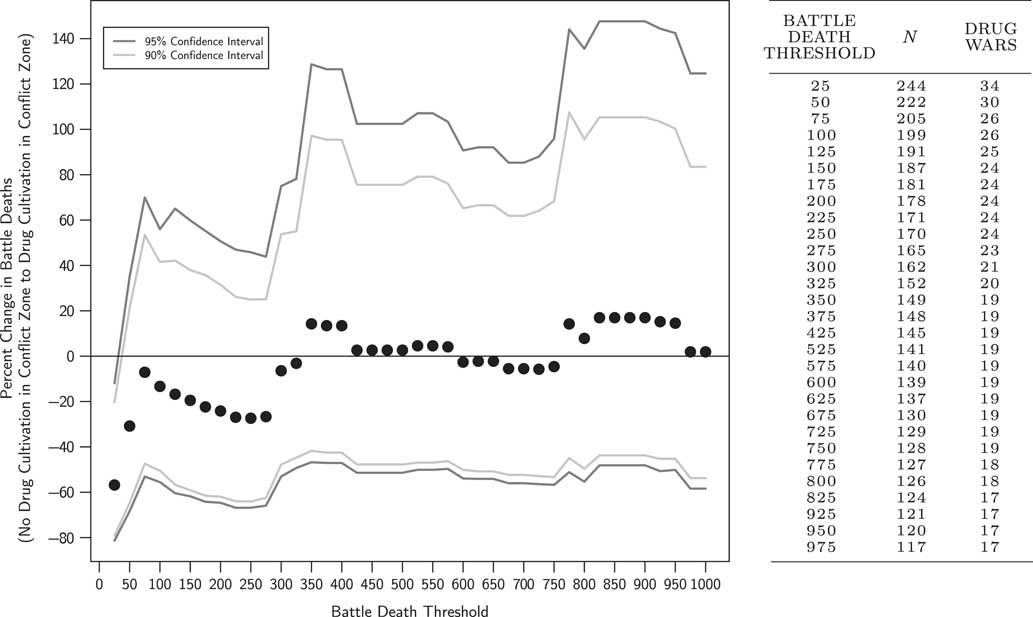
We begin by studying the relationship between drug cultivation within a conflict zone and total battle deaths. We employ least squares regression with total combat deaths (logged) as the dependent variable, a binary indicator of drug cultivation in the conflict zone as the explanatory variable, and a rich set of controls.Footnote 9 We run our analysis at each battle death threshold and use the regression results to simulate the percentage change in total battle deaths when moving from conflicts without drug cultivation in the conflict zone to those with drug cultivation.Footnote 10 Figure 2 provides a visual summary of our results, along with their estimated uncertainty, at each threshold.Footnote 11
Simulated percentage change in total battle deaths (from no drug cultivation to drug cultivation) at varying thresholds Note: The accompanying table lists the thresholds that resulted in more observations being removed.

In line with existing large-N studies, we find drug cultivation in the conflict zone to be associated with a 60 percent reduction in total battle deaths when employing a 25 battle death threshold inclusion criterion—a statistically and substantively significant relationship. However, this correlation does not hold when conflicts with <50 total battle deaths are excluded. Indeed, at thresholds >25 total battle deaths, the 90 and 95 percent confidence intervals cross 0. More importantly, these confidence intervals expand rapidly as the battle death threshold increases, indicating rising uncertainty. What is more, the estimated impact of drug cultivation becomes unstable, first decreasing in magnitude, and then even switching signs to show a positive association.
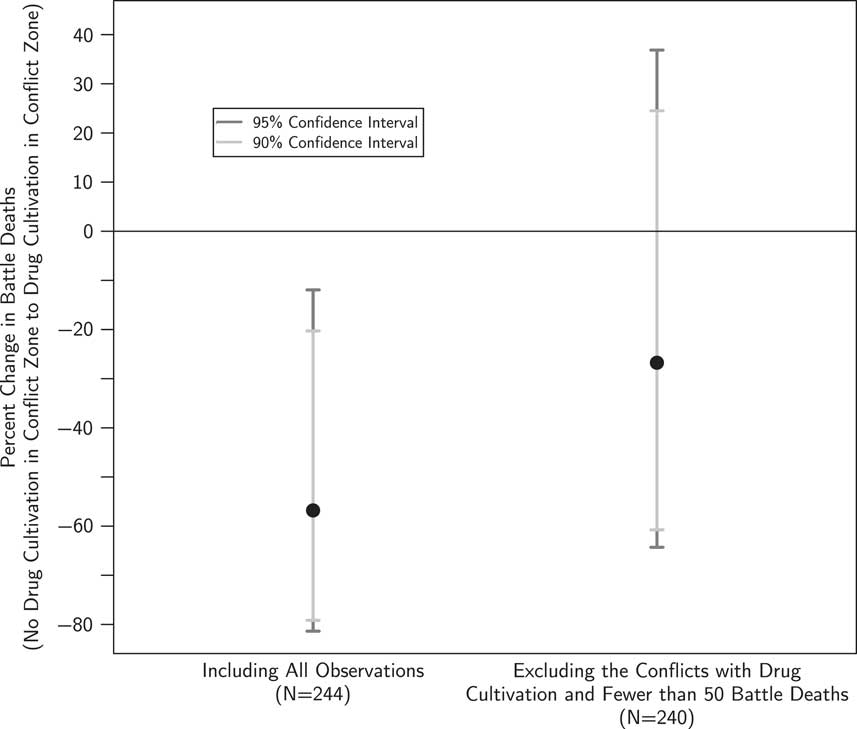
The dramatic instability of the results at different thresholds provides evidence that including coups, brief periods of violence, or other minor conflict episodes in an analysis of the relationship between drug production and conflict intensity renders results dependent on model-driven extrapolations that are not supported by the data. In fact, as we demonstrate in Figure 3, simply excluding the four observations with drug production and <50 battle deaths—two of which were coups lasting less than one month—makes the relationship between drug cultivation and conflict magnitude statistically insignificant while nearly halving the size of any substantive relationship.Footnote 12 In other words, the conflicts with the least theoretical relevance are responsible for the empirical correlation found between drug production and civil war magnitude at the 25 battle death threshold.
Comparing the simulated percentage change in total battle deaths (from no drug cultivation to drug cultivation) when including all conflicts in the analysis versus when excluding the four observations that have drug cultivation and <50 battle deaths from the analysis

One of the cases with drug production in the conflict zone that we exclude, an attempted coup by naval officers in Thailand from June 29–30, 1951, underscores this point. During a ceremony handing over the USS Manhattan to the Royal Thai Navy, naval officers kidnapped the Thai Prime Minister in an attempt to take control of the government. The result was a firefight aboard the Manhattan and another naval vessel as the Prime Minister escaped by swimming to shore. This coup was put down quickly by the Thai Army and Air Force (Chaloemtiarana Reference Chaloemtiarana2007, 39–42). While this episode played an important role in Thai politics in the following years, there is no evidence that drug production played any role in the coup.
One potential limitation of varying battle death thresholds is the inevitable loss of statistical efficiency inherent in dropping observations when increasing thresholds. However, in the case at hand, this scenario seems unlikely given that simply removing four observations nullifies any relationship between drug cultivation and civil war magnitude. Moreover, as shown in the table accompanying Figure 2, shifting to a threshold of 50 battle deaths only excludes 22 of 244 conflicts (of which only four had drug cultivation). Even at the 1000 battle death threshold, nearly half of the original observations remain, 17 of which are conflicts with drug cultivation. Note also that the ratio of conflicts with drug cultivation to those without stays consistently between 11 and 14 percent across all thresholds.
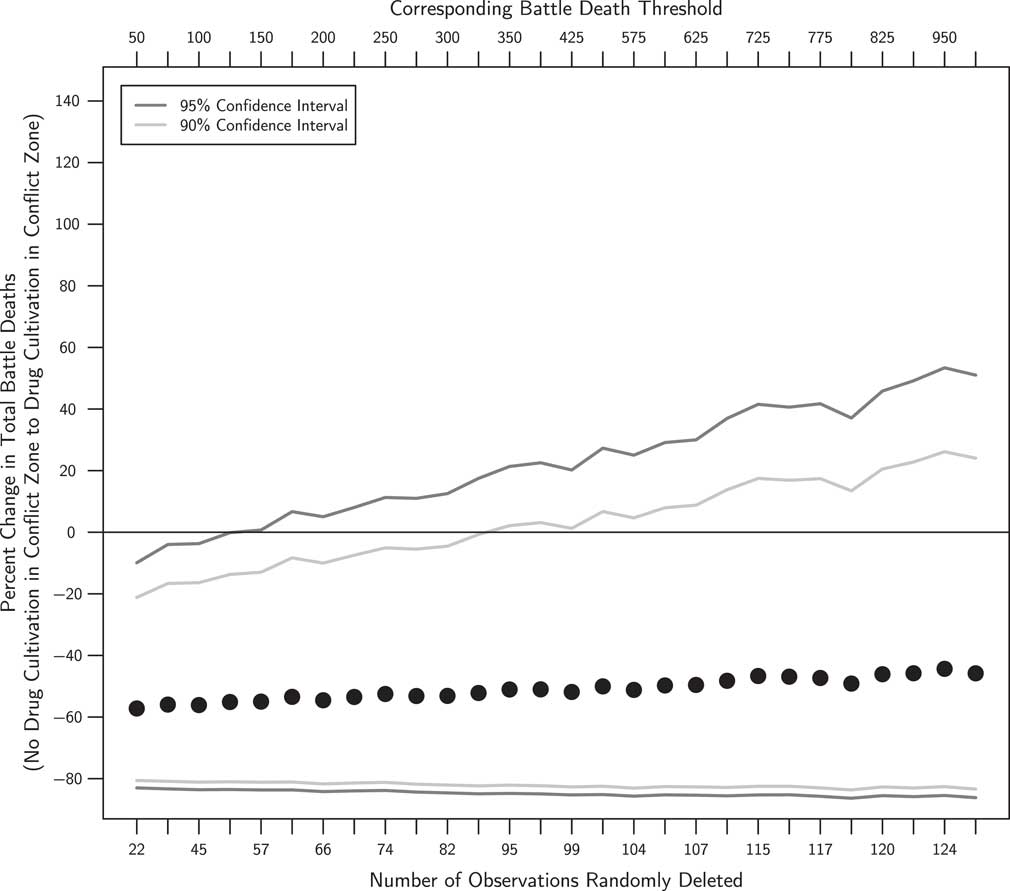
Nonetheless, we address efficiency concerns more rigorously by simulating the effect of simply dropping observations. To do this, we randomly remove the equivalent number of observations excluded by each threshold 1000 times and re-run the above analyses at each threshold.Footnote 13 For example, to account for the fact that moving from the 25 to the 50 battle death threshold excludes 22 observations, we simulate 1000 data sets in which 22 observations have been randomly deleted from the original data set and then assess the relationship between drug cultivation and conflict magnitude for each of those 1000 data sets. Figure 4 presents the simulated mean percentage change estimates when moving from a conflict without drug cultivation to one with drug cultivation using each of the 1000 randomly simulated data sets at each threshold.
Simulated percentage change in battle deaths (from no drug cultivation to drug cultivation) when randomly deleting observations to accord with the number of observations excluded by each threshold Note: Each point estimate represents the mean of 1000 randomly simulated data sets.

The stark differences between the pattern uncovered in Figure 2 and that in Figure 4 confirms that the lack of a relationship we observe between drug cultivation and total battle deaths across different battle death thresholds is systematically driven by varying the threshold, not by a loss of statistical efficiency from dropping observations. Unsurprisingly, removing observations does result in a slight increase in uncertainty; however, in comparison with Figure 2, the percentage change in total battle deaths remains stable at approximately −60 percent, rather than fluctuating markedly, and the confidence intervals expand slowly and remain comparatively close to 0, rather than expanding both rapidly and widely.
Taken together, the above findings suggest that there is no generalizable relationship between drug cultivation in the conflict zone and total combat deaths. Conflicts with and without drug cultivation tend to generate equivalent numbers of combat deaths, on average. Notably, this result is obscured with a strict 25 battle death threshold, but is revealed when one accounts for potential dissimilarities between conflicts of varying sizes.
Conflict Duration
If drug cultivation has little effect on total combat deaths, how can it influence conflict intensity? Recall that conflict intensity is a measure of total battle deaths (the numerator) and conflict duration (the denominator). Thus, if drug cultivation has any effect on intensity, we would expect it to operate through duration. Furthermore, if there is a duration effect, we would expect the relationship between drug cultivation and intensity to diminish once controlling for duration.
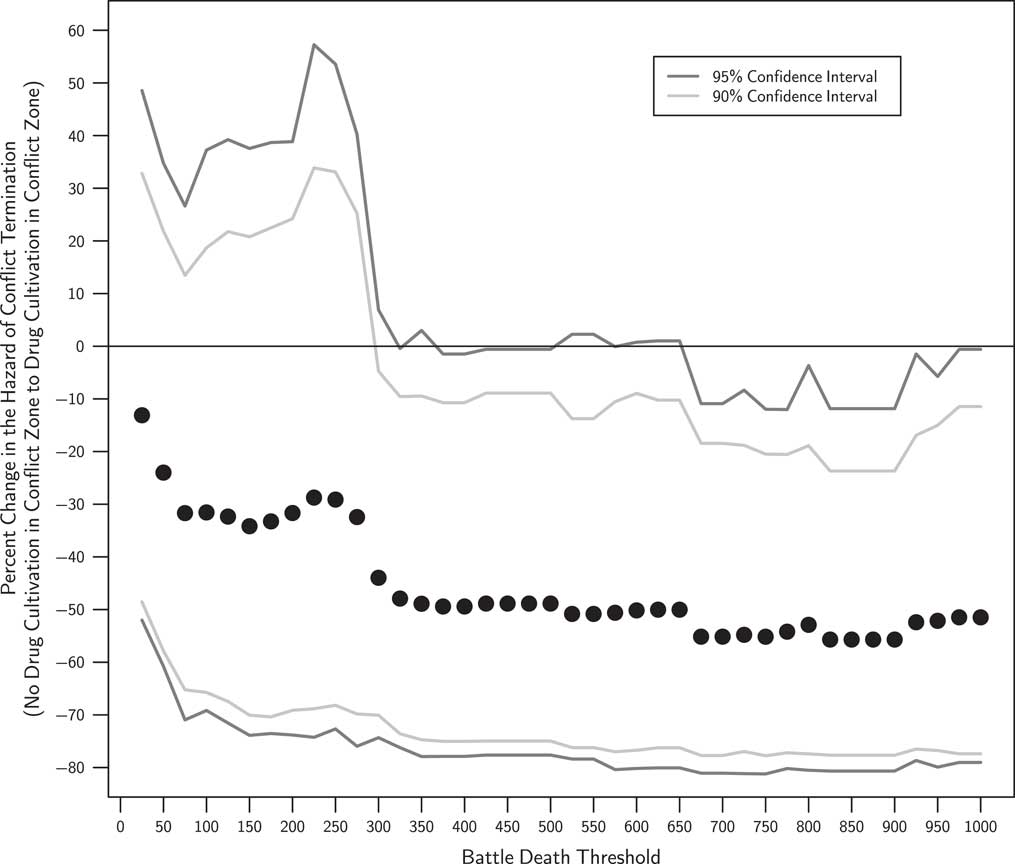
We test the duration channel across varying battle death thresholds by employing a semi-parametric Cox proportional hazards model. Here we include drug cultivation in the conflict zone as the treatment indicator and a range of control variables drawn from the civil war duration literature.Footnote 14 Following the same procedure as the previous section, we run analyses at each battle death threshold and use the regression results to simulate the percentage change in the hazard of a conflict ending when moving from conflicts without drug cultivation to those with drug cultivation. Figure 5 plots the results.Footnote 15
Simulated percentage change in hazard of conflict termination when moving from conflicts with no drug cultivation to conflicts with drug cultivation across varying thresholds

While there is uncertainty in the duration estimates at lower thresholds, a clear and increasingly precise pattern emerges at higher battle death thresholds: once reaching the 300 battle death threshold, estimates become consistent and the confidence intervals tighten appreciably despite the decreasing number of observations.Footnote 16 The substantive effect of these estimates is large: drug cultivation in the conflict zone decreases the hazard of a civil war coming to an end by an average 52 percent relative to conflicts that did not have drug cultivation in the conflict zone. This suggests that while drug cultivation has little effect on total battle deaths, it may influence conflict intensity by prolonging conflicts.
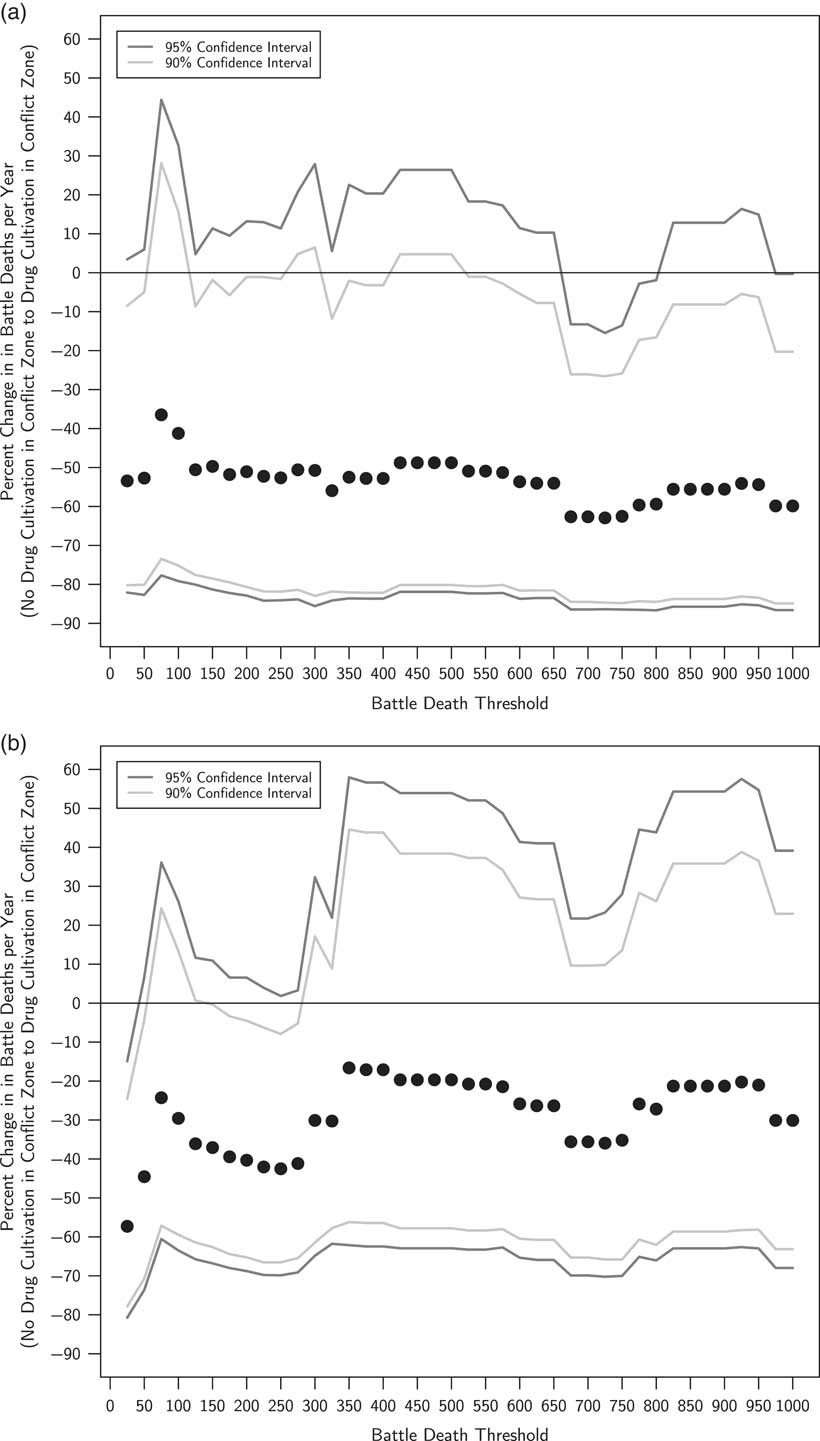
To confirm that the duration effect is driving the correlation between drug cultivation and conflict intensity, we test whether the relationship between drug cultivation and intensity diminishes when controlling for duration. If our contention is correct, then controlling for duration should lessen any relationship between conflict intensity and drug cultivation, while also rendering that relationship less precise. We test this by first examining the relationship between drug cultivation and intensity without controlling for duration. Employing least squares regression, we run analyses at each battle death threshold and use the regression results to simulate the percentage change in conflict intensity when moving from conflicts without drug cultivation in the conflict zone to those with drug cultivation.Footnote 17 Figure 6 presents a visual summary of our results.
Simulated percentage change in conflict intensity due to drug cultivation at varying thresholds (a) Excluding duration control (b) Including duration control

In line with existing large-N cross-national studies, Figure 6(a) shows that drug cultivation is associated with a reduction in conflict intensity of ~60 percent. This result is statistically significant at the 10 percent level across most battle death thresholds and grows stronger at higher battle death thresholds. However, Figure 6(b) shows that once we control for duration in our analyses, there is a markedly different pattern: the size of the effect of drug cultivation diminishes once passing the 50 battle death threshold. Moreover, both the 90 and 95 percent confidence intervals cross 0 after passing the 300 battle death threshold.Footnote 18 This provides clear evidence that there is no relationship between drug cultivation and intensity independent of the duration channel.
In sum, cases with drug cultivation do not generate fewer total battle deaths than cases without drug cultivation—but they do seem to take longer to inflict those fatalities. While varying the battle death threshold revealed that minor conflicts were driving the correlation between drug cultivation and conflict magnitude, the same approach uncovers the presence of a relationship between drug cultivation and duration when those same conflicts are excluded. In both cases, the strict application of a threshold that is either too high or too low obscures these empirical patterns.
Causal Heterogeneity Across Battle Death Thresholds
The preceding section illustrates that the relationships between drug cultivation and total battle deaths, duration, and intensity change at different battle death thresholds. Our empirical findings support the intuition that the indeterminacy of the existing literature linking drug cultivation to civil war intensity is at least partly the product of variation in the types of violence analyzed in these studies. When conflict observations generated from different underlying processes exhibit different causal patterns—in other words, when there is causal heterogeneity in the population under study—conclusions drawn from their comparison are extrapolations with little empirical basis.
Importantly, a failure to account for causal heterogeneity across different types of conflict renders many common robustness tests ineffective. For example, scholars often seek to guard against the threat of model-dependent inference by excluding statistical outliers or including additional covariates, interaction terms, or fixed effects, and then assessing how much their findings change. However, such analyses are often insufficient tests of the robustness of empirical findings; we must not only show that it is possible to find results consistent with ex ante hypotheses, but also ensure that the inferences we draw are supported by the theoretical logic we are testing and the empirical evidence we are analyzing (King and Zeng Reference King and Zeng2005). While results in the civil war literature are often robust to the exclusion of statistical outliers, they may not be robust to the exclusion of “theoretical outliers.” As noted above, simply excluding the four least theoretically relevant conflicts—those with drug production and <50 battle deaths—nullifies the link between drug production and total battle deaths.
More sophisticated analyses attempt to address robustness concerns by employing matching techniques to ensure balance on observed covariates. Matching is an important data pre-processing technique that can help to ameliorate model dependence, namely by “pruning” (i.e., dropping) or weighting observations that fall outside of common support. However, matching is not a method of estimation—it must be paired with some analysis method (Ho et al. Reference Ho, Imai, King and Stuart2007). As a result, while a powerful tool for the purposes of maximizing balance on observed covariates, matching in and of itself cannot account for causal heterogeneity when different subpopulations (in our case, different types of conflict) are analyzed in a single linear model. Thus, even if a researcher employs matching to balance observed covariates across treated (drug) and control (non-drug) cases, the average treatment effect reported by a given model for a sample that includes both coups and civil wars will obscure the fact that drugs play no role in the former subpopulation, but a potentially critical role in the latter. Indeed, the causal heterogeneity we identified above is not ameliorated when we employ matching methods to pre-process our data at the 25 battle death threshold: the model-dependent relationship between drug cultivation and total battle deaths persists, while the link between drug cultivation and duration is obscured.Footnote 19
In short, common techniques that scholars employ to check the robustness of their findings are often unable to account for causal heterogeneity. Consequently, when working with observational data (as most conflict researchers must), removing observations that are outside the scope conditions of a theory can serve as an important first step in reducing both the bias and variance of estimates. This approach may sound peculiar given the often-heard prescription to “increase the size of your N,” but sample variance is a function of both sample size and unit heterogeneity.Footnote 20 While it is true that increasing the sample size will often help to reduce sampling variability, it does not ameliorate concerns about unobserved bias. Thus, “when bias from non-random assignment is possible, sharper conclusions are possible from a smaller, less heterogeneous study than from a larger, more heterogeneous study” (Rosenbaum Reference Rosenbaum2005, 150).
In accordance with this reasoning, we have uncovered the existence of causal heterogeneity using a simple, tractable approach that employs different battle death thresholds as rough approximations of different varieties of conflict. While varying battle death thresholds may not capture all the theoretical differences and distinctions that exist across the many forms of political violence, such an approach can provide civil war researchers with a baseline from which they can consider how the theories they are developing relate to the data used to test them. This baseline analysis may help scholars identify more fitting ways to explore their data, such as employing non-parametric models, running analyses on subsets of the data, or investigating interactive relationships between causal variables and different types of conflict.
Beyond helping to select the appropriate cases to evaluate existing theories, seeking to understand and account for the heterogeneity of large-N civil war data sets also positions scholars to refine their theories in ways that better account for variation across different types of violence. Our analysis has engaged with this heterogeneity by evaluating existing empirical findings across different battle death thresholds. In the following section, we show how our results can be used to refine existing explanations linking drug cultivation and civil war by precisely specifying in which types of conflicts proposed causal mechanisms should be operative and in which they should not.
Connecting the Dots: A Dynamic Theory of Drug Cultivation and Civil War
The above empirical findings, in tandem with the existing literature on the relationship between drugs and civil war, beg for an explanation. We find that drug cultivation has little effect on total battle deaths, yet we identify a link between drug cultivation and civil war duration. Other research indicates that illicit drugs are not linked to the onset of civil war, but that the production of opium and coca lengthened conflicts once they broke out (Ross Reference Ross2004).Footnote 21 The drugs-duration link has also been identified in studies that show that wars with rebels who rely on contraband financing (such as trade in cocaine and opium) have longer average durations than wars with rebels who do not (Fearon Reference Fearon2004).Footnote 22
Taken together, these results highlight a puzzling relationship between drugs and civil war: while the presence of drug production in conflict zones has no effect on the outbreak of conflicts, nor on their magnitude, it does seem to increase conflict duration. Why might this be the case? In this section, we argue that drug production has an endogenous relationship with civil war—an argument that helps us account for all three findings.
The economics of conflict literature draws our attention to the interaction of political and economic agendas during civil conflicts. As Keen (Reference Keen2000, 22) explains, war is not “simply a breakdown in a particular system,” but “the emergence of an alternative system of profit, power, and even protection.” Civil conflicts not only destroy the formal economy; they can foster war economies as well. These economic consequences of civil war have been extensively studied in the economics and political science literatures.Footnote 23 For our purposes, the key takeaways from this research include the following: (1) as a civil war rages on, it changes incentive structures that alter production decisions, producing losers (legal industries) but also winners (illegal industries) and (2) the incentives to produce illegal products tend to increase as a function of time and the destructiveness of the war.
Building off this literature, as well as research on violent non-state actors and organized crime, Le Billon (Reference Le Billon2001, 578) and Cornell (Reference Cornell2005, 753) have proposed a “criminalization” process and a “crime-rebellion nexus,” whereby insurgents come to recognize the profit potential of involvement in the production and/or distribution of illicit goods over the course of a conflict. Both scholars highlight the end of the Cold War and the subsequent reduction in external financing for insurgent movements with a shift to alternative sources of rebel funding. We agree that the sudden and exogenous collapse of Warsaw Pact financing and support should play a central role in the crime-rebellion nexus model, but wish to emphasize that economic constraints of any kind should motivate the search for new funding opportunities.
Notably, information about resource needs is rarely revealed immediately after the onset of war; uncertainty persists for some time after conflict is initiated. As Staniland observes, it is common for insurgents to “miscalculate their future needs when engaged in prewar political mobilization. They are often surprised by the onset of protracted insurgency even if they expected some form of conflict” (Reference Staniland2012, 154). Informational approaches to bargaining and war explain why: a civil war is not a discrete event, but rather a series of battles, the outcomes of which reveal information to the actors involved (Powell Reference Powell2004). As insurgent groups win or lose battles, they update their beliefs about their chances of winning the conflict and adjust their expected resource requirements accordingly. This process can identify gaps between resource requirements, on the one hand, and resource supplies, on the other, motivating insurgent groups to seek out alternative resource bases.
Entrance into the narcotics industry is one way to fill resource gaps. Drugs enjoy high value-to-size and value-to-weight ratios; they are a renewable resource; they are relatively easily transported by small numbers of individuals; and they are a consistently high-demand product on the international market. The revenues drugs generate can help pay fighters, acquire weapons, and supply public goods to local populations. They thereby overcome human and material resourcing problems, increase an insurgent group’s capabilities vis-à-vis the government, and help to further a rebel group’s objectives.
However, gaining control of a domestic drug industry is not easy: it takes significant investment, effort, and time. It requires rallying a labor force to cultivate crops or refine plants; it requires a tax collection capacity; it requires establishing (or gaining control of pre-existing) distribution networks; and it requires the capabilities necessary to conquer territory and defend it against government incursions.Footnote 24 Given these costs, it seems highly unlikely that drug cultivation would be a feasible strategy for a small and/or inexperienced rebel group. Only those groups that have already engaged in sufficient levels of conflict with government forces, have acquired information on the battlefield about power asymmetries and resource requirements, have taken control of territory, and have acquired the capability to hold that territory for an extended period of time would be expected to be willing (and able) to turn to drug cultivation as a resource base.
Precisely because rebels often need to recalculate their resource requirements after the initiation of a conflict, and because gaining control of a narcotics industry is a difficult and time-consuming endeavor, we expect that drug cultivation by rebel groups is an endogenous feature of civil war. That is, rebel groups turn to drug production if they require additional sources of financing to continue fighting a conflict in which they are already engaged.Footnote 25
If drug production does not affect the risk of civil war onset, nor predict a civil war’s magnitude, why might it prolong civil war duration? As Cornell (Reference Cornell2005, Reference Cornell2007) observes, involvement in illegal drug production and distribution not only overcomes a rebel group’s resource shortages vis-à-vis government forces, but can also change underlying motivational structures of insurgent groups. The case study evidence he musters suggests that involvement in the drug trade can often affect a rebel group’s core goals and objectives in important ways, not least by creating a new economic function of war. These economic functions affect conflicts not only through the “looting mechanism”Footnote 26 often pointed to in studies connecting natural resources to civil war, whereby resource wealth increases the duration of war by providing funding to the weaker side, but also the “incentive mechanism,”Footnote 27 whereby resource wealth increases the duration of civil war by offering combatants financial incentives to oppose a peace settlement. In other words, it is not just that drug production can provide insurgents with new sources of finance; entrance into the illegal economy can “mutate the motivations of originally ideologically motivated insurgents” (Cornell Reference Cornell2005, 755).
One example of an insurgent group undergoing motivational change is the Fuerzas Armadas Revolucionarias de Colombia (FARC). The FARC is often portrayed as the quintessential “greedy” rebel group, renounced by Western governments as a “narco-terrorist” organization. Yet, the FARC’s origins lie in genuine grievances against the Colombian state, forged in the agrarian and partisan struggles of La Violencia (1946–1958). When first formed in 1966 as a small peasant self-defence organization, the FARC’s leadership demanded land reform, rural development, and political participation for their followers. Notably, these demands came decades before the coca/cocaine export boom in Colombia, and indeed, the FARC did not enter the illicit crop business until the late 1970s (Sanín Reference Sanín2004). The group’s original grievances have not disappeared, and as Chernick’s (Reference Chernick2007, 60) analysis on the Colombian conflict highlights, the group “has been consistent in its demands throughout the course of the war.” However, we suggest that entrance into an illegal industry that generates millions of dollars in yearly profits will have important effects on the motivations and incentives of individual soldiers, local commanders, and/or the group as a whole via the generation of new economic functions of war. This is not to reduce the FARC’s struggle to a purely greed-driven “drug war,” but rather to highlight that participation in the illicit drug industry influences the agendas and strategies of the Colombian conflict’s belligerents in ways that have affected the dynamics of the war.
The incentive mechanism is particularly crucial in explaining the link between drugs and civil war duration. As Ross explains, “if commanding officers believe that peacetime profits would be greater than wartime profits, it could help induce them to reach a settlement” (Reference Ross2004, 44). But in the case of drugs, it is highly unlikely there will be peacetime drug profits to be shared (Humphreys Reference Humphreys2005, 516–7). Instead, government forces are likely to seek the total eradication of the narcotics industry, aiming to stem the violence and criminality associated with the drug trade, as well as shed the international opprobrium that comes attached with the pejorative label of “narco-state.” Of course, rebel groups entering negotiations will be aware of these overarching government objectives and bargain accordingly. Even in the improbable event that a government would agree to allow insurgents to retain control of a domestic drug industry, and even if a government would not renege on that deal, a rebel group would be highly likely to expect them to renege and hence be more hesitant to sign a lasting peace accord. Consequently, we would expect a classic commitment problem, where mutually preferable bargains are unattainable because the state would have an incentive to renege on the terms of a negotiated deal.Footnote 28
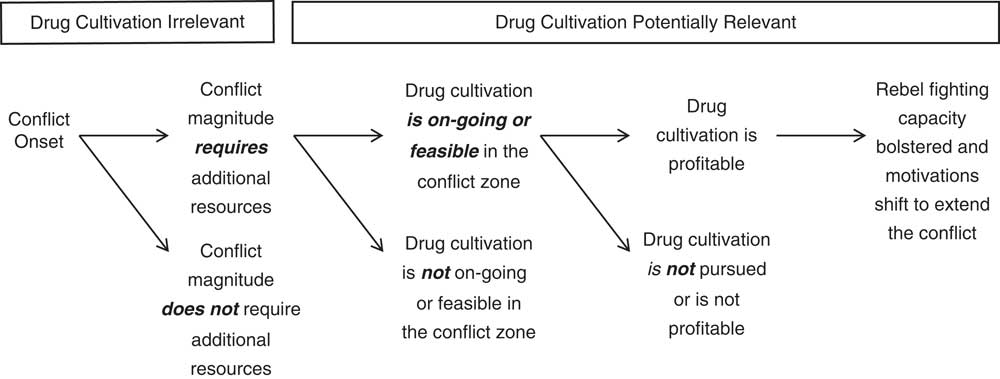
In sum, drug production creates economic functions of violence that incentivize the continuation of conflict in ways not easily overcome through bargaining and negotiation.Footnote 29 We illustrate our theorized link—supported by the empirical analysis above—between drug cultivation and conflict dynamics in Figure 7. The figure highlights our three core arguments: (1) drug production does not start civil conflicts; (2) rebels will only turn to cultivating drugs once they have sufficient information about the type of conflict they are fighting and sufficient capabilities to control the local drug industry; and (3) once rebels have turned to drug production as a revenue base, it can increase conflict duration by bolstering their fighting capacity and by providing new incentives for rebels to resist negotiated agreements.
Theorizing the relationship between drug cultivation, conflict magnitude, and conflict duration

Conclusion
While recent calls for the combined study of war may prove fruitful in uncovering new theoretical insights concealed by the separate study of different types of conflict,Footnote 30 researchers must take care to avoid the methodological and theoretical problems introduced by treating conflict as a uniform concept. In this article, we demonstrate the extent to which existing research analyzes distinct types of intrastate violence in the same empirical models and highlight the consequences of doing so: the majority of existing studies in the civil war literature do not examine their results at both low and high thresholds, and of the minority of studies that have examined their findings in this way, nearly half reported that their results changed at different thresholds. This latter finding underscores that minor and major conflicts often exhibit different causal patterns.
We have shown that examining results across a range of theoretically motivated battle death thresholds is a tractable way for scholars to begin addressing concerns about causal heterogeneity in civil war research. Using this approach, we have clarified the relationship between drug cultivation and conflict intensity: despite claims to the contrary, drug cultivation inside the conflict zone has no effect on total battle deaths; rather, the connection between drug cultivation and conflict intensity operates through duration, namely by prolonging civil wars. These empirical findings support our dynamic theory that emphasizes the endogeneity of drug cultivation to civil war. The causal processes we describe highlight the fact that testing the connection between drug cultivation and conflict dynamics requires attention to the varieties of conflict included in the analysis.
Importantly, the study of varying battle death thresholds is not, and should not be, the only way to account for the differences in conflict characteristics observed across cases of intrastate violence.Footnote 31 For example, if researchers employ our approach and uncover causal heterogeneity in their data, they may be able to improve their models through the use of non-parametric procedures, analyzing subsets of their data, or interacting explanatory variables with indicators for different types of conflict. In other cases, per capita death rates may better support theory testing than absolute thresholds. These measures would go some way in addressing the small country selection bias by normalizing death tolls across conflicts.Footnote 32 Other research projects would benefit from measures that more explicitly capture evidence of ongoing causal processes. For example, our argument about the endogeneity of drug cultivation to civil war would be complemented by future research that collects evidence not just of the presence of drug cultivation in conflict zones, but on whether and how rebels use drug cultivation to support their war efforts.
However scholars decide to account for heterogeneity across the many different types of conflict, theoretical and empirical challenges need not engender debate about the “right” and “wrong” battle death threshold levels. Instead, researchers should embrace the heterogeneity in their data by studying the ways it informs interesting questions about civil war.