Introduction
Hospital emergency preparedness is a critical component of health care systems, ensuring effective response to disasters, epidemics, and other public health emergencies.Reference Alruwaili, Islam and Usher 1 –Reference Alruwaili, Shahbal and Almaliki 4 In Saudi Arabia, the Ministry of Health (MOH) has implemented various strategies to strengthen emergency readiness,Reference Al Harbi, Jubairy and Al Khars 5 including the Saudi Hospital Emergency Preparedness Assessment (SHEPA) Tool, designed to evaluate and enhance hospital preparedness. However, the successful application of such tools depends on leadership perspectives, implementation strategies, and continuous monitoring and evaluation.
The Regional Health Emergency Operations Centers (HEOCs) play a pivotal role in coordinating emergency responses, with leaders from Health Emergency Preparedness Departments overseeing the adoption of assessment tools,Reference Al-Wathinani, Hertelendy and Alhurishi 6 , Reference Al-Wathinani, Alakeel and Alani 7 like SHEPA. Understanding their insights is essential for identifying gaps, improving tool applicability, and ensuring alignment with national emergency preparedness goals. Previous studies have highlighted challenges in hospital preparedness assessments, including inconsistent implementation and the need for leadership engagement.Reference Alqahtani, Namnqani and Nassar 8 –Reference Dobalian, Stein and Radcliff 10
This study measured four key dimensions of HEOC leaders’ perceptions of the SHEPA tool: (1) familiarity considered as the extent to which leaders know and understand the tool’s components and application; (2) perceived usefulness considered as leaders’ assessment of the tool’s value in evaluating hospital preparedness; (3) ease of use considered as the perceived simplicity and practicality of implementing the tool; and (4) impact considered as leaders’ observations of the tool’s effect on actual hospital preparedness outcomes. These dimensions were selected based on the Technology Acceptance Model (TAM), which identifies perceived usefulness and ease of use as primary predictors of technology adoption,Reference Veenema, Lavin and Griffin 11 and prior emergency preparedness research emphasizing the importance of user familiarity and demonstrated impact for sustained tool implementation.Reference Oh, Lee and Schwarz 12 , Reference Kironji, Hodkinson and De Ramirez 13
The SHEPA tool differs from existing hospital preparedness assessment instruments in several key aspects. Unlike the World Health Organization’s Hospital Emergency Response Checklist, which provides a generic framework applicable across diverse settings,Reference Naru, Churruca and Long 14 SHEPA is specifically calibrated to Saudi Arabia’s health care system structure, regulatory requirements, and hazard profile. Compared to the US Hospital Preparedness Index, which focuses primarily on structural and surge capacity metrics,Reference Seok, Cosmas and Arsat 15 SHEPA incorporates a broader assessment of operational processes, staff competencies, and coordination mechanisms with regional HEOCs. Furthermore, while tools like the Emergency Preparedness Information Questionnaire (EPIQ) rely on self-reported staff competencies,Reference Dar Assi, Hammad and Al-Odeh 16 SHEPA employs objective verification through documented evidence and on-site assessments. These distinctive features position SHEPA as a contextually adapted instrument that bridges global best practices with local implementation realities.
Materials and Methods
Study Design
A cross-sectional, descriptive survey design was employed to gather quantitative and qualitative insights. This study was conducted across the 20 MoH branches in Saudi Arabia, focusing on the RHEOCs and the National Health Emergency Operations Center (NHEOC). These centers are responsible for overseeing emergency preparedness in health care facilities. The SHEPA tool was the primary focus, with data collected from leaders involved in its implementation, monitoring, and evaluation.
Sampling Strategy
This study employed a complete census sampling approach, wherein all eligible leaders meeting the inclusion criteria were invited to participate. The target population comprised all heads of Health Emergency Preparedness Departments from the 20 regional RHEOCs (n = 20) and the head of the Health Emergency Preparedness Administration at the NHEOC (n = 1), yielding a total of 21 potential participants. This census approach was selected because these 21 individuals represent the entire population of leaders directly responsible for SHEPA tool implementation and oversight across all MoH branches in Saudi Arabia, ensuring comprehensive representation of regional perspectives.
Eligibility Criteria
Inclusion criteria required participants to: (1) hold a leadership position within a RHEOC or the NHEOC; (2) have direct involvement in applying, monitoring, or evaluating the SHEPA Tool in their respective regions; and (3) have served in their current role for at least 6 months to ensure sufficient experience with the tool. Exclusion criteria included: (1) leaders in acting positions without formal appointment; (2) individuals whose responsibilities did not encompass SHEPA tool oversight; and (3) those on extended leave or unable to complete the survey during the data collection period. All 21 eligible leaders met the inclusion criteria and agreed to participate, resulting in a 100% response rate.
Strategic KPIs
The SHEPA project was structured into 4 strategic phases to enhance hospital emergency preparedness in Saudi Arabia systematically. Phase 1 (Initiation and Preliminary Development: July-October 2018) involved foundational research, including global model benchmarking and initial guide preparation. Phase 2 (Stakeholder Engagement: September-October 2018) incorporated iterative feedback from key stakeholders (e.g., MOH, hospital administrators) to refine the evaluation model. Phase 3 (Finalization and Approval: October 2018) ensured alignment with national standards through rigorous reviews before deployment. Phase 4 (Implementation and Monitoring: October 2018-ongoing) established continuous evaluation using KPIs, such as the percentage of hospitals adopting the model and achieving target preparedness levels, to measure impact. This phased approach balanced evidence-based design with practical adaptability, ensuring SHEPA’s relevance and sustainability in diverse health care settings.
Data Collection
A total of 21 participants were included, comprising the heads of the Health Emergency Preparedness Departments from all 20 regional RHEOCs, and the head of the Health Emergency Preparedness Administration at the NHEOC. Participants were selected based on their direct involvement in applying and assessing the SHEPA Tool. Participants provided voluntary electronic consent before completing the survey. All responses were anonymized, with no personal identifiers collected.
The study utilized a structured Google Form to assess participants’ perceptions of the SHEPA Tool’s usefulness, ease of use, impact on preparedness, and areas for improvement. The survey included Likert-scale questions and open-ended feedback to capture both measurable and subjective responses. The survey was distributed via a dedicated WhatsApp group containing all participants, ensuring direct access to the target audience. Participants were asked about their familiarity with SHEPA, its perceived effectiveness, challenges in implementation, and recommendations for enhancement. Responses were automatically recorded in Google Forms and exported to Excel for coding.
Data Analysis
The data were analyzed using the Statistical Package for Social Sciences (SPSS) software version 26. Descriptive statistics (frequencies and percentages) were used to analyze quantitative responses. Qualitative feedback was thematically categorized to identify participants’ perceptions of the SHEPA tool’s effectiveness and implementation. Logistic regression analysis (Enter method) was performed based on participants’ roles and experience levels. A P-value of less than 0.05 was considered significant.
Results
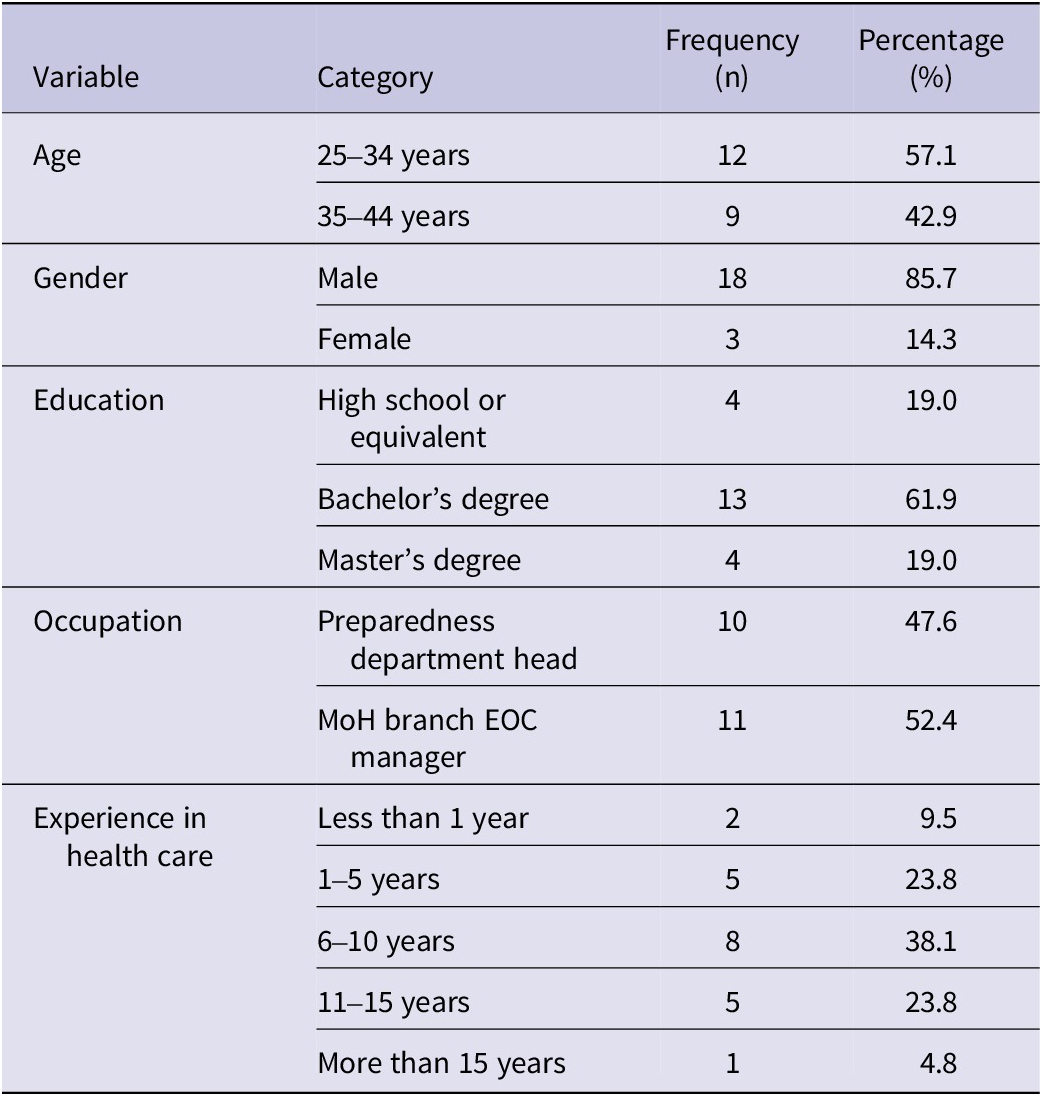
The study participants primarily consisted of mid-career professionals, with the majority (57.1%) falling within the 25-34 years age group. A significant gender imbalance was observed, with male participants (85.7%) vastly outnumbering their female counterparts (14.3%). Educationally, most participants held a Bachelor’s degree (61.9%). In terms of occupational roles, MoH Branch EOC Managers (42.9%) and Preparedness Department Heads (38.1%) formed the core of the sample. Experience levels varied, with the largest group (38.1%) having 6-10 years of experience. Table 1 highlighted a predominantly young, male, and moderately experienced cohort, reflecting the current leadership landscape in Saudi Arabia’s health emergency preparedness sector.
Demographic characteristics of study participants (n = 21)

Table 1. Long description
The table consists of four columns: Variable, Category, Frequency (n), and Percentage (%).
* Age: 25 to 34 years has a frequency of 12 (57.1%); 35 to 44 years has a frequency of 9 (42.9%).
* Gender: Male has a frequency of 18 (85.7%); Female has a frequency of 3 (14.3%).
* Education: High school or equivalent has a frequency of 4 (19.0%); Bachelor’s degree has a frequency of 13 (61.9%); Master’s degree has a frequency of 4 (19.0%).
* Occupation: Preparedness department head has a frequency of 10 (47.6%); M o H branch E O C manager has a frequency of 11 (52.4%).
* Experience in health care: Less than 1 year has a frequency of 2 (9.5%); 1 to 5 years has a frequency of 5 (23.8%); 6 to 10 years has a frequency of 8 (38.1%); 11 to 15 years has a frequency of 5 (23.8%); More than 15 years has a frequency of 1 (4.8%).
Abbreviations used: E O C stands for Emergency Operations Center; M o H stands for Ministry of Health.
Abbreviations: EOC, Emergency Operations Center; MoH, Ministry of Health.
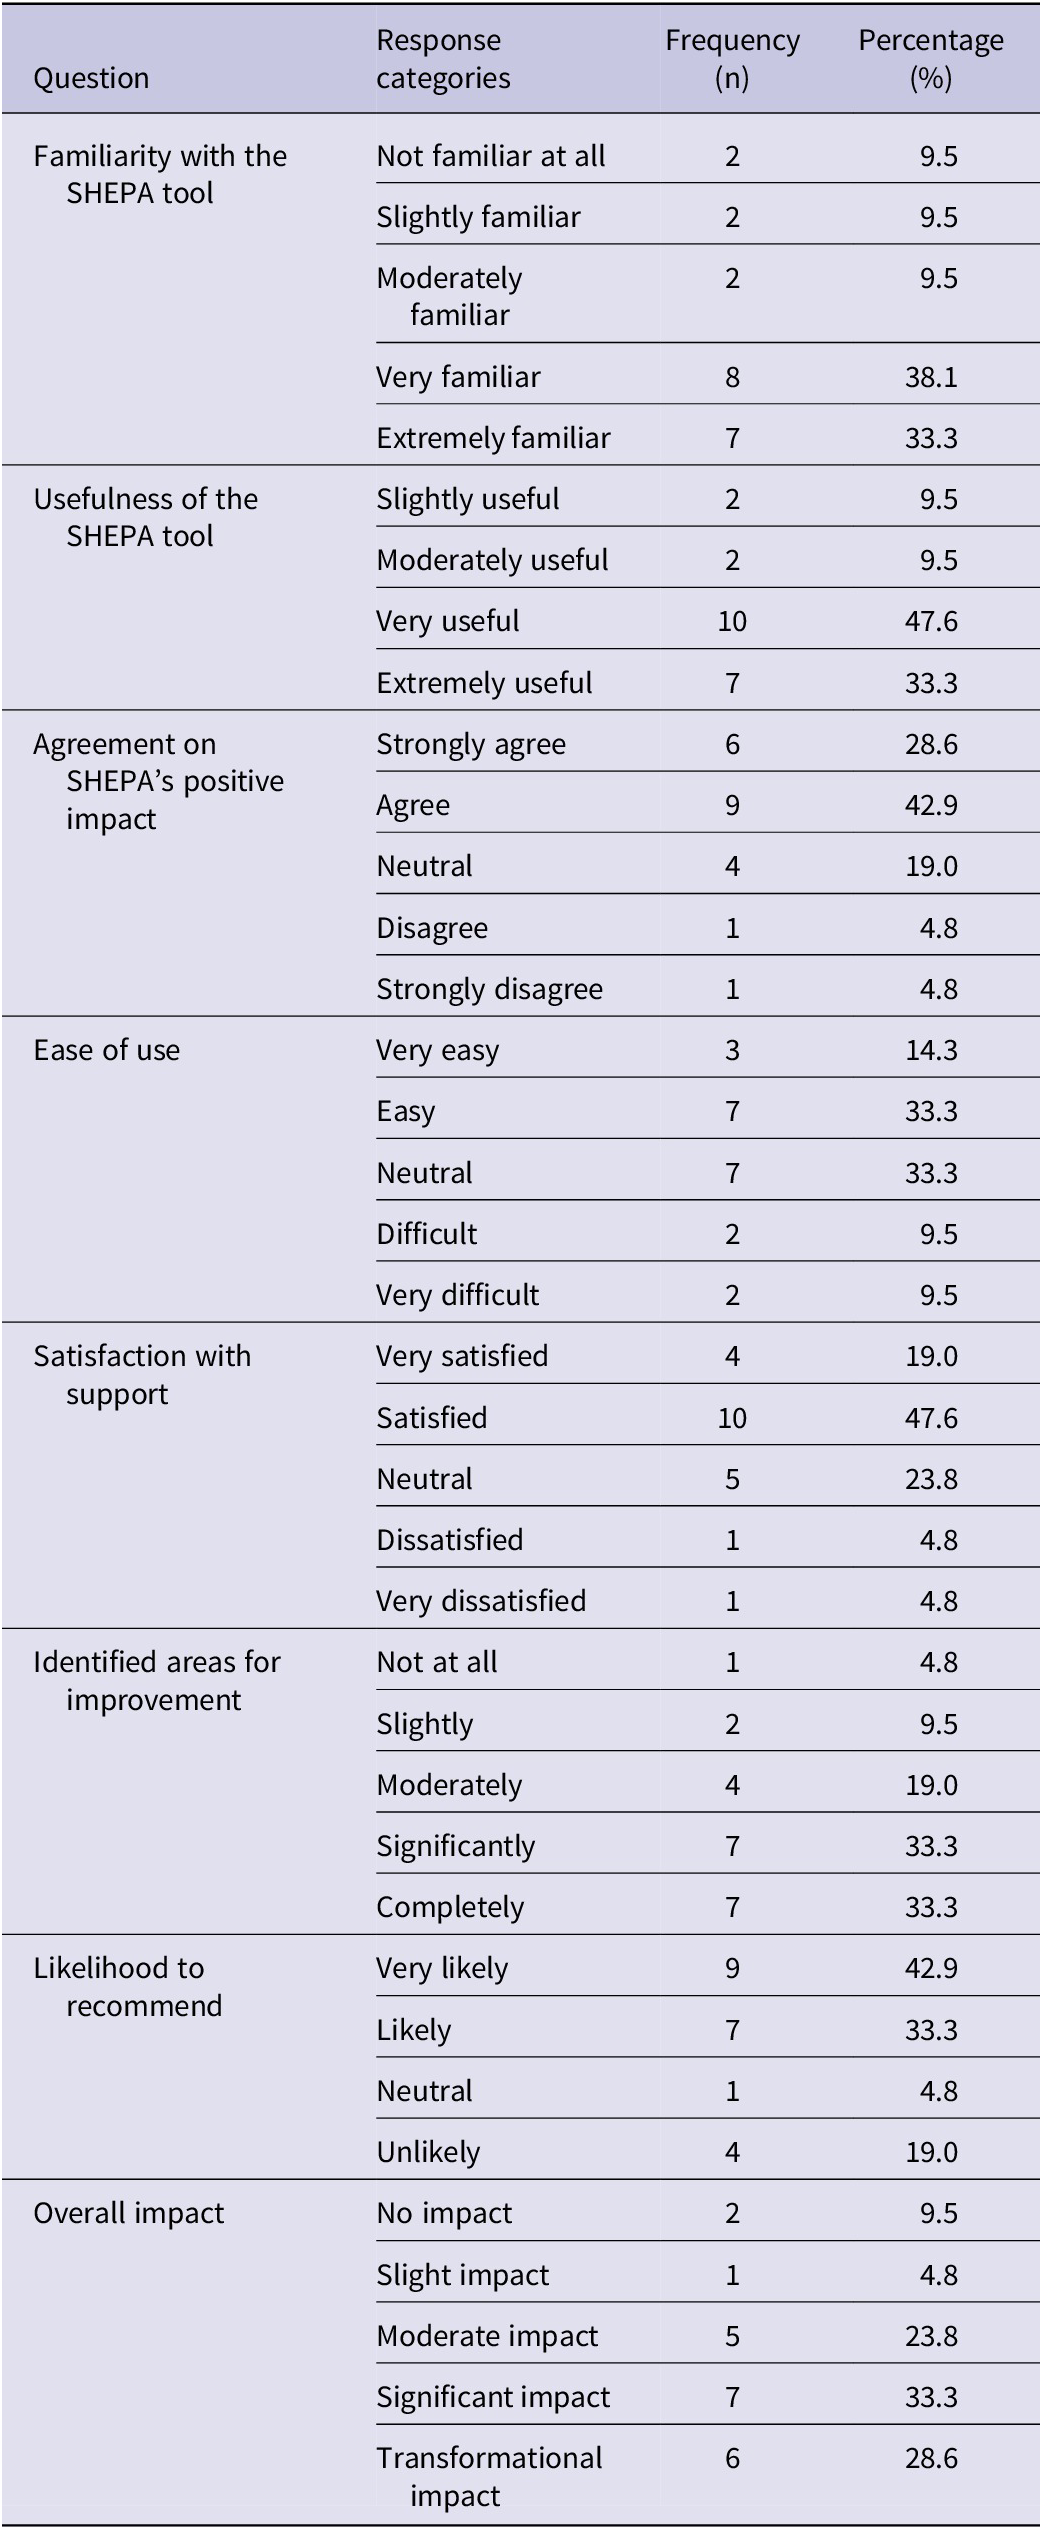
The survey results revealed strong engagement with and generally positive perceptions of the SHEPA tool among health emergency operations centers’ leaders. A significant majority (71%) reported being “very familiar” or “extremely familiar” with the tool, indicating widespread adoption and awareness. Most participants (81%) found the SHEPA tool “very useful” or “extremely useful” for assessing emergency preparedness, with similar numbers (72%) agreeing it positively impacted their facility’s readiness. While nearly half (48%) found the tool easy to use, about one-third remained neutral on this aspect, suggesting some complexity in implementation. Importantly, 67% reported that the tool significantly helped in identifying areas for improvement in emergency preparedness. This positive experience translated into strong endorsement, as 76% of participants said they would likely or very likely recommend the SHEPA tool to other facilities. When assessing overall impact, 62% described the tool’s effect as significant or transformational. These findings suggested that the SHEPA tool is generally well-received and effective, with opportunities remaining to enhance user experience and address implementation challenges for certain facilities. Table 2 demonstrated the tool’s value in strengthening emergency preparedness while highlighting areas for potential refinement.
Participant perceptions of the SHEPA tool’s effectiveness and implementation

Table 2. Long description
The table consists of four columns: Question, Response categories, Frequency n, and Percentage.
* Familiarity with the S H E P A tool: Not familiar at all (2, 9.5 percent); Slightly familiar (2, 9.5 percent); Moderately familiar (2, 9.5 percent); Very familiar (8, 38.1 percent); Extremely familiar (7, 33.3 percent).
* Usefulness of the S H E P A tool: Slightly useful (2, 9.5 percent); Moderately useful (2, 9.5 percent); Very useful (10, 47.6 percent); Extremely useful (7, 33.3 percent).
* Agreement on S H E P A’s positive impact: Strongly agree (6, 28.6 percent); Agree (9, 42.9 percent); Neutral (4, 19.0 percent); Disagree (1, 4.8 percent); Strongly disagree (1, 4.8 percent).
* Ease of use: Very easy (3, 14.3 percent); Easy (7, 33.3 percent); Neutral (7, 33.3 percent); Difficult (2, 9.5 percent); Very difficult (2, 9.5 percent).
* Satisfaction with support: Very satisfied (4, 19.0 percent); Satisfied (10, 47.6 percent); Neutral (5, 23.8 percent); Dissatisfied (1, 4.8 percent); Very dissatisfied (1, 4.8 percent).
* Identified areas for improvement: Not at all (1, 4.8 percent); Slightly (2, 9.5 percent); Moderately (4, 19.0 percent); Significantly (7, 33.3 percent); Completely (7, 33.3 percent).
* Likelihood to recommend: Very likely (9, 42.9 percent); Likely (7, 33.3 percent); Neutral (1, 4.8 percent); Unlikely (4, 19.0 percent).
* Overall impact: No impact (2, 9.5 percent); Slight impact (1, 4.8 percent); Moderate impact (5, 23.8 percent); Significant impact (7, 33.3 percent); Transformational impact (6, 28.6 percent).
To provide more analytical depth, perception patterns across participant subgroups were examined. Cross-tabulation of usefulness ratings by experience level revealed that all four participants (100%) with >10 years’ experience rated the tool as “extremely useful,” compared to 58.3% of those with 6-10 years and 60% of those with 1-5 years’ experience. Similarly, when examining impact perceptions by occupational role, 77.8% of EOC Managers rated the tool’s impact as “significant” or “transformational,” compared to 50% of Preparedness Department Heads. These patterns suggest experience and role meaningfully shape how the tool is evaluated.
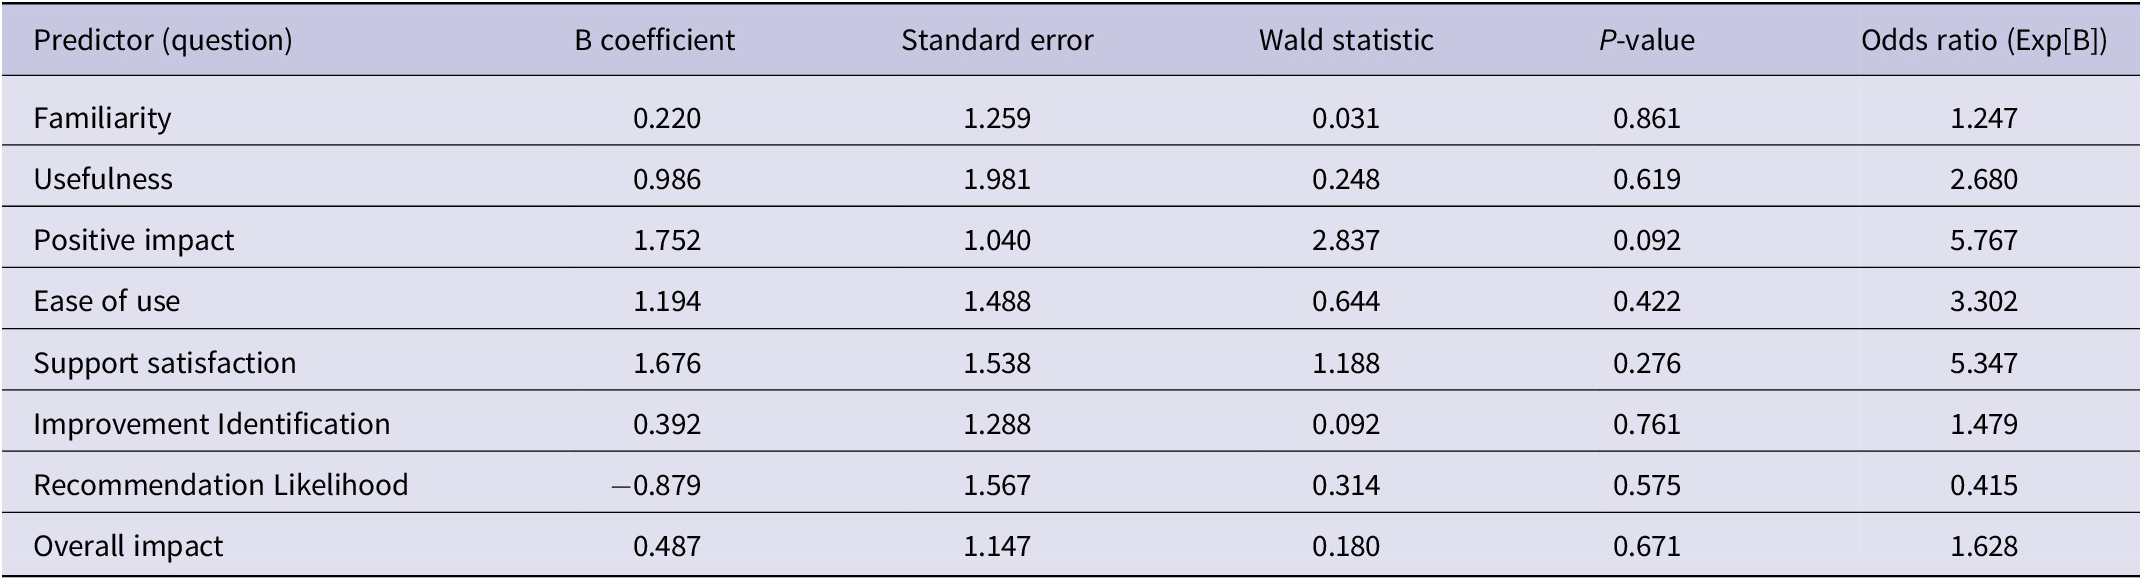
Table 3 revealed meaningful patterns in the occupation-based analysis. The MoH Branch EOC managers demonstrated moderately stronger positive perceptions than Preparedness Department Heads, particularly regarding the tool’s impact (OR = 5.77, P = 0.092) and support satisfaction (OR = 5.35), though these differences did not reach statistical significance. The negative coefficient for recommendation likelihood (−0.879) suggested department heads might be slightly more cautious about endorsing the tool.
Logistic regression analysis: SHEPA tool perceptions by occupational role of the participants

Table 3. Long description
The table consists of six columns: Predictor question, B coefficient, Standard error, Wald statistic, P-value, and Odds ratio Exp B.
* Familiarity: B coefficient 0.220, Standard error 1.259, Wald statistic 0.031, P-value 0.861, Odds ratio 1.247.
* Usefulness: B coefficient 0.986, Standard error 1.981, Wald statistic 0.248, P-value 0.619, Odds ratio 2.680.
* Positive impact: B coefficient 1.752, Standard error 1.040, Wald statistic 2.837, P-value 0.092, Odds ratio 5.767.
* Ease of use: B coefficient 1.194, Standard error 1.488, Wald statistic 0.644, P-value 0.422, Odds ratio 3.302.
* Support satisfaction: B coefficient 1.676, Standard error 1.538, Wald statistic 1.188, P-value 0.276, Odds ratio 5.347.
* Improvement Identification: B coefficient 0.392, Standard error 1.288, Wald statistic 0.092, P-value 0.761, Odds ratio 1.479.
* Recommendation Likelihood: B coefficient negative 0.879, Standard error 1.567, Wald statistic 0.314, P-value 0.575, Odds ratio 0.415.
* Overall impact: B coefficient 0.487, Standard error 1.147, Wald statistic 0.180, P-value 0.671, Odds ratio 1.628.
The analysis compares preparedness department heads n equals 10 versus M o H branch E O C managers n equals 11.
Note. Comparing preparedness department head (n = 10) vs. MoH branch EOC manager (n = 11).
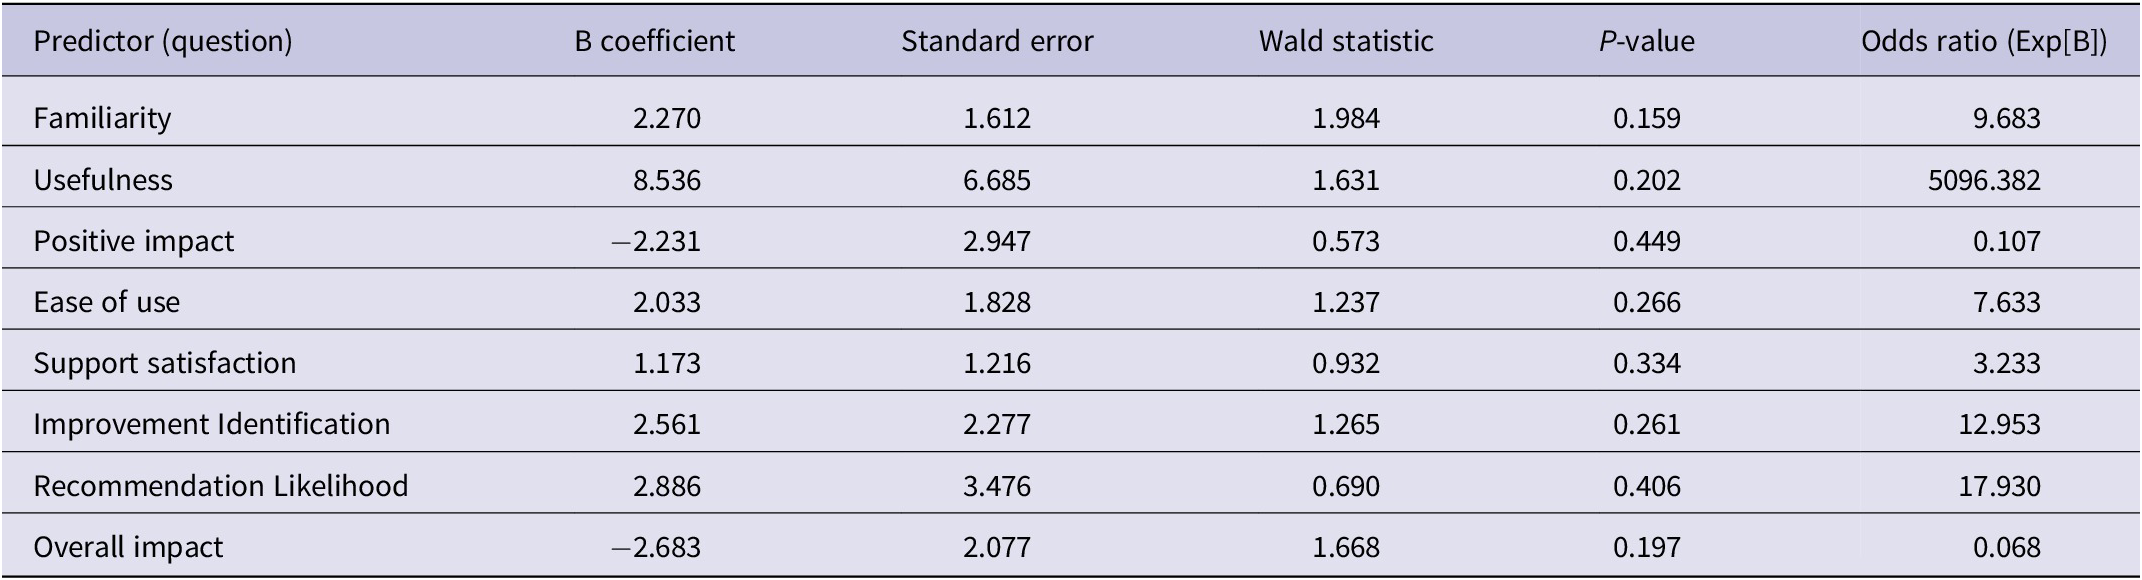
Table 4 revealed the most substantial effects. Professionals with >10 years’ experience showed higher ratings of the tool’s usefulness (OR = 5096) and recommendation likelihood (OR = 17.93); however, the very large odds ratio for usefulness likely reflects sparse data/quasi-complete separation rather than a precise estimate of effect size. Interestingly, more experienced staff held more critical views of the tool’s actual impact (negative coefficients for positive and overall impact), potentially indicating the application of more rigorous evaluation standards. The model achieved 85.7% classification accuracy; however, given the small sample size, this metric should be interpreted cautiously and viewed as exploratory rather than confirmatory. Across all analyses, the small sample size limited statistical power. The observed patterns suggest that professional role and experience may shape perceptions of the SHEPA tool; participants with >10 years’ experience tended to rate usefulness higher while expressing more critical views of impact. However, these findings should be interpreted cautiously given the limited representation of senior staff and warrant validation in larger samples.
Logistic regression analysis: SHEPA tool perceptions by experience level

Table 4. Long description
The table consists of six columns: Predictor question, B coefficient, Standard error, Wald statistic, P-value, and Odds ratio (Exp open bracket B close bracket).
* Familiarity: B coefficient 2.270, Standard error 1.612, Wald statistic 1.984, P-value 0.159, Odds ratio 9.683.
* Usefulness: B coefficient 8.536, Standard error 6.685, Wald statistic 1.631, P-value 0.202, Odds ratio 5096.382.
* Positive impact: B coefficient minus 2.231, Standard error 2.947, Wald statistic 0.573, P-value 0.449, Odds ratio 0.107.
* Ease of use: B coefficient 2.033, Standard error 1.828, Wald statistic 1.237, P-value 0.266, Odds ratio 7.633.
* Support satisfaction: B coefficient 1.173, Standard error 1.216, Wald statistic 0.932, P-value 0.334, Odds ratio 3.233.
* Improvement Identification: B coefficient 2.561, Standard error 2.277, Wald statistic 1.265, P-value 0.261, Odds ratio 12.953.
* Recommendation Likelihood: B coefficient 2.886, Standard error 3.476, Wald statistic 0.690, P-value 0.406, Odds ratio 17.930.
* Overall impact: B coefficient minus 2.683, Standard error 2.077, Wald statistic 1.668, P-value 0.197, Odds ratio 0.068.
The analysis compares professionals with less than or equal to 10 years of experience (n equals 15) versus those with greater than 10 years of experience (n equals 6).
Note. Comparing professionals with ≤10 years (n = 15) vs. >10 years’ experience (n = 6).
Discussion
Principal Findings
The study’s findings demonstrated that the SHEPA tool is widely recognized as valuable by Saudi health emergency operations centers’ leaders, with 71% reporting high familiarity and 81% rating it as very/extremely useful. These results align with global studies on emergency preparedness tools, such as the Hospital Preparedness Index (HPI) in the U.S., which similarly found that structured assessment frameworks improve readiness but require leadership engagement for effective implementation.Reference Veenema, Lavin and Griffin 11 The high adoption rates mirror findings from South Korea’s National Emergency Medical Center, where standardized assessment tools showed 78% compliance when supported by top-down policy mandates.Reference Oh, Lee and Schwarz 12
Usefulness and Impact
The SHEPA tool’s strong performance in identifying improvement areas (67% reported significant/complete identification) surpasses results from similar tools in Southeast Asia, where only a minority of Malaysian hospital administrators found their assessment instruments effective for gap analysis.Reference Seok, Cosmas and Arsat 15 This difference may reflect SHEPA’s contextual adaptation to Saudi Arabia’s health care system and the robust training programs accompanying its implementation. Notably, participants with >10 years’ experience tended to rate the tool’s usefulness higher (OR = 5096), although this estimate should be interpreted cautiously given sparse data and small subgroup size.Reference Kako, Hammad and Mitani 17 This pattern may indicate that more experienced leaders differentiate between perceived utility and measurable impact; however, this interpretation remains exploratory and requires validation in larger samples.
Ease of Use and Implementation Challenges
The mixed responses regarding ease of use (48% found it easy while 33% were neutral) reflected challenges identified in the European Union’s Health Emergency Disaster Risk Management (H-EDRM) framework evaluation, where 41% of users reported complexity in tool navigation.Reference Perpiñá-Galvañ, Juliá-Sanchis and Olmos-Castelló 18 Cross-tabulation analysis revealed that Preparedness Department Heads reported greater usability challenges than EOC Managers, suggesting that those directly administering the tool may encounter more implementation hurdles than those overseeing it from a strategic level. This finding underscores the need for role-tailored training and user interface refinements to enhance the tool’s practicality for frontline administrators.
Role-Based and Experience-Related Differences
The occupational differences, with EOC managers perceiving stronger impacts than department heads, echo similar role-based disparities observed in Canadian hospitals, where administrators prioritized tool functionality over frontline staff’s usability concerns.Reference Dalglish, Khalid and McMahon 19 These findings are consistent with organizational behavior theories suggesting that implementation fidelity varies by hierarchical position, with those closer to strategic oversight focusing on outcomes while those managing daily operations emphasize process efficiency.Reference Weiner, Clary, Klaman, Albers, Shlonsky and Mildon 20 The critical perspective of experienced professionals aligns with findings from Singapore’s emergency preparedness studies, where veteran staff served as “reality checks” for theoretical models.Reference Ametepe and Onokala 21 , Reference Asthana, Mukherjee and Phelan 22 This suggested SHEPA’s evaluation framework could benefit from incorporating more field-tested indicators, similar to the modified Delphi approach used to refine hospital preparedness standards in Sri Lanka.Reference Munasinghe, O’Reilly and Cameron 23
However, SHEPA’s strong performance in identifying improvement areas (67% reported significant/complete identification) surpasses results from similar tools in Southeast Asia, where only a few Malaysian hospital administrators found their assessment instruments effective for gap analysis.Reference Sulaiman, Abid and Nazir 24 These parallels suggested that while the SHEPA tool aligns with global best practices, its implementation must address role-specific needs to maximize effectiveness, as recommended in the Pan-American Health Organization’s guidelines for emergency preparedness tools.Reference Gamba, LeBlanc and Vázquez 25 The recommendation likelihood (76% likely/very likely) compares favorably to adoption rates of the Hospital Safety Index in Latin America (68%),Reference Gutiérrez, Rodriguez and Torres-Pereda 26 potentially reflecting cultural factors in tool acceptance.
Implications for Saudi Arabia’s Emergency Preparedness Framework
For the Saudi MOH, these findings suggest several actionable implications. First, the high acceptance rates indicate that SHEPA has achieved strong buy-in from regional leadership, providing a foundation for continued expansion. Second, the usability concerns voiced by department heads highlight the need for enhanced training programs and potential digitalization of the tool to streamline data entry and analysis. Third, the critical assessments from experienced professionals should be leveraged by incorporating their feedback into iterative tool refinements, perhaps through a formal advisory mechanism. Finally, the observed role-based perception differences suggest that communication about SHEPA’s purpose and value should be tailored to different audiences, emphasizing strategic outcomes for managers while addressing practical concerns for administrators.
Limitations
The methodological limitations imposed by the small sample size (N = 21) must be acknowledged. The extreme odds ratios observed (e.g., OR = 5096 for usefulness among experienced professionals) likely reflect sparse cell sizes and potential quasi-complete separation rather than precise effect estimates. Given these constraints, logistic regression analyses were treated as exploratory and interpreted primarily in terms of directional patterns rather than magnitude of effect. Fisher’s exact tests and cross-tabulations were reviewed as complementary approaches to confirm consistency of subgroup patterns where appropriate. Classification accuracy (85.7%) and goodness-of-fit indicators should also be interpreted cautiously due to the limited sample and potential model instability. A P-value of less than 0.05 was considered indicative of statistical significance, though findings are presented conservatively given the exploratory nature of this study. The cross-sectional design precludes causal inference, and the absence of pre-SHEPA baseline data limited impact assessment.
A further caveat in interpreting experience-related findings warrants explicit acknowledgment. While preliminary patterns among professionals with >10 years’ experience were observed, this group comprised only four participants (19% of the sample), with only one participant having >15 years’ experience. Consequently, all logistic regression findings presented in this study are strictly exploratory and should not be over-interpreted as conclusive evidence of association or effect magnitude. This limited representation constrains the generalizability of conclusions about senior leadership perspectives.
The extreme odds ratios observed (OR = 5096) likely reflect sparse data rather than precise effect estimates, and these findings should be interpreted as preliminary signals requiring validation in larger samples. The observed tendency for more experienced participants to express both strong appreciation of utility and more critical views of impact merits further investigation despite these sample limitations.
Practical Implications for the Ministry of Health
Develop role-specific training programs that address the distinct needs of EOC Managers (focusing on strategic interpretation of SHEPA data) vs. Preparedness Department Heads (emphasizing practical administration and troubleshooting). Consider streamlining assessment items and improving user interface design based on feedback from department heads, who reported greater usability challenges. Digitalization of the tool with automated scoring and recommendation generation could reduce administrative burden. Establish a formal advisory panel of senior leaders (>10 years’ experience) to provide ongoing critical feedback and participate in iterative tool refinements, leveraging their rigorous evaluation standards to enhance impact measurement. Develop more robust indicators of tool impact, addressing the concerns of experienced professionals who questioned whether current metrics adequately capture actual preparedness improvements.
Future Research Directions
Conduct multi-center validation studies with larger, more diverse samples to confirm these preliminary findings and enable more sophisticated statistical analyses. Implement longitudinal designs tracking hospitals’ preparedness scores over multiple assessment cycles to establish causal relationships between SHEPA implementation and improved outcomes. Compare SHEPA outcomes with facilities using alternative assessment tools to establish relative effectiveness and identify best practices. Examine organizational factors influencing successful SHEPA adoption, including leadership support, resource allocation, and staff engagement, to develop evidence-based implementation guidelines.
By addressing these recommendations, policymakers can optimize the SHEPA tool’s utility, ensuring it meets the evolving demands of emergency management across diverse health care settings while maintaining the strong stakeholder buy-in demonstrated in this study.
Conclusions
This study highlights the SHEPA tool’s potential to strengthen hospital emergency preparedness in Saudi Arabia, with strong endorsement from health emergency operations centers’ leaders. The key findings, 81% usefulness rating, 72% positive impact, and 67% effectiveness in identifying improvement areas, demonstrate that the tool successfully fulfills its core objectives. However, the mixed ease-of-use ratings (48%) and the critical perspectives of experienced professionals indicate opportunities for refinement. It is important to emphasize that the logistic regression results, particularly the extreme odds ratios (e.g., OR = 5096), are exploratory in nature owing to the small sample size (N = 21) and sparse subgroup data. These findings should be interpreted as preliminary signals to inform future research rather than as definitive effect estimates.
Data availability statement
The data for this article are available in this research paper and the authors’ records.
Acknowledgment
We sincerely thank the hospital representatives from participating hospitals, including Nidaa Khalifah Alshammari, Kholoud Abdullah Alamri, Razan Abdulaziz Alsarraa, Eman Mohamed Alzahrani, Hissah Abdulrahman AlFaeem, Ibtisam Fahad Alanazi, Manal Owaidh Almutairi, Rawan Abdulrahman Aldelailan, Tahani Massad Almutairi, and Khalid Yousef Algosaibi, for their cooperation in conducting this study’s survey.
Author contribution
Hisham Hassan Ali Dinar: Writing—original draft, validation, methodology, visualization, and conceptualization. Omar Abdulfattah Ahmed Othman, Bandar Mzahim, and Ives Hubloue: Supervision, reviewing, and editing. Salma Saeed Anteef, Razan Ghabban, Lojain Sami AlHarbi, and Bashayr Faihan Alotaibi: Resources, data curation, and project administration. Mohammed Alkahes, Barjas J. Alanazi, Nawaf Mana Alasiri, and Fahad Saleh Alanazi: Formal analysis, project administration, and data curation. All authors have read and approved the final version of the manuscript.
Funding statement
The authors have stated that they did not receive any financial support from any institution or publishing entity for conducting and the publication of this study.
Competing interests
None.
Ethical standard
The study adhered to ethical guidelines to ensure the integrity and confidentiality of the data and was approved by the Institutional Review Board (IRB) of the Ministry of Health, Saudi Arabia via 1RBlog No:24- 4M; dated: 4-01-2024. Participation was voluntary, and hospitals were informed of the study’s purpose and procedures. Hospital data were anonymized to protect the identities of participating institutions and ensure privacy.