Introduction
According to an Intergovernmental Panel on Climate Change report (Hijioka et al., Reference Hijioka, Lin, Pereira, Corlett, Cui, Insarov, Lasco, Lindgren and Surjan2014), hydroclimatic changes in the near future are likely to cause increased riverine, coastal, and urban flooding in Asian regions. In particular, precipitation extremes will affect various social aspects, including human health, security, livelihoods, and poverty, and these impacts will vary in type and magnitude across Asia. To eliminate uncertainties in future predictions, it is essential to understand the features of past hydroclimatic change and its variability at various time scales. From the viewpoint of natural disasters, significant changes of discharge related to flood or drought events (or periods) and short-term hydrologic change must be considered in terms of long-term climate change. Furthermore, understanding how past hydroclimatic changes in drainage areas are linked to regional and global climate changes will help specify the factors controlling hydrologic/climate change in watershed areas.
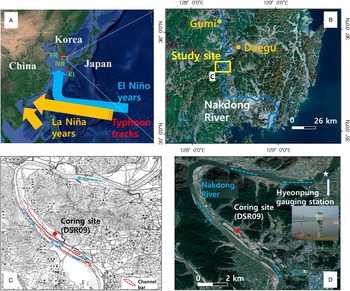
Current extreme hydrologic events in East Asia are influenced mainly by tropical cyclones, which correlate strongly with eastern Pacific sea surface temperature change, related to El Niño–Southern Oscillation (ENSO) change. The genesis and tracks of tropical typhoons in the western Pacific are considered to be linked to ENSO activity (Liu et al., Reference Liu, Shen and Louie2001; Elsner and Liu, Reference Elsner and Liu2003; Fudeyasu et al., Reference Fudeyasu, Iszuka and Matsuura2006). During El Niño years, compared with La Niña years, more typhoons form in the southeastern part of the western Pacific and tend to recurve farther north, resulting in more landfalls in Korea and Japan (Fig. 1) (Elsner and Liu, Reference Elsner and Liu2003; Camargo and Sobel, Reference Camargo and Sobel2005; Yonekura and Hall, Reference Yonekura and Hall2011). However, such local or regional hydrologic responses remain unclear in terms of longer-term climate change at centennial-to-millennial time scales. To compensate for the limited observational records, these long-term records should be reconstructed and tested using geologic archives.
Past flooding or inundation events have been traced by changes in grain size in various areas. In fluvial systems, coarse-grained material is most abundant near the channel and decreases with distance across the floodplain. However, water inundation over the floodplain during high-energy flooding events can transport coarser grains in suspension farther from the main channel, resulting in an increase of the average grain size of sediment (Walling et. al., 1997; Benedetti, Reference Benedetti2003; Lecce and Pavlowsky, Reference Lecce and Pavlowsky2004; Knox, Reference Knox2006; Lim et al., Reference Lim, Lee, Hong and Kim2013). In coastal areas, past behaviors of hurricanes and typhoons have been traced based on inundation-driven sand-rich layers (Donnelly and Woodruff, Reference Donnelly and Woodruff2007; Woodruff et al., Reference Woodruff, Donnelly, Mohrig and Geyer2008, Reference Woodruff, Donnelly and Okusu2009; Lane et al., Reference Lane, Donnelly, Woodruff and Hawkes2011; McCloskey and Liu, Reference McCloskey and Liu2013; Toomey et al., Reference Toomey, Donnelly and Woodruff2013). Thus, grain-size data based on inundation-driven deposits may reveal the intensity and frequency changes of past flooding events, providing information on temporal variation of past hydrologic events.
Furthermore, past flooding events can be highlighted by the alternation between flood sediments and organic-rich sediments. Benedetti (Reference Benedetti2003) found that riverbank deposits in the upper Mississippi River floodplain were characterized by a negative correlation between sand content and organic carbon content, suggesting alternating influences of coarser-grained deposition during flooding events and organic enrichment by litter fall between floods. In addition, carbon isotope values of the sedimentary organic matter can be used to trace the flooding and climatic conditions for specific time periods. In general, carbon isotopic ratios are useful for distinguishing between different types of land plants (Meyers, Reference Meyers1994, Reference Meyers1997; Lamb et al., Reference Lamb, Wilson and Leng2006; Lim and Fujiki, Reference Lim and Fujiki2011). C3 plants (e.g., trees and shrubs) using the Calvin pathway lead to a δ13C shift of approximately −20‰ from atmospheric CO2 (δ13C=~−7‰), resulting in an average value of −27‰, whereas C4 plants (e.g., mainly grasses) using the Hatch-Slack pathway, leading to a δ13C shift of approximately −7‰ from atmospheric CO2, consequently have an average δ13C of −14‰ (O’Leary, Reference O’Leary1981, Reference O’Leary1988; Farquhar et al., Reference Farquhar, O’Leary and Berry1982; Tieszen, Reference Tieszen1991). Freshwater algae have δ13C values that are similar to those of C3 plants (Meyers, Reference Meyers1994, Reference Meyers1997). Thus, the δ13C values in fluvial sediments, for example floodplain or back swamp sediments, may reveal the relative abundance of C3 plants (or aquatic algae) and C4 plants living in and around the floodplain or back swamp in the past.
This study aimed to reconstruct the record of Holocene floods in South Korea and test the hypothesis that flooding variability at centennial-to-millennial time scales is linked to ENSO activity, which has been sparsely tested in East Asia.
Study site and methods
The Nakdong River, the second longest river (523 km) in Korea, flows from the Taebaek Mountains and drains into the southwest coast, Namhae (the Korean Strait; Fig. 1). Its catchment area is approximately 23,000 km2. Extensive agricultural areas and industrial complexes are located in the drainage basin. The present vegetation along the Nakdong River and its surrounding areas (Chilgog, Daegu, Goryeong, and Changneong) is characterized by different species at different sites (Chang and Lee, Reference Chang and Lee1983). For example, C3 flora is dominant in forests (e.g., Pinus densiflora, Quercus mongolica, and Q. acutissima), but the abundance of C4 flora, dominantly Arundinella hirta, Miscanthus sinensis, and Themeda japonica, is 13%–50% in grasslands. In rice paddies, the percentage of C4 flora is 67%, with Eragrostis ferruginea being the dominant species (Chang and Lee, Reference Chang and Lee1983).
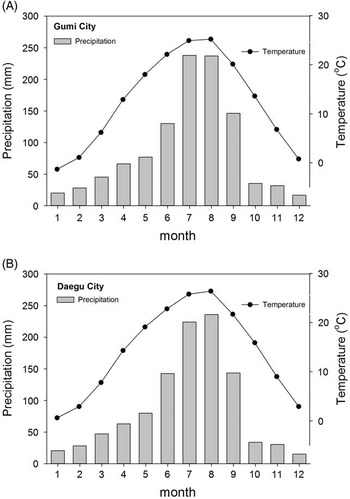
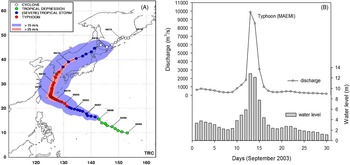
Figure 2 shows monthly temperature and precipitation records in the middle reach of the Nakdong River. Annual mean precipitation is ~1100 mm, and summer season rainfall (June to September) accounts for 70% of the annual precipitation. Present-day meteorologic records show extreme rainfall and flooding events have mainly been derived from tropical typhoons formed in the western North Pacific. For example, Typhoon Maemi in 2003 (Fig. 3) was the worst one to hit South Korea during past decades. As shown in Figure 3, discharge on September 12, 2003, at Hyeonpung gauging station (zero elevation: 8.414 m) located in the middle reach of the Nakdong River was more than 10,000 m3/s, resulting in major inundations with more than a 12 m increase in water level.
The study area is within the middle reach of the Nakdong River; the coring site (35°39′51.82″N, 128°22′38.42″E; 17.8 m in elevation) was chosen based on a comparison between past and present maps of river channel location. The DSL09 coring site is located on the floodplain and back swamp away from the location of former channel and channel bars as shown in the 1920s geologic map (Fig. 1C) and has been influenced by frequent flooding events. For example, the coring site was submerged by at least 2–3 m during the Typhoon Maemi strike in 2003. This area has been reclaimed, resulting in surface sediment disturbances by recent human activity. Sediment cores with a total length of 23 m in a one-single hole were recovered using a rotary corer, which returns a core sample of 50 mm diameter in a 1 m long plastic liner. The recovered sedimentary cores were subsampled at an interval of 10 cm for grain-size, elemental, and isotopic analyses.
Radiocarbon dating
About 5–10 g of dried bulk sediment samples (n=21) was used to extract the humic component. The samples were mixed with 1N HCl and heated to 80°C for 1 h to remove carbonates arising from the erosion of limestone and soils, then drained off after centrifugation. The residues were mixed with 1N NaOH and heated to 80°C for a further 1 h. The NaOH-soluble material (humic component) was separated after centrifugation and acidified, forming a precipitate, which was then rinsed and dried. After graphitization of these pretreated humic materials, radiocarbon dating was performed using the accelerator mass spectrometry facility of the Korea Institute of Geoscience and Mineral Resources. Radiocarbon dates were calibrated with radiocarbon calibration program (OxCal; http://c14.arch.ox.ac.uk/embed.php?File=oxcal.html).
Grain-size analysis
For grain-size analysis, about 300 mg of dry sample was treated with 35% H2O2 to decompose organic matter and then boiled in 1N HCl for 1 h to remove carbonates and iron oxides. After rinsing with distilled water, the samples were treated with an ultrasonic vibrator for 15 s to keep them in suspension and facilitate dispersion. Grain-size analysis was then performed using a Mastersizer 2000 laser analyzer (Malvern Instruments Ltd., UK), which automatically provides the grain-size percentage (e.g., clay, silt, and sand %) and median grain size of samples.
Total organic carbon and carbon isotope (δ 13 C) analyses
For total organic carbon (TOC), bulk subsamples of ~500 mg were treated with 1N HCl at about 100°C for 1 h and rinsed with distilled water. Approximately 3–5 mg of the HCl-treated subsamples was loaded into a tin combustion cup, and TOC contents were determined using a CNS elemental analyzer (vario Micro Cube; Elementar, Germany). Stable carbon isotope (δ13C) analyses of the HCl-treated subsamples were performed using a continuous-flow isotope ratio mass spectrometer (Isoprime100; G.V. Instruments, Manchester, UK) coupled with a CNS elemental analyzer (vario Micro Cube; Elementar). The results were expressed in delta (δ) notation relative to the Vienna Pee Dee belemnite standard The reference material used was CH-6 (sucrose, δ13C=−10.45 ± 0.033‰), which was obtained from the International Atomic Energy Agency. Replicated analyses had a precision >0.2‰.
Results
Age model
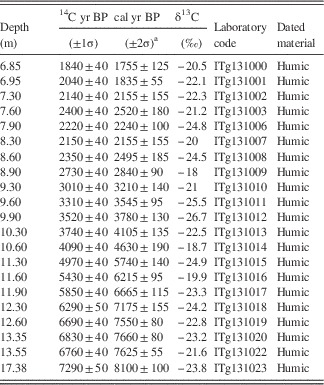
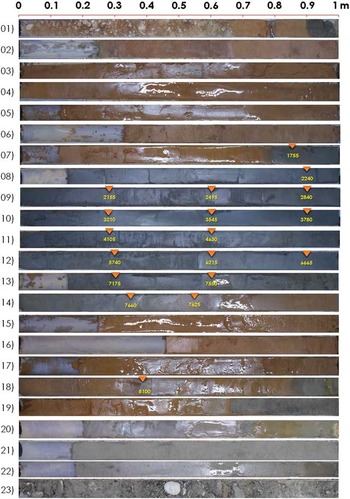
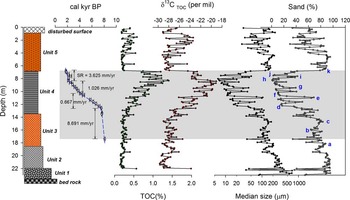
The 14C-dating results (Table 1 and Figs. 4 and 5) show that the age of sediment at depths of 6.9 m and 17. 4 m is 1760 cal yr BP and 8100 cal yr BP, respectively, suggesting that the recovered sediments formed mainly during the early to late Holocene. The ages generally become younger stratigraphically, which indicates that the sediments were deposited sequentially. The sedimentation rate of the study site was 8.69 mm/yr from 8100 to 7550 cal yr BP; decreased to 0.7–1 mm/yr between the depths of 12.6 m and 8.3 m, corresponding to the period between 7550 and 2155 cal yr BP; and then increased again to 3.63 mm/yr from 8.3 m to 6.85 m. Based on these sedimentation rates (Fig. 5), depth was converted to cal yr BP by linear interpolation.
Results of accelerator mass spectrometry 14C dating and calibrated dates for core DSR09.

a Calibrated with radiocarbon calibration program OxCal (http://c14.arch.ox.ac.uk/embed.php?File=oxcal.html).
Sedimentary units
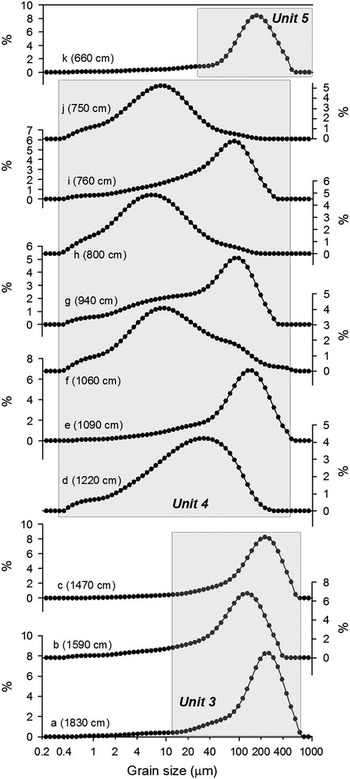
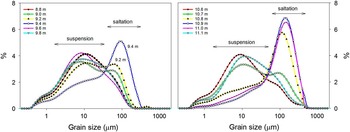
The sediment cores can be divided into the following five units based on the grain size and color of the sediments (Fig. 5). Representative grain-size distributions in units 3–5 are shown in Figure 6.
From base to top, they are as follows:
-
∙ Unit 1 (22–23 m): grayish rounded sand and pebble deposits with weathered bedrock below 23 m.
-
∙ Unit 2 (18.6–22 m): grayish granule and coarse sandy deposits showing fining upward.
-
∙ Unit 3 (13.6–18.6 m): yellowish fine sandy deposits with no clear fining upward. Unimodal grain-size distribution with a mode of 150–200 µm.
-
∙ Unit 4 (6.8–13.6 m): dark grayish sandy silt deposits with clear fining upward. Alternation between unimodal and bimodal grain-size distributions (e.g., modes 6–10 µm and 80–150 µm).
-
∙ Unit 5 (0.7–6.8 m): yellowish fine sandy deposits alternating with silty deposits. Unimodal grain-size distribution (mode 150–200 µm).
TOC
TOC values are 0.1%–0.3% in units 1–3. In unit 4, TOC increased from 0.3% to 1.4%, culminating at 8.3 m, and then decreased to 0.6%. At the transition between unit 4 and unit 5, 6.9–6.7 m in depth, TOC % decreased rapidly from 0.75% to 0.2%. In unit 5, TOC fluctuated between 0.2% and 0.6%. The δ13CTOC values in the depth profile changed in the same way as TOC %. In units 1–3, δ13CTOC values fluctuated between about −30‰ and −24.5‰. The δ13CTOC values from the depths of 13.6–8.3 m in unit 4 showed an increasing trend from −28‰ to −19‰ with 3‰–5‰ fluctuations. From 8.3 m to 6.8 m, included in unit 4, the δ13CTOC values decreased from −24.4‰ to −28‰, and in unit 5, corresponding to the surface layer, the δ13CTOC values fluctuated between −29‰ and −23.4‰.
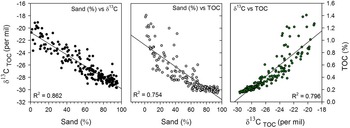
The sand percentage, TOC percentage, and δ13CTOC values showed high correlation with each other (Fig. 7). The sand percentage showed negative correlation with δ13CTOC (R 2=0.868) and positive correlation with TOC % (R 2=0.779). The δ13CTOC values were negatively correlated with TOC % (R 2=0.796). These high correlations among the three proxies suggest that the physical component (grain size) and the biological component (TOC % and δ13CTOC) in this study were influenced by common factors.
Discussion
Fluvial system evolution at the study site during the Holocene and flood frequency changes
The sedimentary units (1–5) are characterized by their distinctive grain sizes (e.g., pebble, sand, or silt dominant grain sizes with unimodal or bimodal grain-size distribution) and clearly show the past evolution of the fluvial system in the study site. In general, fluvial sediments are influenced by both lateral and vertical accretion deposition during flooding events, resulting in coarser channel deposits and finer overbank deposits, respectively (Knox, Reference Knox2006; Carson et al., Reference Carson, Knox and Mickelson2007; De Moor et al., Reference De Moor, Kasse, van Balen, Vandenberghe and Wallinga2008). For example, the grain size of floodplain sediments is mainly influenced by the deposition of suspended particles (mainly less than 0.1 mm) during flooding (Visher, Reference Visher1969 and references therein; Sun et al., Reference Sun, Bloemendal, Rea, Vandenberghe, Jiang, An and Su2002). Higher-magnitude flooding events can result in increased deposition of coarser suspended and bedload populations in the distal areas of the floodplain.
As shown by the dating results, the sediments of core DSR09 formed mainly during the Holocene. Units 1 and 2 with rounded pebbles and grayish coarse sand probably indicate within-channel deposits that formed before the early Holocene. The age of unit 3, corresponding to the period from 8100 to 7600 cal yr BP, suggests that the 5 m depth of yellowish sand mainly showing unimodal grain-size distributions with a mode of 150–200 µm (fine sand) was deposited during a period of about 500 yr. This high sedimentation rate may have been caused by an abrupt channel shift resulting in fining upward channel-fill deposits. The sediments of unit 4 indicate that the study site gradually became a floodplain and back swamp during the period from 7600 to 1800 cal yr BP. This is supported by gradual decrease in grain size and increase in organic matter (or TOC %). The long-term decreasing trend in the sand percentage (Fig. 5) during this period (unit 4) may indicate that the coring site became less influenced by flooding events, possibly because of channel migration leading to an increase in distance between channel and the coring site and/or increasing elevation of the coring site by vertical accretion. As shown in Figures 6 and 8, bimodal grain-size distributions with modes 6–10 µm and 80–150 µm in unit 4 clearly suggest that there had been at least two different transporting modes (suspension and saltation), and relatively higher-magnitude flooding events would have caused increased deposition of the coarser suspension and saltation populations at the coring site (Fig. 8). From 1700 cal yr BP including unit 5, the study site experienced a significant influx of yellowish sandy deposits, suggesting the results of ongoing geomorphic changes as the river floodplain evolved and/or human impacts on the drainage basin. The sedimentological and geochemical data sets from the floodplain–back swamp deposits (unit 4, 6.8–13.6 m) covering 1800–7600 cal yr BP seem to provide more reliable flooding frequency records because of relatively stable geomorphological settings and high-resolution age controls compared with other units in the core.
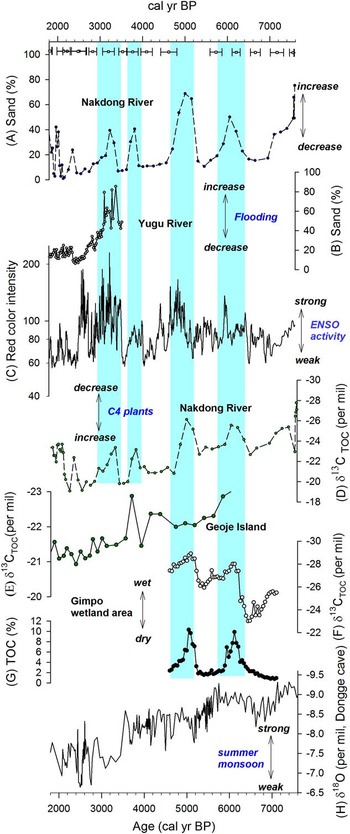
Changes in the grain-size distribution and the sand fraction have been used as an indicator for past flooding events (e.g., Walling et al., Reference Walling, Owens and Leeks1997; Benedetti, Reference Benedetti2003; Lecce and Pavlowsky, Reference Lecce and Pavlowsky2004; Knox, Reference Knox2006). In Korea, Lim et al. (Reference Lim, Lee, Hong and Kim2013) tested whether floodplain deposits can be used to reconstruct past flooding records. Based on their multicore study of fluvial floodplain deposits of the Yugu River, one of the tributaries of the Keum River, central South Korea, they investigated the variability of past flooding frequency. The sand fraction of the floodplain deposits, varying on multicentury time scales, showed several past episodes of higher-frequency large floods (Lim et al., Reference Lim, Lee, Hong and Kim2013) (Fig. 9B). The time series of variations in the sand fraction in the Yugu River from core KL29 is similar to that of this study (core DSR09) in terms of variability and long-term change. Larger grain size and increased deposits of the coarser suspension and saltation populations in this study in the period 3300–2900 yr BP were correlated with high sand fraction in the Yugu River at that time (Fig. 9). This peak in sand percentage change with clear bimodal grain-size distributions (9.8–8.8 m: 3400–2400 cal yr BP; Fig. 8) shows that floodplain–back swamp deposits at that time formed under the influence of severe flooding events transporting the sand component by bedload mode and mild flooding events transporting suspended particles. This suggests that the intervals of elevated sand percentage (e.g., 11.1–10.6 m in Fig. 8) reflect periods of increased severe flooding events and not a single large flooding event. Furthermore, the two data sets from this study and Yugu River show a similar decrease in severe flooding frequency with significantly reduced flooding events at 2500–2400 cal yr BP. Compared with the high-resolution results of the Yugu River (interval ~2.5 cm), this study was performed with relatively low resolution (interval ~10 cm), implying that it was difficult to detect all flooding records during the same intervals. Despite these differences, the similarity observed between the two sites suggests that there were common controlling factors for past flooding variability over South Korea during the late Holocene.
The alternation between sandy sediments and organic-enriched sediments with a high negative correlation observed in this study (Figs. 5 and 7) supports the interpretation of grain size as a proxy for past flooding frequency changes. Thus, as shown in Figure 9, the time series of sand percentage provides information on temporal changes in flooding frequency at the study site. During the middle to late Holocene, flooding events occurred more frequently at four intervals (2900–3400 cal yr BP, 3600–3900 cal yr BP, 4600–5300 cal yr BP, and 5800–6400 cal yr BP).
Implications of the changes in δ 13 C TOC values in floodplain/back swamp sediments
This study clearly demonstrated that the grain-size change is correlated with the change in δ13CTOC values (Figs. 5 and 7). When coarser grain-size sediment was deposited, δ13CTOC values were relatively lower, and vice versa. The organic matter in the floodplain may have originated from an authigenic component from in situ plants and an allochthonous component transported from the surroundings during times of flooding.
As mentioned in the introduction, δ13CTOC values provide information about sources of terrestrial organic matter (e.g., C3 or C4 plants) (Meyers, Reference Meyers1994, Reference Meyers1997; Lamb et al., Reference Lamb, Wilson and Leng2006). C3 plants have an average δ13CTOC value of −27‰, whereas C4 plants have an average value of −13‰. It is considered that the floodplain sediments formed during the periods with less frequent flooding events include relatively higher amounts of the authigenic component compared with those formed during periods of frequent flooding events. For example, the δ13CTOC values in the low-flood-frequency interval of 6400–7100 cal yr BP were about −23‰ to −24‰, followed subsequently by values of −21‰ at 3900–4600 cal yr BP and −19‰ at 2500 cal yr BP (Fig. 9). This indicates a long-term increase in the δ13CTOC value at the coring site during the middle to late Holocene. Considering that the organic matter in the floodplain consists mainly of organic matter of terrestrial origins, especially during low-frequency flooding periods, this long-term increasing trend of δ13CTOC suggests a relative increase in C4 plants. However, during the high-frequency flooding periods (e.g., 5800–6400 cal yr BP and 4600–5300 cal yr BP in Fig. 9), the depleted δ13CTOC values suggest two possibilities: (1) a decrease in C4 plants at those times because of a relative increase in authigenic C3 plants at the coring site or (2) a decrease in C4 plant influence caused by increased input of C4 plants from the catchment areas and/or aquatic plants along the river during the more frequent flooding events.
Based on the present distribution of C4 plants in Korea, the long-term increase in δ13CTOC values at the study site during the middle to late Holocene may indicate a long-term increase in aridity. According to a previous study of the distribution of C3 and C4 plants in Korea (Chang and Lee, Reference Chang and Lee1983), current C4 plants are abundant in arid areas but have low abundance in well-developed woody forests or humid areas. Along the Nakdong River and its surrounding areas, in particular, C3 flora is dominant in forests, but C4 flora such as A. hirta, M. sinensis, and T. japonica occupy 13%–50% of vegetation in grasslands (Chang and Lee, Reference Chang and Lee1983). It is likely that C4 plants including A. hirta, M. sinensis, and T. japonica may have increased during more arid periods in the study area because of the expansion of grassy area, resulting in increased δ13CTOC values in top soils. Thus, the observed long-term increase in δ13CTOC values may indicate a long-term increase in aridity at the study site during the middle to late Holocene, probably suggesting climate controls on the vegetation change.
The strong correlation between sand percentage and the δ13CTOC values may suggest that possible fluvial or sedimentological changes driven by channel migration and vertical accretion influenced the δ13CTOC values. As a result, changes in the δ13CTOC values need to be compared to regional-scale climatic changes. The long-term climatic evolution toward more arid conditions including millennial-scale changes in the δ13CTOC values observed in this study is similar to that observed at Geoje Island on the southern coast of Korea (Lim et al., Reference Lim, Lee, Kim, Hong and Yang2014). As shown in Figure 9E, the δ13CTOC values of sediments from an exposed section on the coastal area revealed the increasing trend from –24.3‰ to –21.2‰ during the late Holocene, suggesting gradually increasing aridity. This data set showed a possible climatic turning point with a shift from arid to wet condition at about 2100 cal yr BP. These features are found in the δ13CTOC values from the core DSR09, suggesting that the δ13CTOC values in the two sites during the late Holocene have been affected by common climatic factors. Furthermore, the two wet periods (5800–6400 cal yr BP and 4600–5300 cal yr BP) showing reduced C4 plants in this study were likely synchronous with those in central Korea. As shown in Figure 9F, the δ13CTOC values recovered from the Gimpo wetland sediments clearly revealed two wet periods (Lim et al., Reference Lim, Yang, Lee, Hong and Um2015). Based on these comparisons (Lim et al., Reference Lim, Lee, Kim, Hong and Yang2014, Reference Lim, Yang, Lee, Hong and Um2015), the observed long-term increasing trend and significant variability in the time series of the δ13CTOC values in this study may be used as a proxy for past climate change, though we cannot completely exclude sedimentological impacts.
Possible links of flooding frequency and climate changes in the Nakdong River basin to regional and global climate changes
This study revealed that there were long-term changes in grain size, TOC %, and δ13CTOC values in the floodplain sediments and short-term changes superimposed on the long-term trends. The quite similar long-term and short-term pattern of changes among grain size, TOC %, and δ13CTOC values during the Holocene likely were influenced by past climate change linked to regional climate change at that time.
Heavy rainfall in East Asia including Korea and China is controlled by the East Asian monsoon system consisting of summer and winter monsoons (An, Reference An2000; Ho et al., Reference Ho, Lee, Ahn and Lee2003; Wang and Zhou, Reference Wang and Zhou2005; Cosford et al., Reference Cosford, Qing, Eglington, Mattey, Yuan, Zhang and Cheng2008; Jo et al., Reference Jo, Woo, Lim, Cheng, Edwards, Wang and Jiang2011, Reference Jo, Woo, Yi, Yang, Lim, Wang, Cheng and Edwards2014). During the summer season, northward advances of the rain belt (“Jangma” in Korean), may result in heavy rainfall and resultant flooding events. Changes in the summer monsoon during the Holocene are described by the Asian monsoon index reconstructed from the oxygen isotope composition of stalagmites in Dongge Cave, South China (Dykoski et al., Reference Dykoski, Edwards, Cheng, Yuan, Cai, Zhang, Lin, Qing, An and Revenaugh2005) (Fig. 9H). The long-term decreasing changes in the sand percentage and δ13C values observed in this study appear to have been influenced by a long-term decreasing summer monsoon intensity. It is likely that the relatively stronger summer monsoon intensity during the middle Holocene caused more frequent and higher-magnitude flooding events over the floodplain. The subsequent decreasing summer monsoon intensity during the late Holocene resulted in reduced flooding events and increased δ13CTOC values in the floodplain sediments.
Furthermore, Lim et al. (Reference Lim, Lee, Hong and Kim2013) suggested strong teleconnection at multicentennial time scales between large floods in central Korea and ENSO activity. To test this possible teleconnection, we compared the time series of sand percentage and δ13C values from this study with the ENSO index based on red clastic sediments deposited during El Niño events at Laguna Pallcacocha, southern Ecuador (Moy et al., Reference Moy, Seltzer, Rodbell and Anderson2002) (Fig. 9C). The larger grain sizes indicating more frequent large floods seem to occur during periods of high ENSO activity, as shown in Figure 9. For example, during the periods from 4600 to 5300 cal yr BP and 5800 to 6400 cal yr BP, the larger grain size and depleted δ13CTOC values correspond to stronger ENSO activity periods. This comparison supports the possible teleconnection between flooding events in Korea and ENSO activity during the Holocene.
The linking mechanism between the observed variability in flooding frequency in Korea and ENSO activity may be related to changes in typhoon tracks. Based on historical documents from Guangdong Province, southern China, and modern typhoon data, previous studies (Liu et al., Reference Liu, Shen and Louie2001; Elsner and Liu, Reference Elsner and Liu2003) suggested that typhoons with recurving tracks are more frequent during El Niño years and that typhoons that track directly to southern China are more frequent during La Niña years (Fig. 1). To delineate centennial-to-millennial-scale pathway changes, Woodruff et al. (Reference Woodruff, Donnelly and Okusu2009) reconstructed episodic coastal inundation records through the last 6400 yr using sediment cores from two coastal lakes located on the island of Kamikoshiki in southwestern Japan. They showed that paleotyphoons can be traced by layers exhibiting an increase in grain size and elevated Sr concentrations. From a comparison between these typhoon-driven seawater input indexes and ENSO activity, they found that periods of barrier breaching were concurrent with an increase in ENSO frequency. For example, during the period of 3600–2500 cal yr BP, the typhoon-induced deposition of coarser grain-size sediment in the Kamikoshiki coastal lake corresponded to increased ENSO activity. Recently, Williams et al. (Reference Williams, Choowong, Phantuwongraj, Surakietchai, Thongkhao, Kongsen and Simon2016) traced past typhoon activity on the Gulf of Thailand coast based on typhoon-deposited sand layers and found that a possible oscillating pattern in tropical cyclone activity in the western North Pacific. Their data clearly showed significantly reduced tropical cyclones in Thailand during periods of enhanced ENSO activity ca. 2500–3600 cal yr BP and ca. 300–1000 cal yr BP. Similar higher typhoon strikes during weakened ENSO periods were reported by Chen et al. (Reference Chen, Wen, Song, Yang, Lee, Lin, Hsu, Wei, Chang and Yu2012) from lake sediments in Taiwan.
Consequently, it is likely that the site of core DSR09 in southern Korea (this study) and Kamikoshiki Island in southwestern Japan (Woodruff et al., Reference Woodruff, Donnelly and Okusu2009) were influenced by typhoons with recurving tracks to Korea and Japan during the periods of increased ENSO activity (El Niño–like stage), whereas Thailand coasts (Williams et al., Reference Williams, Choowong, Phantuwongraj, Surakietchai, Thongkhao, Kongsen and Simon2016) and Taiwan (Chen et al., Reference Chen, Wen, Song, Yang, Lee, Lin, Hsu, Wei, Chang and Yu2012) were influenced by typhoons with a westerly path toward south China during the periods of decreased ENSO activity (La Niña–like stage), as suggested by Elsner and Liu (Reference Elsner and Liu2003). Thus, this study supports the results from Elsner and Liu (Reference Elsner and Liu2003) and Woodruff et al. (Reference Woodruff, Donnelly and Okusu2009) suggesting that ENSO activity has potentially played a key role in governing typhoon variability in East Asia.
This study clearly demonstrated possible centennial-to-millennial-scale teleconnection between flooding frequency changes and remote ENSO activity. Local or regional responses to this ENSO activity in the past seem to be complicated. For example, Knox (Reference Knox2000) pointed out that large middle Holocene floods in the United States (e.g., the upper Mississippi valley (e.g., Knox, Reference Knox1993, Reference Knox2000) and the southwestern United States (e.g., Ely et al., Reference Ely, Enzel, Baker and Cayan1993; Ely, 1997) do not coincide. He tried to explain this difference in terms of large-scale tropospheric westerly circulation (Knox, Reference Knox2000). In China, Huang et al. (Reference Huang, Pang, Zha, Su, Jia and Zhu2007) investigated slack water deposits in the middle reaches of the Yellow River drainage basin to trace Holocene paleoflood variability in the semiarid loess regions of China. They suggested that past great floods in the study area resulted from extreme precipitation in summer driven by rare, intensive meridional airflows involving northwestward-moving tropical cyclone systems from the Pacific (Huang et al., Reference Huang, Pang, Zha, Su, Jia and Zhu2007).
Therefore, our flooding indicators clearly suggest that past flooding events in Korea were highly sensitive to atmospheric circulation in East Asia coupled to ENSO activity at that time. This highlights the necessity of a deep understanding of local and regional responses in East Asia to centennial-to-millennial-scale ENSO activity in terms of climatic conditions including the dominant atmospheric circulation pattern and resultant pathway and magnitude of tropical typhoons.
Conclusions
Based on the remarkably high correlations among the environmental proxies (grain size, TOC %, and δ13C values), we provide a record of flood frequency change in the middle reach of the Nakdong River during the middle to late Holocene. Our study demonstrated that flood frequency and climate changes at centennial-to-millennial time scales in South Korea have been coupled mainly with ENSO activity, suggesting that the hydrologic changes, including flooding and drought, in East Asia are coupled to the centennial-to-millennial-scale atmospheric–oceanic circulation changes represented by the ENSO pattern. The similar changes in inundation signals between the southern part of Korea and the western coastal region of Japan suggest that changes in the track of tropical typhoons during the Holocene were influenced by ENSO activity.
(color online) (A) Simplified tropical typhoon tracks in East Asia. During El Niño years, typhoons with recurving tracks occurred more frequently, but during La Niña years, typhoons move straight in the direction of southern China (Liu et al., Reference Liu, Shen and Louie2001; Elsner and Liu, Reference Elsner and Liu2003; Camargo and Sobel, 2005; Yonekura and Hall, Reference Yonekura and Hall2011). YR, NR, and KI represent the Yugu River, the Nakdong River in South Korea, and Kamikoshiki Island in southwestern Japan, respectively. (B) Study area within the middle reach of the Nakdong River. (C) Coring site (DSR09) in 1920s geologic map of Korea. (D) Coring site (DSR09) in present aerial map from Daum maps. Star shows the location of Hyeonpung gauging station.

Monthly temperature and precipitation data for the interval 1981–2010 in in the middle reach of the Nakdong River (Gumi and Daegu), South Korea.

(color online) (A) Passage of Typhoon Maemi (September 4–12, 2003) (from Typhoon Research Center [TRC]). (B) Discharge and water-level changes at Hyeonpung gauging station (zero elevation: 8.414 m) during the Typhoon Maemi event (source: Water Resources Management Information System (WAMIS)).

(color online) Photographs of sedimentary cores (DSR09) recovered from the middle reach of the Nakdong River, South Korea. The diameter of each core is 5 cm, and radiocarbon dating results (cal yr BP) were inserted.

(color online) Results of radiocarbon dating (circles with error ranges represent age-dating points in the sedimentary succession of the cores, and SR represents sedimentation rate), sand fraction (sand %), and geochemical analyses (total organic carbon [TOC] % and carbon isotope values [δ13C of TOC]) of the fluvial sediments (core DSR09) in the middle reach of the Nakdong River, South Korea. Letters a to k were assigned to significant peaks and troughs in the sand % change, and their grain-size distributions are shown in Figure 6.

Grain-size distributions of the fluvial sediments (core DSR09) in the middle reach of the Nakdong River, South Korea. Letters a to k were assigned to significant peaks and troughs in sand % change (see Fig. 5).

(color online) Correlations among the three environmental proxies recovered from core DSR09 in the middle reach of the Nakdong River, South Korea: the physical component (sand %) and the biological component (total organic carbon [TOC] % and δ13CTOC).

(color online) Grain-size distribution change with depth (core DSR09) in the middle reach of the Nakdong River, South Korea. These grain-size distribution changes suggest that floodplain–back swamp deposits at that time formed under the influence of severe flooding events transporting the sand component by saltation mode and mild flooding events transporting suspended particles.

(color online) Comparison of long-term flooding frequency change and long-term climate change recovered in this study with other reconstructed climate changes. (A) Sand (%) from core DSR09 in the middle reach of the Nakdong River, South Korea. (B) Sand fraction from the Yugu River (core KL29), central Korea (Lim et al., Reference Lim, Lee, Hong and Kim2013). (C) El Niño–Southern Oscillation (ENSO) activity index (Moy et al., Reference Moy, Seltzer, Rodbell and Anderson2002). (D) The δ13CTOC change in the fluvial sediments from core DSR09 in the middle reach of the Nakdong River, South Korea. (E) The δ13CTOC change in an exposed section on Geoje Island, on the southern coast of Korea (Lim et al., Reference Lim, Lee, Kim, Hong and Yang2014). (F and G) The δ13CTOC change and total organic carbon (TOC; %) from Gimpo wetland, central Korea (Lim et al., Reference Lim, Yang, Lee, Hong and Um2015). (H) Asian summer monsoon index from the oxygen isotope data of stalagmites in Dongge Cave, South China (Dykoski et al., Reference Dykoski, Edwards, Cheng, Yuan, Cai, Zhang, Lin, Qing, An and Revenaugh2005). Squares with error ranges represent age dating points in core DSR09 in this study. The vertical shaded bars showing multicentennial frequent flooding periods in the study area (e.g., 2900–3400 cal yr BP, 3600–3900 cal yr BP, 4600–5300 cal yr BP, and 5800–6400 cal yr BP) corresponded to stronger ENSO activity periods.

Acknowledgments
This research was supported by the Basic Research Project of the Korea Institute of Geoscience and Mineral Resources funded by the Ministry of Science, ICT and Future Planning of Korea. We are grateful to two anonymous reviewers and Nicholas Lancaster (senior editor) for their helpful comments and suggestions on the manuscript.