Introduction
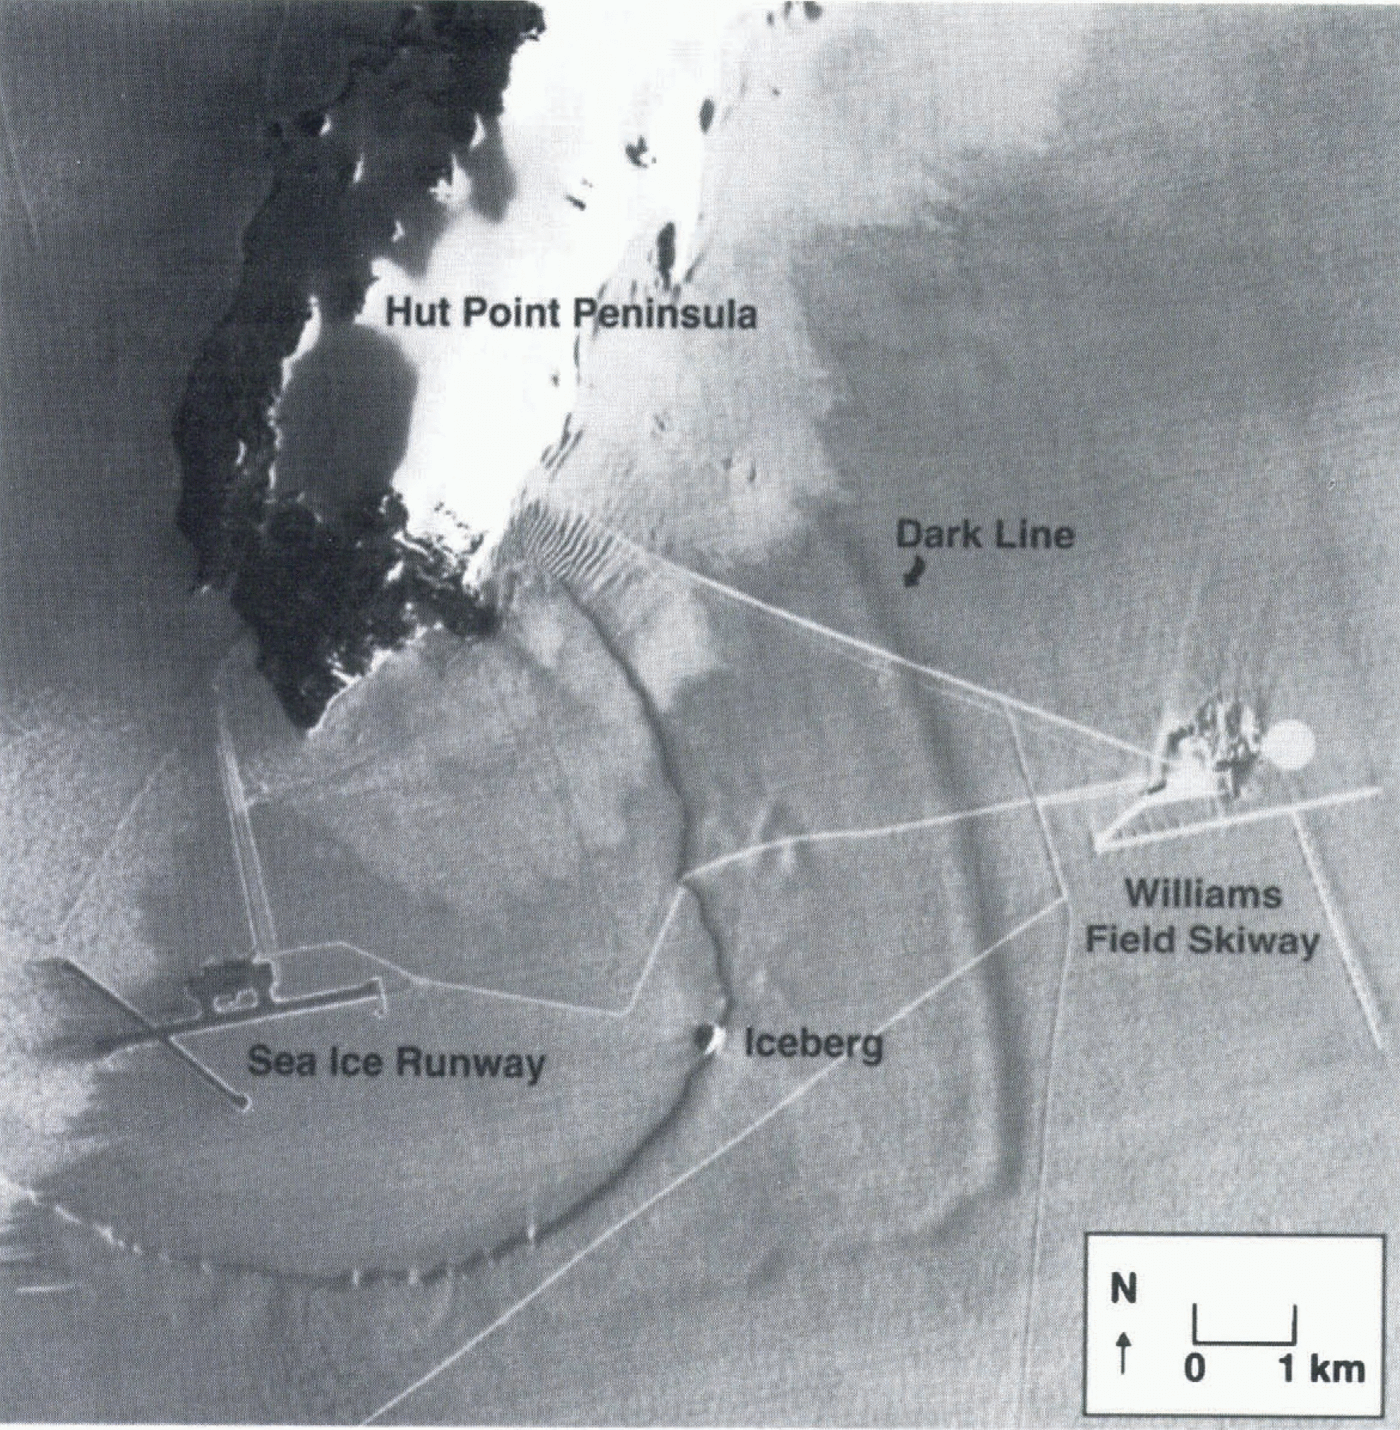
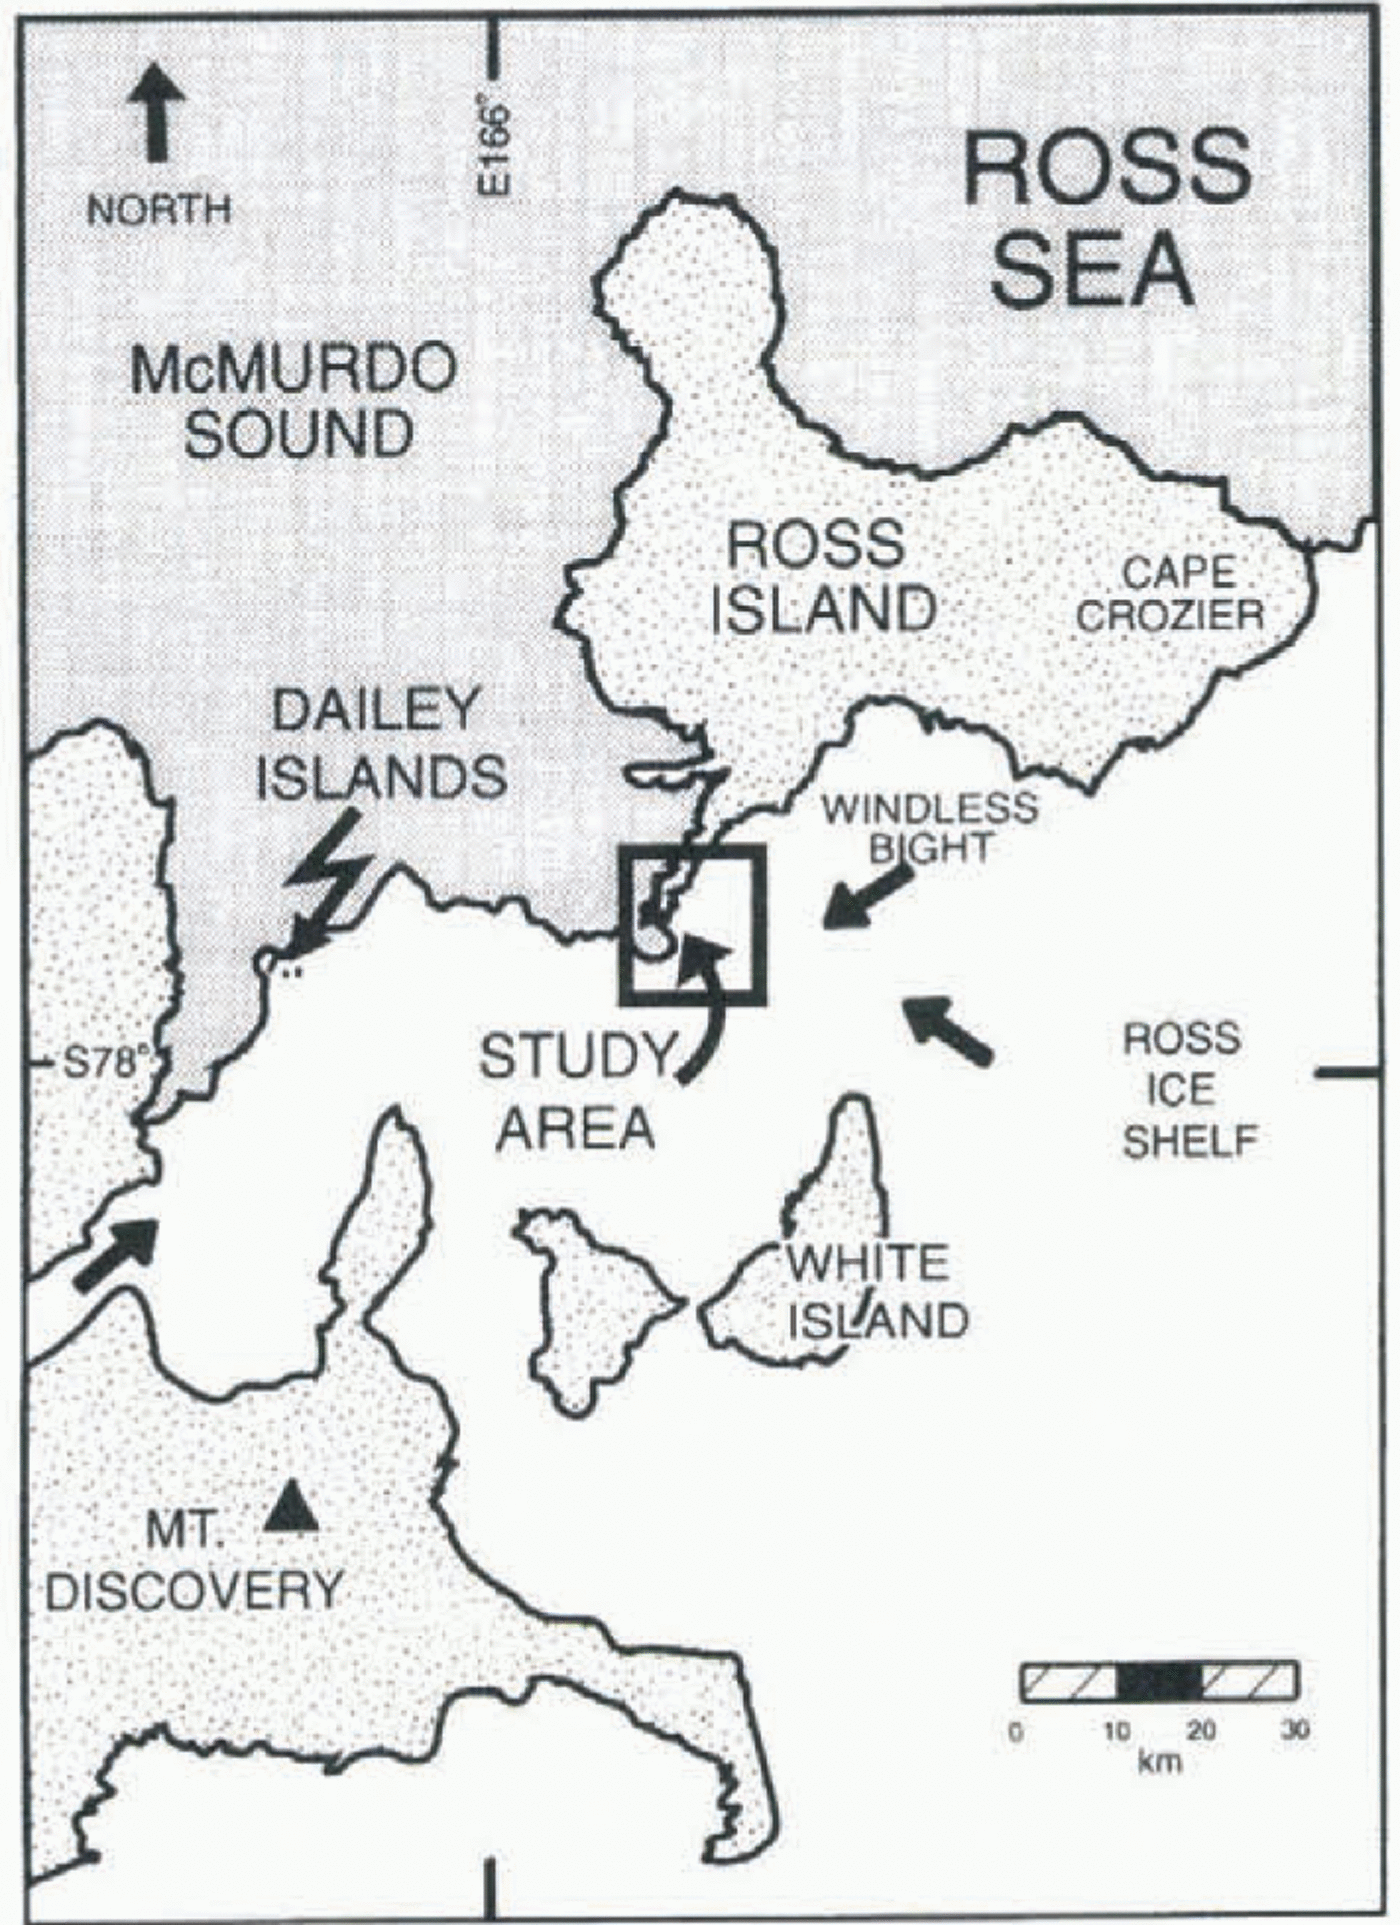
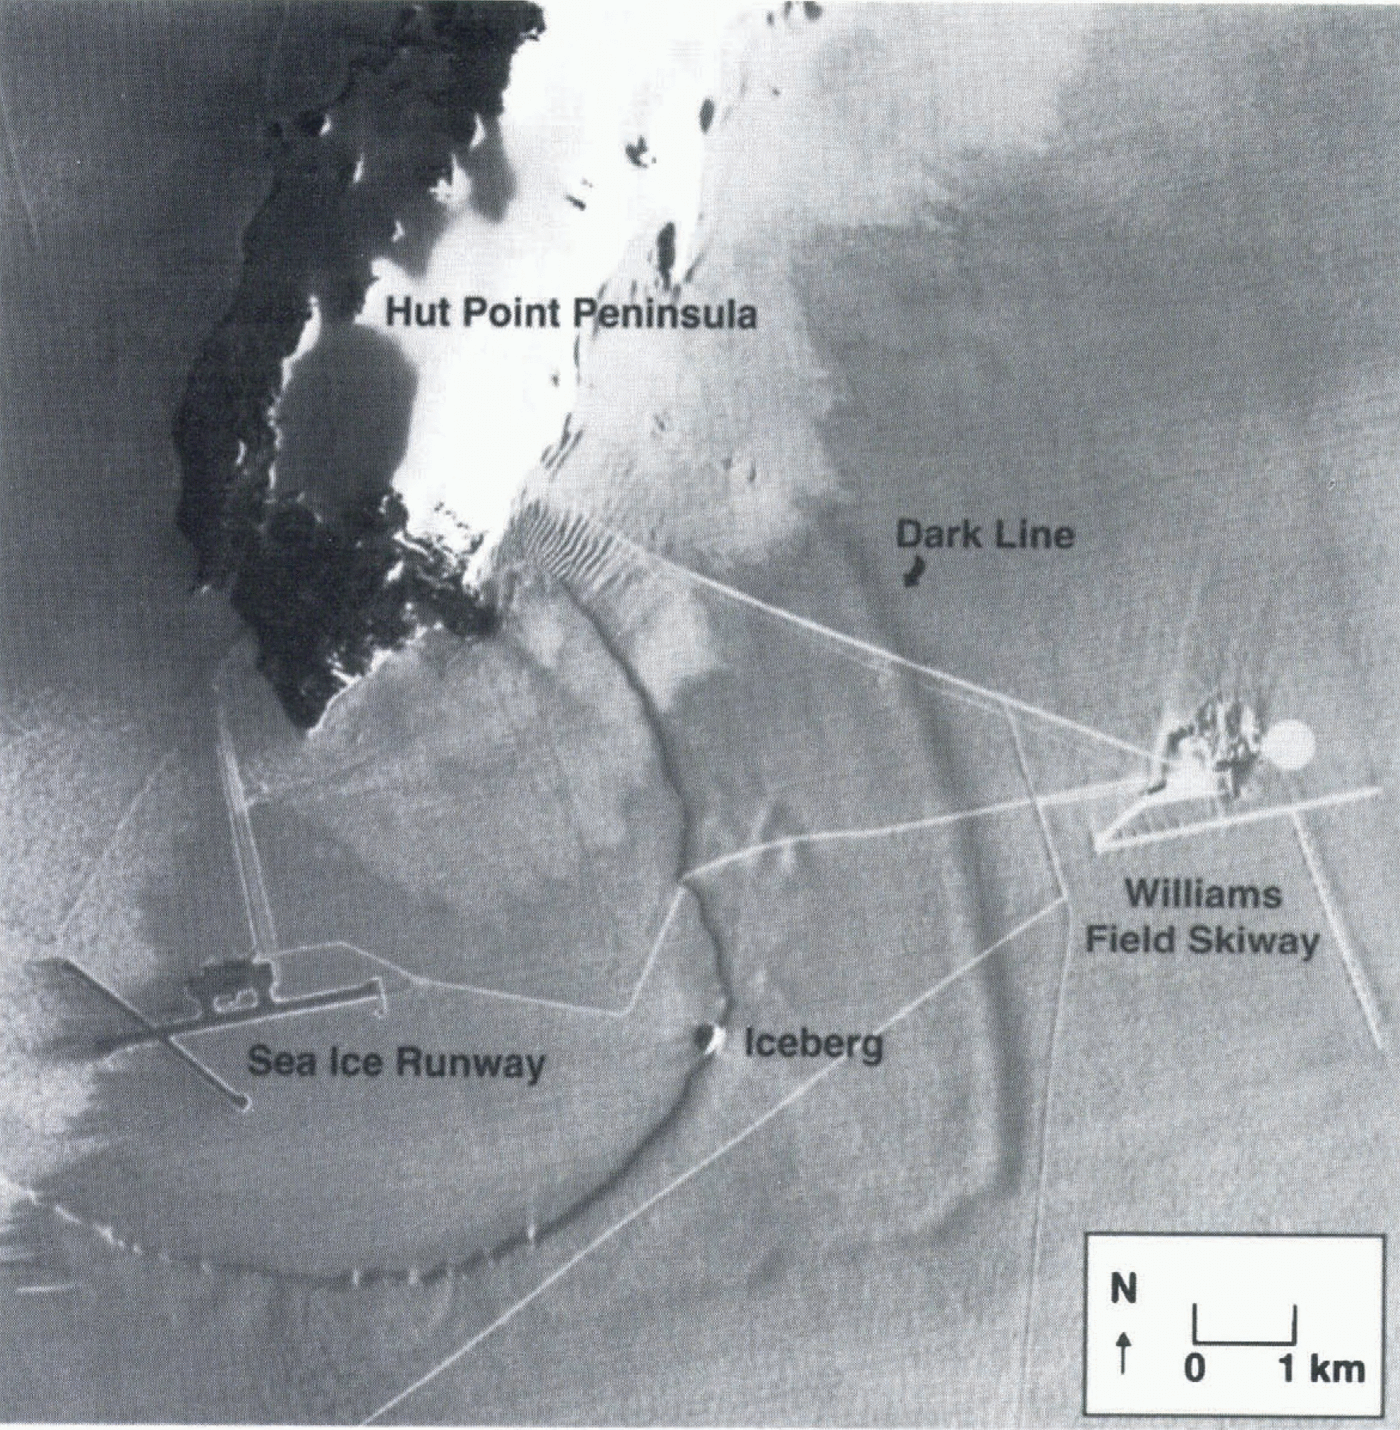
A SPOT (Système pour l’Observation de la Terre) satellite image of the McMurdo region of Antarctica taken in December 1994 (figs 1 and 2) reveals a dark line on McMurdo Ice Shelf parallel to the calving front. At first it was supposed that this line is the trace of a crevasse and a harbinger of a major calving event. The dark line does not appear on earlier images or photographs and so indicates something new. The operational importance of the line arises because it crosses the road that joins the major United Slates and New Zealand bases with Williams Field skiway, which is used for fixed-wing air operations. A calving event along
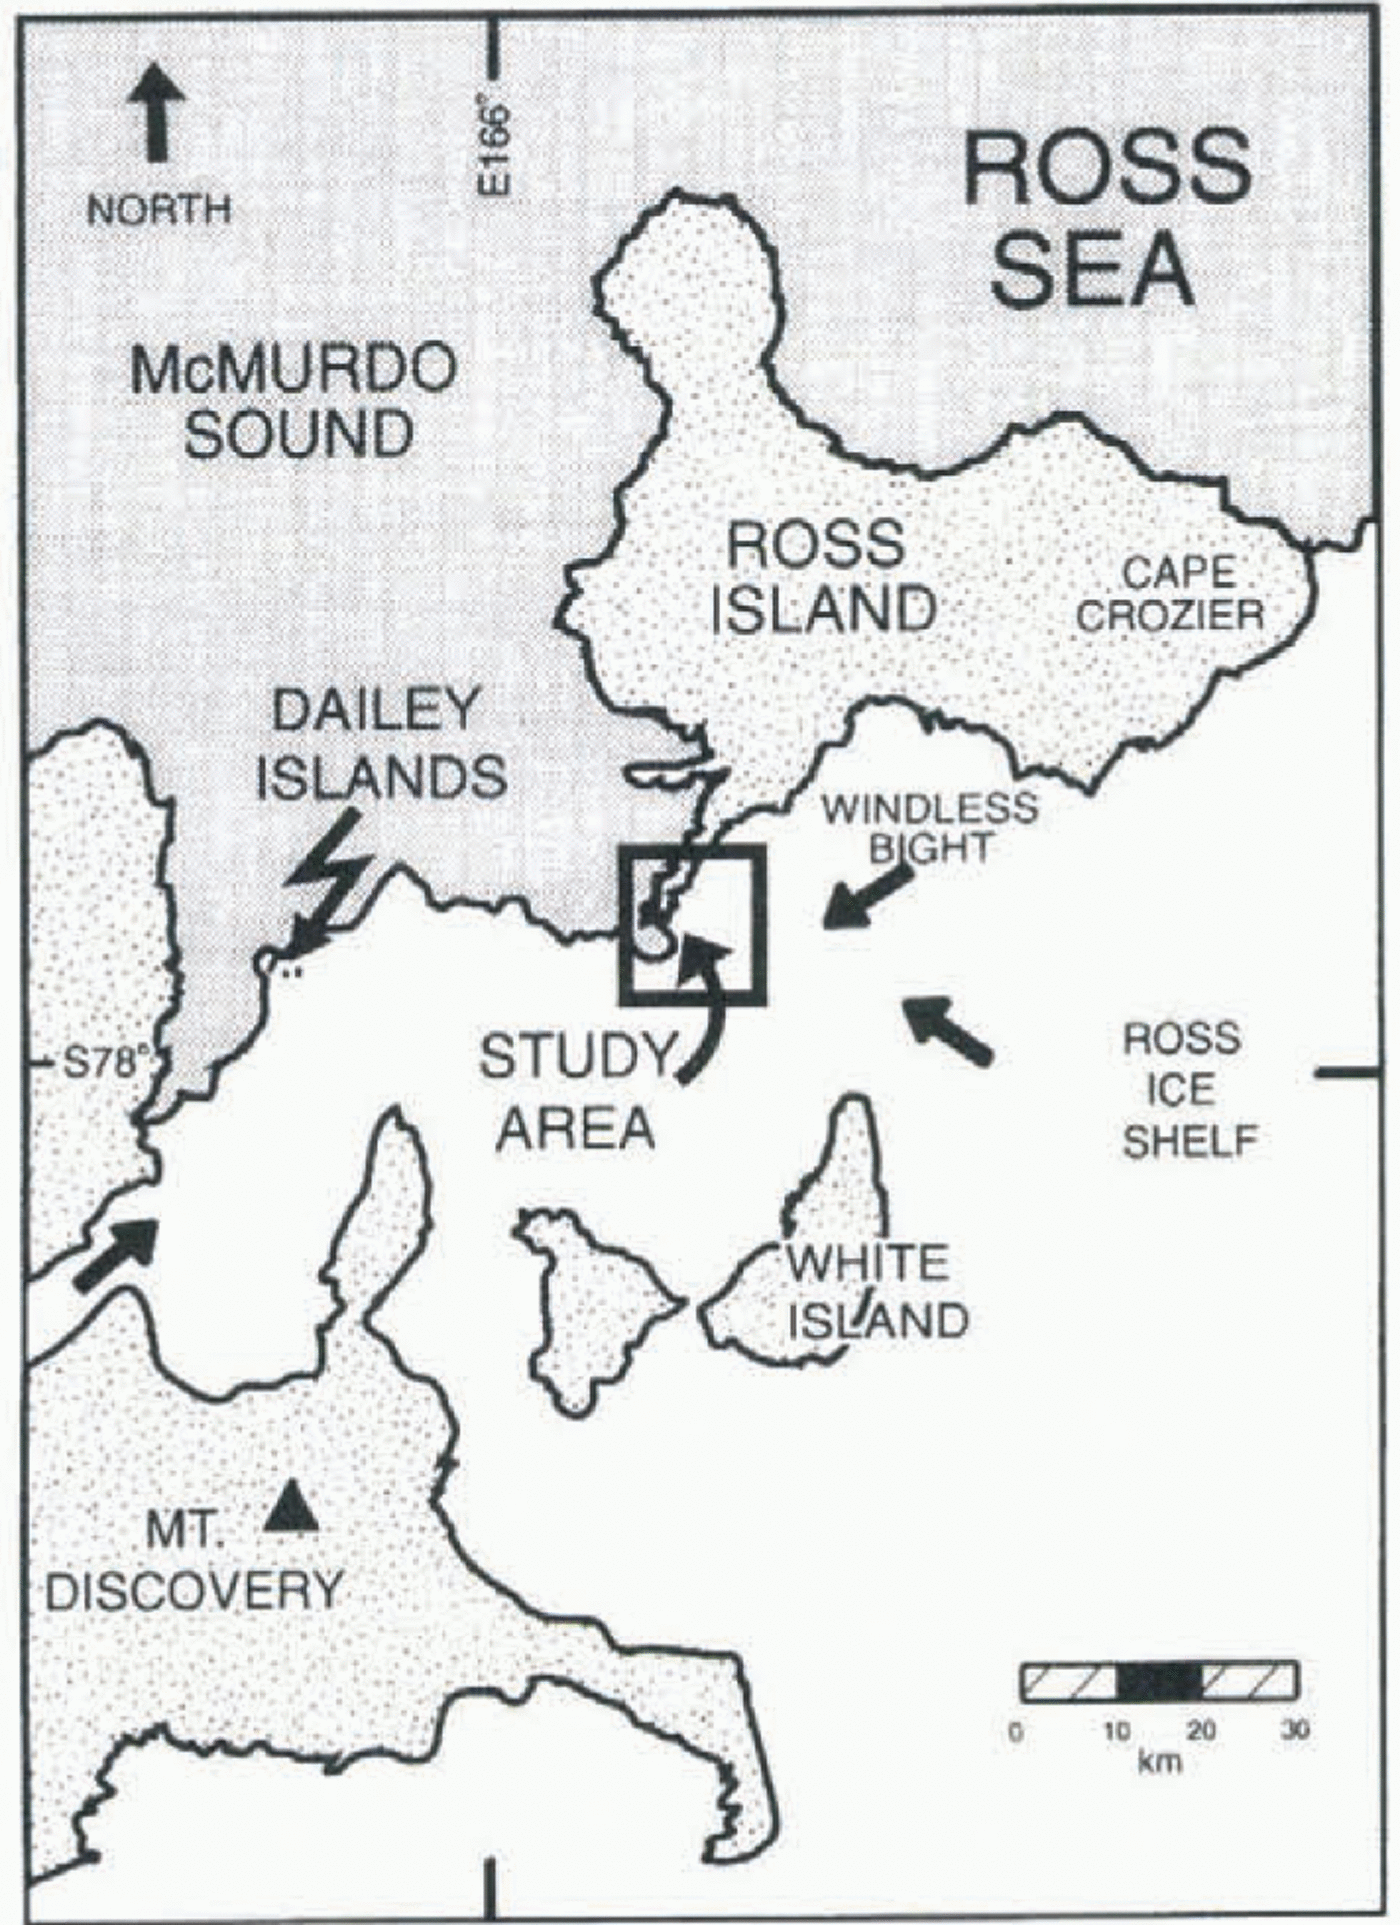
Fig. 1. Location of study area.
the line would make access to and from the skiway considerably more difficult.
Support for a crevasse origin comes from closer study of the image. The feature is not just a dark line, but there is a parallel bright line on the seaward side of the dark line. This suggests paired opposing surface slopes, as on a sagging bridge over a crevasse. Moreover, the geometry of the line is very simple, as are many transverse crevasses, and it is parallel to the calving edge, which would be the orientation of the last crevasse that led to calving. The line changes orientation at the suspected boundary between ice originating from local glaciers and ice that travelled great distances on Ross Ice Shelf. The putative crevasse may change orientation to follow a line of weakness associated with a suture between these different ice types. The evidence for a crevasse origin seems quite strong.
An alternate and less dramatic interpretation of the line is that it may be a slep in surface elevation due to a collapse of firn seaward of the line. This part of the ice shelf is very thin (only 30–45 m thick; Paige, 1969), such that the firn-to-ice transition lies below sea level (Kovacs and others, 1982). This means that sea water can soak horizontally into the firn. Brine-infiltration fronts have been observed by radar and by direct drilling up to 15 km from the outer edge of the ice shelf (Kovacs and others, 1982; Morse and Waddington, 1994). The dark line discovered on the image is about 3 km from the edge. Perhaps the snow surface seaward of the dark line has collapsed due to the weight of brine (suggested as possible by Kovacs and others (1982) for a similar feature) or to weakening of firn structure by percolating brine.
A field investigation was undertaken in October 1995 to determine if there is an opening crevasse at this site. Field-work involved repeat surveys of markers set in the surface of the ice shelf for the purpose of measuring elevation and horizontal strain. If the dark line is due to a sagging crevasse bridge, rather large strain rates are expected across the line. Also, the dark line should be travelling with the ice shelf. Moreover, surface elevations should show a depression at
Part of a SPOT HRV image (ID: 30445569412011812251P) taken on 1 December 1994 (pixel size 10 m; north toward top; sun direction from east; scale as in Figure 3). Labels indicate the principal features. The roads appear brighter than the country snow surface. This is because graders and tracked vehicles break up the surface and create large roughness at the 0.05 m scale that increases brightness. There is often a dark line on the side of roads facing away from the sun caused by berms due to repeat traffic or neighboring berms due to snow removed from the road. A sharp, ragged boundary between surface snow types crosses from the ice shelf to sea ice and back onto the ice shelf. Surface hoar is brighter than drift snow.
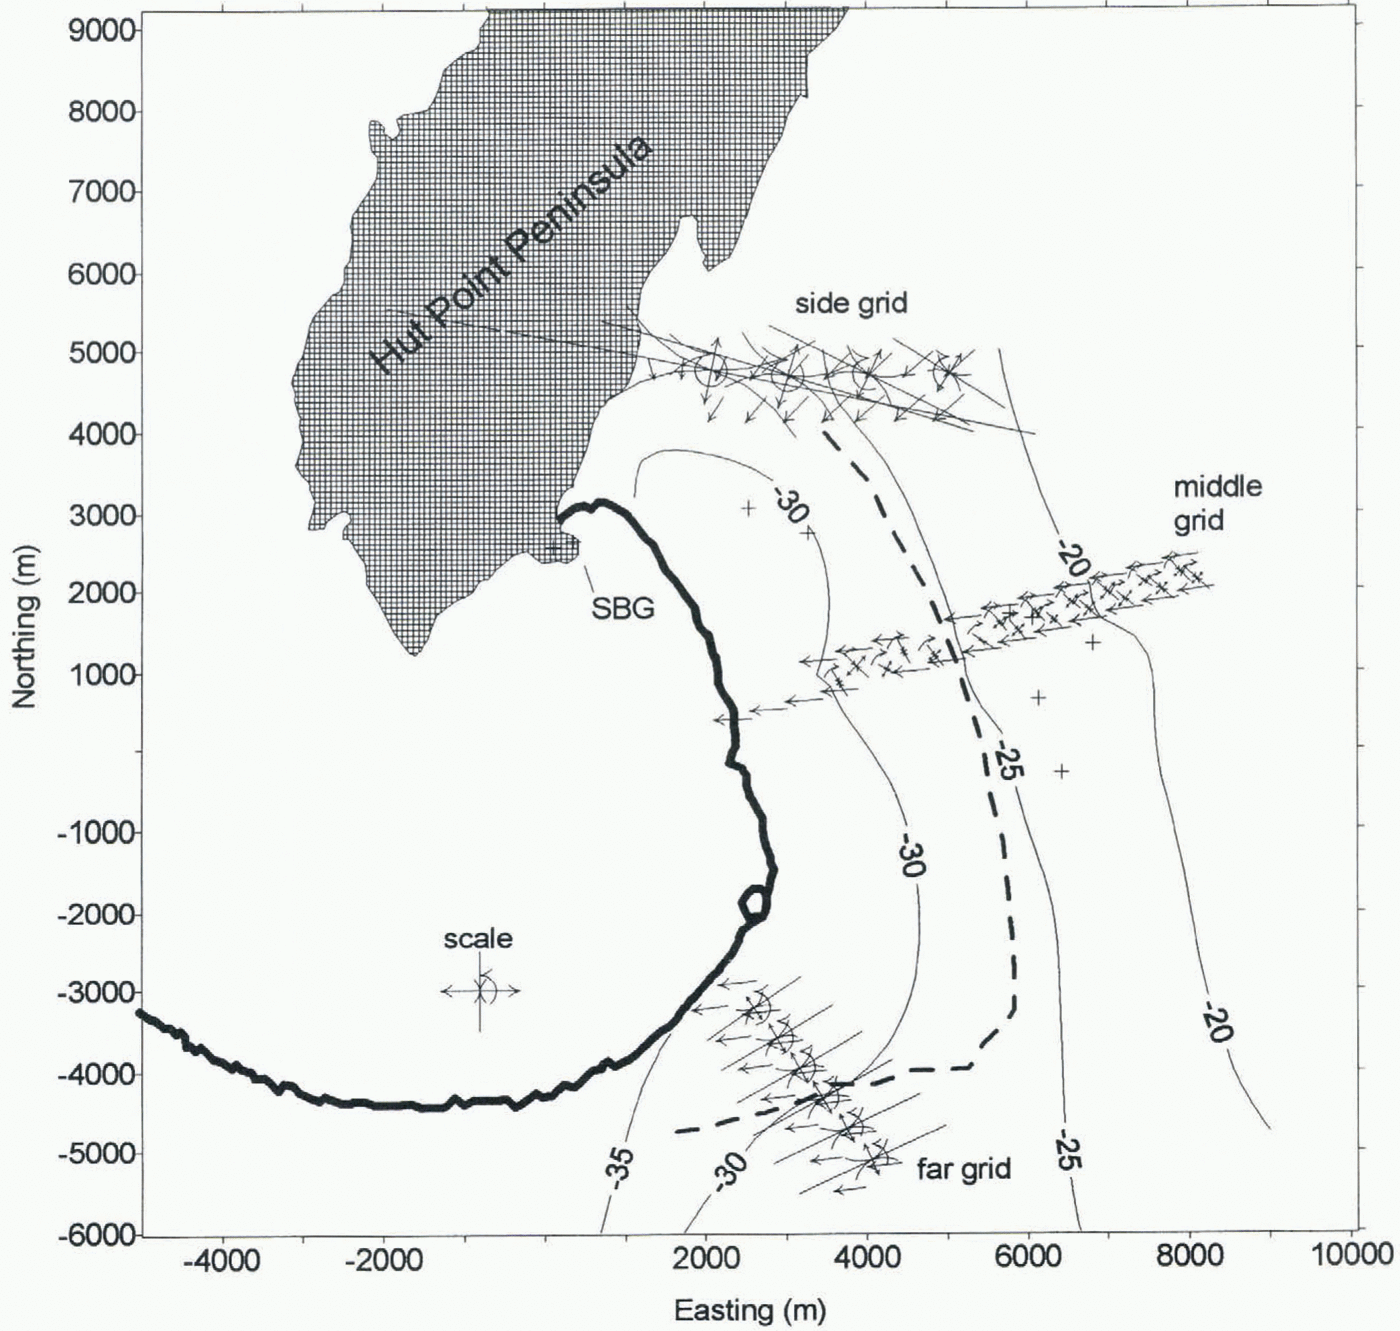
the line. However, if the dark line is the surface manifestation of an infiltrating brine front, surface elevations will show a step, horizontal strain rates will not be especially large at the line, and the position of the step will likely have migrated up-glacier from features travelling with the ice since the time of the image. To check these two hypotheses, surveys were conducted along three double rows of markers: a “side” grid near Hut Point Peninsula, a “middle” grid next to Williams Field skiway, and a “far” grid to the west of an iceberg trapped against the ice front (Fig. 3).
Methods
Most of the markers in the grids are extruded steel tubing of 1 in (25 mm) internal diameter. Each is 10 ft (3 m) long and they were pushed into the firn by hand until about 1.8 m remained exposed. The height of the markers is supposed to be sufficient that the heads of operators do not block global positioning system (GPS) signals, yet short enough to be reasonably stable in the wind during occupation times.
Markers near the skiway are wooden posts set in hand-augered holes. This alleviates concern that steel poles could be mistaken for skiway approach markers on aircraft radar. Their exposed length is also about 1.8 m. Holes in the top are nominally of 1 in diameter, but they are sufficiently smaller than the internal diameter of the steel pipes that a special antenna mount is needed.
The surveys were conducted using phase-tracking GPS receivers in stop-and-go (e.g. Hulbe and Whillans, 1994) and fully kinematic modes. The roving receiver and antenna were towed on a sled. At each marker the antenna was moved to the pole top and five epochs of data at 5 s intervals were collected. A special connector assures an unambiguous fitting of the antenna to the mark. The data were variously processed to provide positions of only the marker tops (for motion surveys) or of the antenna for every 5 s, including travel (for elevation profiles of the snow). The first surveys
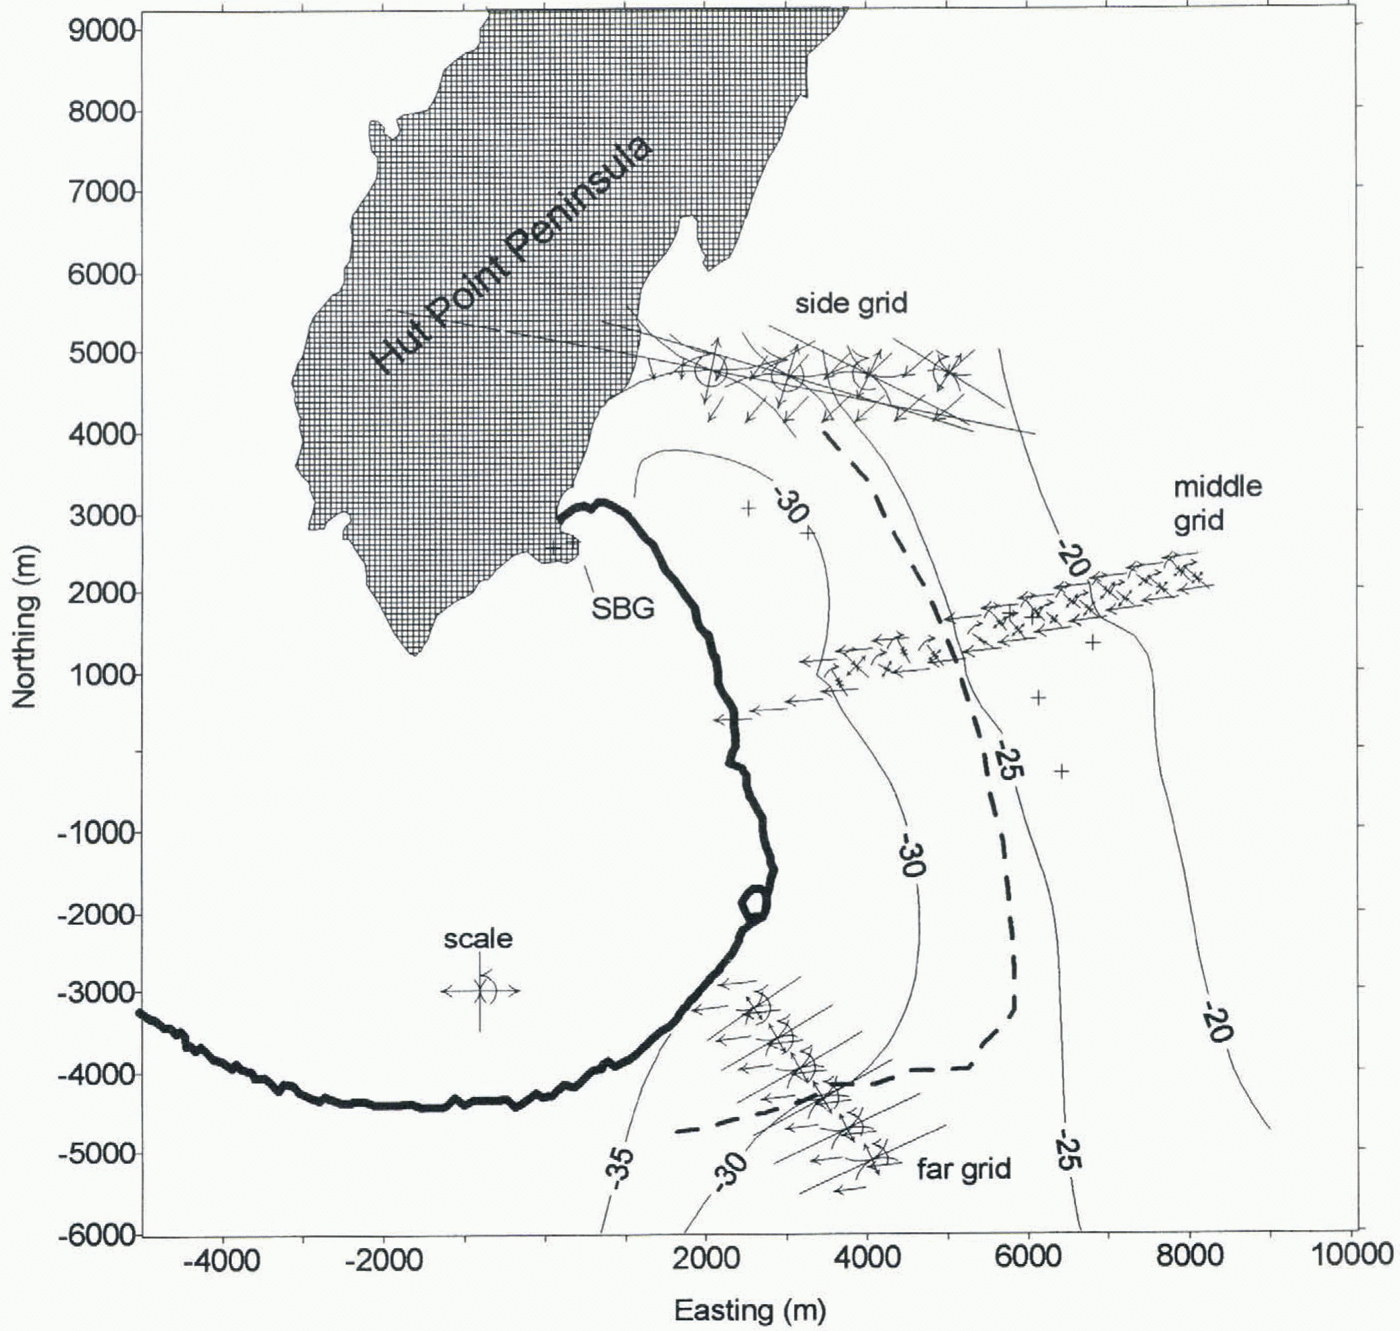
Map of measured ice velocities, strain rates, rotation rates and elevations. The scale and limits to the map are the same as in Figure 2. Velocity arrows are straight and single. Their length corresponds to motion extrapolated to 5 years in the future. Heels of velocity arrows are at marker locations. Paired straight arrows represent principal strain rates (divide each length in meters by 105 to obtain strain rate in a–1). Curved arrows indicate rotation rate at same scale as single strain-rate arrows. The isolated strain figure shows scale: each arrow represents 0.005 a–1. Only every second strain figure is depicted for the side grid. Road intersections are indicated by + symbols. Contours show relative elevations (interval 5 m).
(on Julian day 310, 1995) used Ashtech model Z12 receivers; the second surveys (on Julian day 335, 1995) used Trimble model 4000SE receivers.
Each survey uses two pivot receivers, one on rock and the other within each survey grid. The pivots are reference receivers used in calculations of differential GPS. The rock-based pivot station (SBG in Figure 3) is a 1957 monument marking a gravity site next to the road near Scott Base. There is a further pivot site within each of the strain grids. The purpose of the dual pivot scheme is to: (1) obtain absolute motions of markers on the ice shelf by repeat ties to rock (using SBG), (2) automatically remove tidal effects (using a floating pivot on the ice shelf), and (3) make more probable the determination of phase-integer ambiguities by keeping baselines short (using the pivot within each grid). The third consideration is important for some surveys because phase-integer ambiguities are not determined between the rock-based pivot and the roving receiver, but the two pivots can be precisely linked to one another because of much longer tracking times. The scheme yields both precise and accurate positions and motion.
A further static the was made between SBG and an Italy/New Zealand GPS station at Scott Base (leftmost cross on Hut Point Peninsula in Figure 3). This allows a calculation of a the to a global reference frame, although this was not done in this study.
For this report the survey reference frame moves with the ice shelf to most easily study features travelling with the glacier. The frame is tied to road intersections and skiway approach markers that also show on the image (some road intersections are indicated by + symbols in Figure 3). To make interpretations of elevation profiles simple, the local coordinate system has its origin at the intersection of extrapolations of lines running through the middle and far grids.
This results in coordinates for the Italy/New Zealand station: (113.30, 2560.32) m, (easting, northing), “ellipsoidal” height = –5.02 m. True elevations above sea level are larger than the elevations presented here. Also, because we did not perform the tie between our surveys and the global reference frame, true ellipsoidal heights have an unknown constant offset from the values presented here.
Errors made during the surveys mean that precise velocities are unavailable for four of the markers of the middle grid. During the first survey there were many losses of lock on satellites, so that phase-integer ambiguities are not resolved for three markers of the middle grid. It is suspected that radio noise from the engine of the Skidoo disturbed tracking. Consequently, the second survey employed a much longer tow rope (about 9 m from engine to antenna on sled). The second survey had greater success, but because it also uses different GPS equipment and was conducted in warmer weather, it is uncertain if lengthening of the tow rope is important. During the second survey one of the markers was occupied when the constellation of satellites was poor, and so a reliable baseline is not obtained. The vectors shown in Figure 3 use only measurements for which integer phase ambiguities were resolved for both surveys.
Each survey is accurate to better than 0.01 m in the horizontal. Considering that the two surveys were conducted 25 d apart, the velocities are accurate to about 0.2 m a–1, or about 0.2% of typical speeds. The markers are about 500 m apart, so strain rates are accurate to 0.0006 a–1, or about 10% of typical values obtained.
Elevation Results
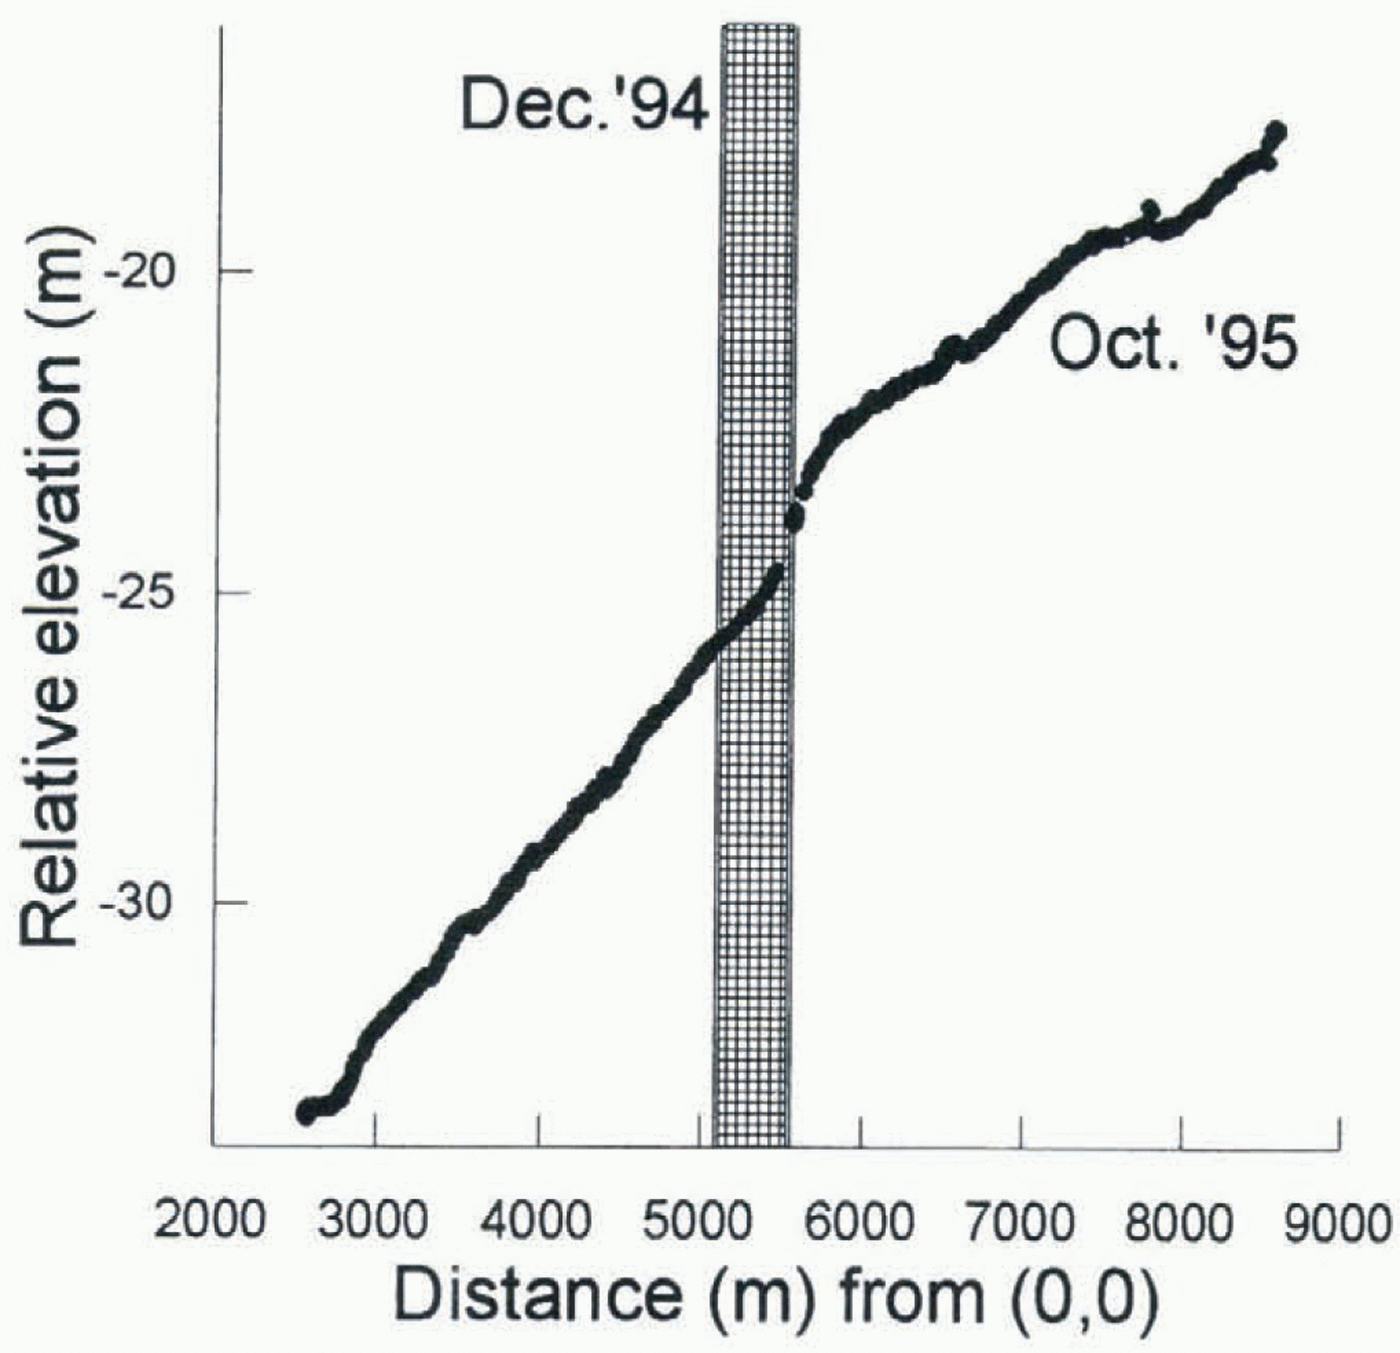
Relative elevations are available every 5 s during the surveys. An elevation profile for the middle grid is shown in Figure 4. The elevations are WGS84 ellipsoidal heights with a constant, unknown offset.
The elevation profile for the middle grid shows a rise
Relative elevations along middle grid in October 1995. Distance is from origin of coordinate system as shown in Figure 2. Vertical bar indicates the location of the dark line in the satellite image (December 1994).
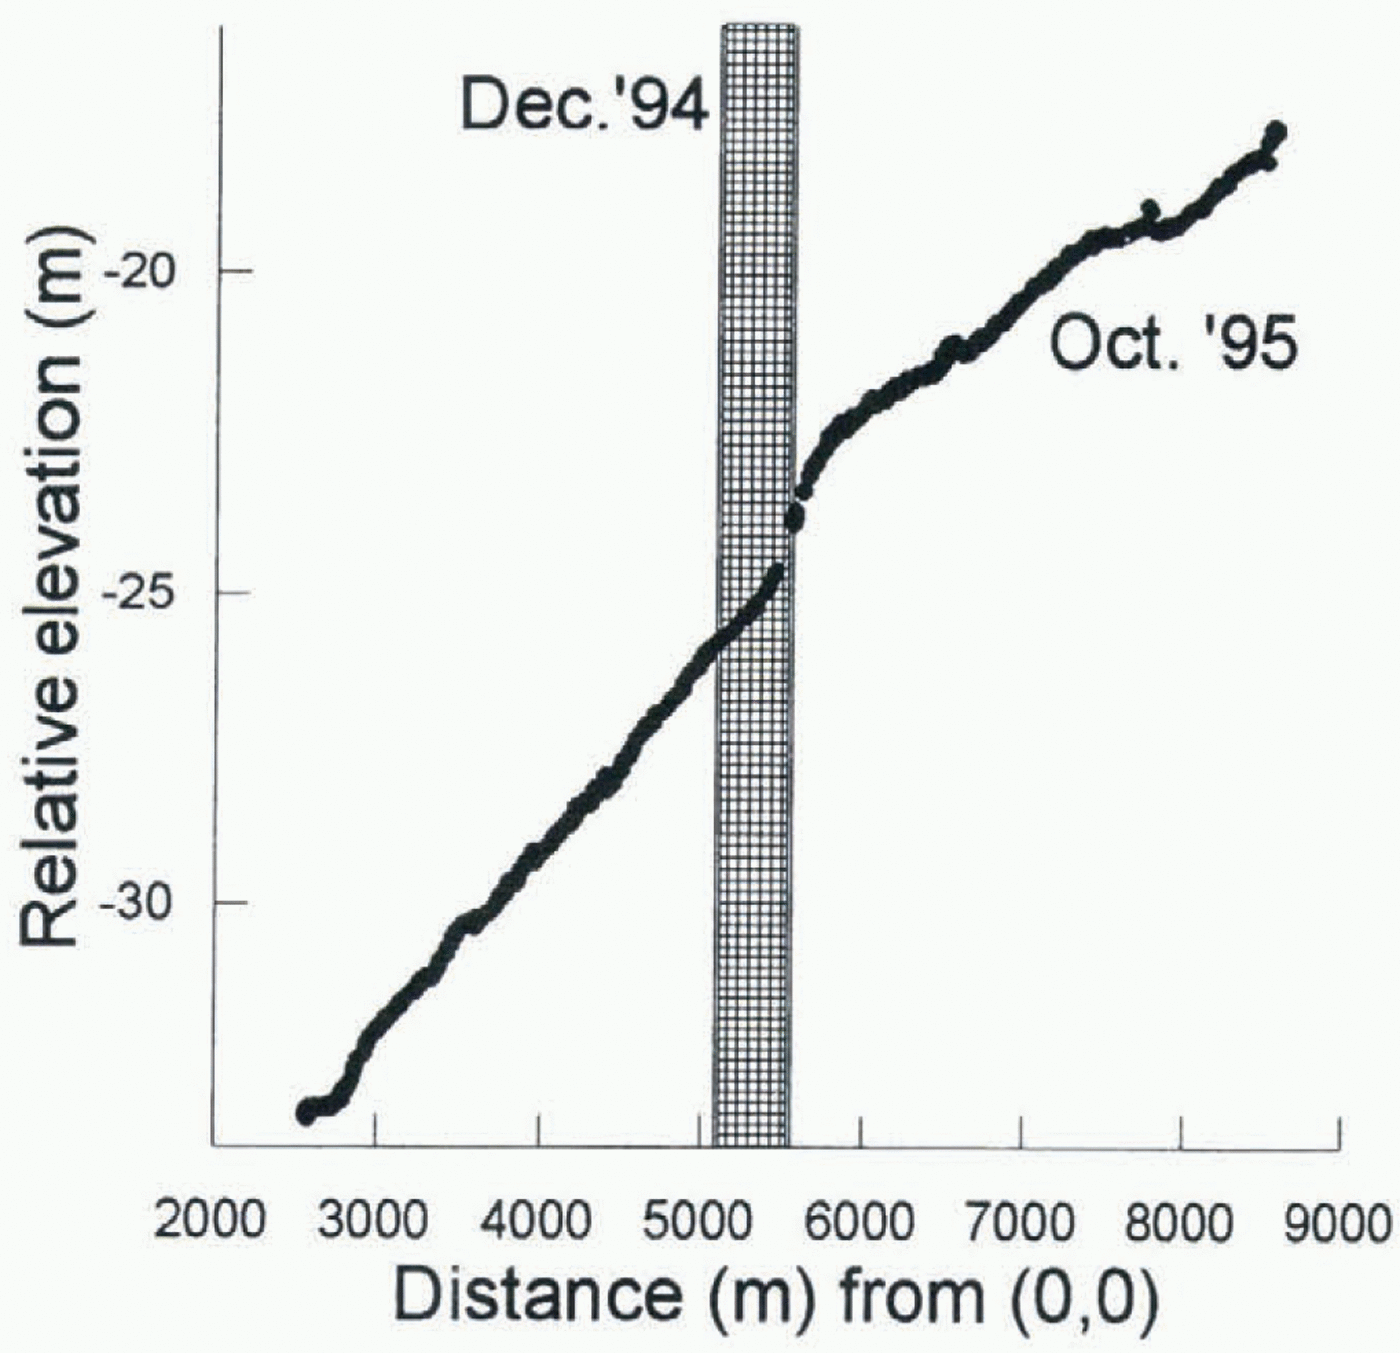
that is probably the same feature as the dark line on the image. The steep gradient at 5.6 km would generate a dark line on an image taken with solar illumination from the east (as is the case with SPOT images). There is no important reverse gradient to the elevation profile that can account for a bright secondary line on the image (Fig. 2). However, the main step has migrated up-glacier about 230 m during the 1 year interval between the imagery and fieldwork.
There was a very similar step in elevation in January 1977 in the vicinity of the middle grid (Kovacs and others, 1982) at about the same position as the present dark line. It was about 1.5 m high (the step in 1995 is 1 m or more high). The 1977 brine front moved up-glacier at about 380 m a–1. The step was due to horizontal infiltration of brine that started with a calving event 7 years earlier.
The features at the far grid are not clear on the image or in the elevation profiles. There is a step in elevation only on the southwest side, about 300 m farther up-glacier than on the image. It seems that the dark line and step feature are not continuous in this region of the ice shelf. The feature migrates against ice flow.
In the vicinity of the side grid there is no dark line on the image. Rather there is an edge that is probably a change in surface snow type.
Velocity Results
Figure 3 shows velocities, represented by single straight arrows. Velocities are about 100 m a–1 westward, as reported by Paige (1969) and Morse and Waddington (1994).
Strain rates and rotation rates are shown in Figure 3 between the velocity arrows. Double, opposed straight arrows represent principal strain rates; most values are in the range 0.001–0.010 a–1. Curved arrows represent rotation rates.
Shearing is of opposite senses in the side and far grids, and the middle grid shows mild left-lateral shearing in the same sense as the side grid. This indicates that the kinematic center line, where simple shearing is zero, must be just south of the middle grid, at about Williams Field skiway.
Along-motion strain is also rapid in the side and far grids, but nearly zero in the middle grid. This compression must be due to stresses caused by blocking effects of Hut Point Peninsula (for side grid) and Dailey Islands (for far grid). Dailey Islands are about 2.5 km southwest of the study area (Fig. 1).
Across-motion strain is minor compression nearly everywhere.
These strain-rate patterns illustrate that the motion of the ice shelf is primarily controlled by lateral drag and compressive stresses at the northern and southern margins.
There are no special or different horizontal strain rates in the vicinity of the mysterious dark line. Locally fast stretching would be expected if there were an opening crevasse, but such stretching is not observed. The strain rates are much smaller than those associated with the generation of crevasses elsewhere (Vaughan, 1993). If the dark line marks a crevasse, the causative stresses must somehow have ceased. That would seem improbable.
Discussion
The results do not support the interpretation that the dark line is the trace of an opening crevasse. Strain rates across it are too small for an opening crevasse and there is no sagging bridge. Moreover, the feature is moving with respect to the ice. The potential alarm raised from initial interpretations of the image can be relaxed.
Most of the observations fit the model of the line marking the limit of firn collapse due to infiltrating brine. These observations include the shape of the surface, the migration of the feature and the simple pattern of horizontal strain rates. The dark line seems to mark the inland extent of firn collapse above ongoing brine infiltration.
The simple geometry of the line (and of another, more distant front also reported by Kovacs and others (1982)) seems surprising if it is due to brine infiltration. Perhaps the simplicity is due to the simple geometry of the ice shelf. Ice shelves are spatially slowly varying in thickness and firn properties as a result of nearly uniform snow deposition and of creep dissipation of any thickness anomalies (Casassa and Whillans, 1994). The ice shelf becomes thinner toward the calving front due to basal melting (Kovacs and others, 1982). Basal melting is in large part controlled by the original internal temperature of the ice shelf, which is ordinarily spatially smooth. Thus the thickness decreases in a simple manner toward the calving front. Consequently, the elevation of the firn decreases smoothly toward the calving front. Brine ran infiltrate to a distance largely determined by firn permeability and elevation. The simple form of the dark line may be due to the simplicity of ice-shelf thickness and depth–density variation.
The line bends westward at about (easting, northing) = (6000, –3000) m (Fig. 3), and becomes less smooth (Fig. 1). We speculate that ice to the south is less permeable to brine infiltration. A difference in the origin of this ice is indicated by measurements of ice velocity on McMurdo Ice Shelf by repeat satellite imagery (Whillans and Merry, 1996) that show that ice to the south derives from Ross Ice Shelf. Ice of the northern part of the studied region derives locally, from Ross Island. We speculate that ice from the two different origins has different depths to the firn-to-ice transition. Perhaps this is a result of larger accumulation rate in Windless Bight through which the Ross Island ice travels or of larger strains in ice from Ross Ice Shelf associated with its passage into McMurdo Ice Shelf. We suggest that this contrast in ice history makes firn densities larger at depth for ice imported from Ross Ice Shelf than for locally formed ice. Hence, brine infiltration is more difficult to the south, and the limit to infiltration bends at the boundary between the ice types.
The dark line is not observed on earlier photographs or images. Most photographs do not have sufficient brightness resolution to show the feature. One earlier Landsat the-matic mapper satellite image taken in 1989 shows no discernible feature; however, there is a cloud shadow in the relevant region that makes features difficult to detect.
The feature has not been observed by people along the roads, because the special elevation change associated with it is very small, being only 1 m over 500 m. We had to map it first with GPS, examine the map, and then look closely in the field to recognize it when standing on the ice shelf.
Unresolved by this study is the cause of the bright line on the image just seaward of the dark line. At first, this bright line was interpreted to be the far side of a sagging crevasse bridge. However, the elevation surveys show only a very minor reverse slope. Perhaps the reverse slope is a transient feature present in December 1994 but not in October 1995.
Although there seems to be no immediate threat of a calving event, the continued percolation of brine raises concern for the long-term stability of the ice shelf. Kovacs and others (1982) supposed that brine infiltration occurs after each major calving event. However, the present feature was not preceded by a calving event. Percolation must be a continuing process, perhaps permitted by continued lowering of the ice surface as the base melts away. The brine loads the ice shelf with extra weight and may weaken it through the introduction of salt from sea water. These are processes that contribute to the eventual calving of the ice shelf.
A new discovery is that a major mechanical control on the ice shelf is compression originating at Dailey Islands. Strain rates in the far grid show that these islands are important “pinning points” in controlling the ice shelf. However, the viability of the islands is in question. Gow and Govoni (1994) report that the ice shelf beyond and between the islands has broken away during the past 80 years. Evidently the ice shelf is becoming smaller. Its future form depends on how the ice shelf and Koettlitz Glacier, which enters north-eastward from west of Mount Discovery, interact with the islands. Presumably, if ice loses contact with some islands, resistive drags are concentrated on the other islands. This leads to a speeding of ice flow and ice-shelf thinning. At some limit the ice shelf must become too stretched and weakened to be viable, and hence break up. How close this limit may be is unclear, but with only two of the original six Dailey Islands now contributing to drag, the limit is closer than it was.
Acknowledgements
Thanks are extended to A. J. Gow, C. J. van der Veen and the referees for helpful comments. This work was supported by the U.S. National Science Foundation (OPP-9528608). This is Byrd Polar Research Center contribution No. C-1015.