





Introduction
Non-communicable diseases cause approximately 41 million deaths annually, representing 71% of all global deaths (Nanjappan and Gowda, Reference Nanjappan and Gowda2022). Physical inactivity is a key modifiable risk factor, linked to coronary heart disease, type 2 diabetes, and several cancers, yet the majority of the global population remains insufficiently active (Haileamlak, Reference Haileamlak2019). In response, the WHO’s Global Action Plan calls on governments to develop strategies for reducing physical inactivity (World Health Organization, 2013). In Norway, this has been operationalised through the establishment of Healthy Life Centres (HLCs) within primary health care, as municipal services targeting individuals who struggle to access appropriate health support (Norwegian Ministry of Health and Care Services, 2013); Norwegian Directorate of Health, 2016).
Several studies have examined the effects of HLC interventions. Blom et al. (Reference Blom, Aadland, Skrove, Solbraa and Oldervoll2020) found that a three-month behaviour change programme improved health-related quality of life, with effects sustained at 15 months, though PA levels declined after the initial intervention period. In a six-month RCT with 24-month follow-up, Samdal et al. (Reference Samdal, Meland, Eide, Berntsen, Abildsnes, Stea and Mildestvedt2018) reported no significant intervention effect on objectively measured PA or sedentary behaviour. The authors noted that wearable devices may themselves act as a behaviour change tool, potentially confounding results in both groups. A subsequent analysis found that autonomous motivation and self-rated health supported weight loss, underscoring the role of motivational factors in HLC outcomes (Samdal et al., Reference Samdal, Bezuijen, Mongstad Øyvin, Eide, Abildsnes, Mildestvedt and Meland2021; Gryte et al., Reference Gryte, Meland, Samdal, Fadnes, Vold Jørn and Mildestvedt2024).
Self-determination theory (SDT) is one of the most widely used frameworks for understanding motivation in health behaviour change (Ryan and Deci, Reference Ryan and Deci2000). SDT distinguishes between autonomous motivation, driven by personal values and genuine interest, and controlled motivation, driven by external pressure. A third category, amotivation, refers to a lack of intention to engage in a behaviour. Autonomous motivation is consistently associated with more sustained behaviour change, while controlled motivation and amotivation tend to undermine long-term adherence (Deci and Ryan, Reference Deci and Ryan2008). A related concept is psychological defiance, describing a tendency to resist external advice or authority (Van Petegem et al., Reference Van Petegem, Vansteenkiste and Beyers2013).
While previous HLC studies have relied primarily on objective PA measurement using accelerometers such as the SenseWear Armband, self-reported PA (SR-PA) offers a complementary perspective. SR-PA is widely used in public health research due to its feasibility and low cost and has been shown to correlate reasonably well with objective biological markers of cardiovascular health (Holen et al., Reference Holen, Rønnaug, Mildestvedt, Eide and Meland2012). SR-PA captures participants’ perceived activity levels, which may be more sensitive to intervention-related changes in behaviour than device-based measures, particularly when the devices themselves influence activity. However, the responsiveness of SR-PA to HLC interventions, and the motivational and sociodemographic factors that predict it, remain poorly understood.
Aim
This study aimed to examine changes in SR-PA following participation in a three-month behaviour change intervention at Norwegian HLCs, compared with a waiting-list control group. In addition, we explored whether motivational and sociodemographic factors predicted SR-PA levels and changes over a six-month follow-up period.
Methods
Design
Participants were eligible for inclusion if they met the criteria for services offered by the HLCs. They had to be at least 18 years old, and able to engage in a group programme delivered in Norwegian. Individuals with severe mental illness, learning disabilities, or those seeking only a tobacco cessation intervention were excluded. The study was preregistered at ClinicalTrials.gov (NCT02247219). The study protocol has been published previously (Abildsnes et al., Reference Abildsnes, Meland, Mildestvedt, Stea, Berntsen and Samdal2017) and is available online.
Randomization and allocation concealment
Participants were randomized using a random number list with a 1:1 allocation ratio. A project coordinator working outside the HLC premises assigned participants to the intervention or waiting-list control group using numbered sealed envelopes after baseline assessment and registration of inclusion data. Allocation concealment was thereby ensured for personnel involved in participant enrolment. Randomization was stratified by trial site and performed in blocks of 20 to avoid uneven distribution across HLCs. Baseline characteristics were assessed descriptively to evaluate comparability between groups following randomization.
Setting
Twelve HLCs from the West and South coasts of Norway were invited to participate in the study. Four of them declined, one due to concurrent research activity. The remaining eight municipalities represented a combined population of 630,000, including both rural and urban areas (6,000–270,000 residents). Since one HLC served three municipalities, six centres were included.
The intervention
Participants began with an individual counselling session (30–60 minutes) to set behaviour change goals using motivational interviewing and cognitive behavioural therapy techniques. During the three-month programme, they received self-help resources such as apps, recipes, and cookbooks and participated in group-based PA classes. The sessions included Nordic walking, competitive games, light strength training and stretching tailored to their health needs. Attendance at a minimum of two sessions per week was required. The specific implementation of interventions varied across HLCs depending on local policy, competence, and resources.
In addition, they were offered a Healthy Eating course (10 hours) covering nutrition fundamentals. After 12 weeks, progress was reviewed, and support could be extended for up to a year if needed. Participants were encouraged to transition to local resources to sustain their progress.
Study period, population and data collection
Self-reported measurements of physical activity
The study period, participant flow and data collection are presented in Figure 1. To assess SR-PA, the survey included two questions about exercise habits. The questions were comparable to a Norwegian population survey (Krokstad et al. Reference Krokstad, Langhammer, Hveem, Holmen, Midthjell, Stene, Bratberg, Heggland and Holmen2013). The first question asked was: ‘On average, how long are you physically active each day?’ with the following response options:
-
1. Less than 10 minutes each day
-
2. 11–20 minutes each day
-
3. 21–40 minutes each day
-
4. 41–60 minutes each day
-
5. More than 60 minutes each day
A total of 351 individuals were invited to participate, referred by either a general physician or public services. After applying research criteria and excluding those who declined the intervention, 118 participants were enrolled and randomized to an intervention group (n = 57) and a control group (n = 61). Following three months of intervention and a six-month follow-up, 32 participants dropped out (15 from the intervention group, 17 from the control group), leaving 86 participants (42 in the intervention group, 44 in the control group) for final analysis. Data collection was conducted at baseline and at six months.

The second question asked about exercise intensity: ‘How hard do you exercise?’ with the following response options:
-
1. I take it easy without getting breathless or sweaty
-
2. I get a little breathless and sweaty
-
3. I definitely get breathless and sweaty
-
4. I am almost totally exhausted
Responses were categorized using a Likert scale with five options for one question and four for the other. The five-answer question was recoded into four categories. The scores from these two questions were then used to create a normally distributed composite score utilized in sensitivity analyses.
Predictors (explanatory variables)
Participants’ education levels were categorized into three groups: Low (upper-secondary school or below), Middle (upper-secondary school general studies or vocational training), and High (university or university college).
Self-efficacy for PA was measured using a questionnaire previously utilized in Norwegian studies (Hansen et al., Reference Hansen Børge, Ommundsen, Holme, Kolle and Anderssen2014). Participants rated their confidence in carrying out planned PA despite potential barriers on a 7-point Likert scale, ranging from ‘not at all confident’ to ‘extremely confident.’
Social support for PA from friends and family was assessed using a six-item scale. This scale was developed by Sallis et al. (Reference Sallis, Grossman, Pinski, Patterson and Nader1987) and has been previously utilized in Norwegian studies (Hansen et al., Reference Hansen, Anderssen, Steene-Johannessen, Ekelund, Nilsen, Andersen, Dalene and Kolle2015).
Psychological defiance, defined as a tendency to resist or reject advice and opinions from authority figures, was measured with four items originally developed in research on parenting styles and shown to have strong internal consistency. The wording of these items was adapted to the context of this study (Van Petegem et al., Reference Van Petegem, Vansteenkiste and Beyers2013; Vansteenkiste et al., Reference Vansteenkiste, Soenens, Van Petegem and Duriez2014).
The Treatment Self-Regulation Questionnaire (15 items) was used to measure the extent of autonomous or self-determined motivation for a behaviour. This instrument has been validated by Levesque et al. (Reference Levesque, Williams, Elliot, Pickering, Bodenhamer and Finley2007) and used in Norwegian studies (Mildestvedt et al., Reference Mildestvedt, Meland and Eide2007). The questionnaire included subscales for amotivation (3 items), controlled motivation (6 items), and autonomous motivation (6 items), all rated on a 7-point Likert scale from ‘strongly disagree’ to ‘strongly agree.’ Example items included: ‘I really don’t think about it,’ ‘Because I want others to see that I can do it,’ and ‘Because I feel responsible for my health.’
Internal consistency reliability in the current sample was acceptable to high for most scales. Cronbach’s alpha was 0.93 for self-efficacy for physical activity, 0.85 for social support for physical activity, 0.81 for autonomous regulation, 0.73 for controlled regulation, 0.56 for amotivation, and 0.73 for general social support (OSS-3).
Statistical analysis
All statistical analyses were conducted using SPSS (IBM Statistical Package for the Social Sciences, version 29.0.1.0). We report unstandardized regression coefficients (B) with 95% confidence intervals (CI), emphasizing effect sizes and their precision rather than p-value thresholds. In addition, intervention effects were expressed in standardized units by dividing B by the pooled SD at follow-up, providing an effect size comparable to Cohen’s d.
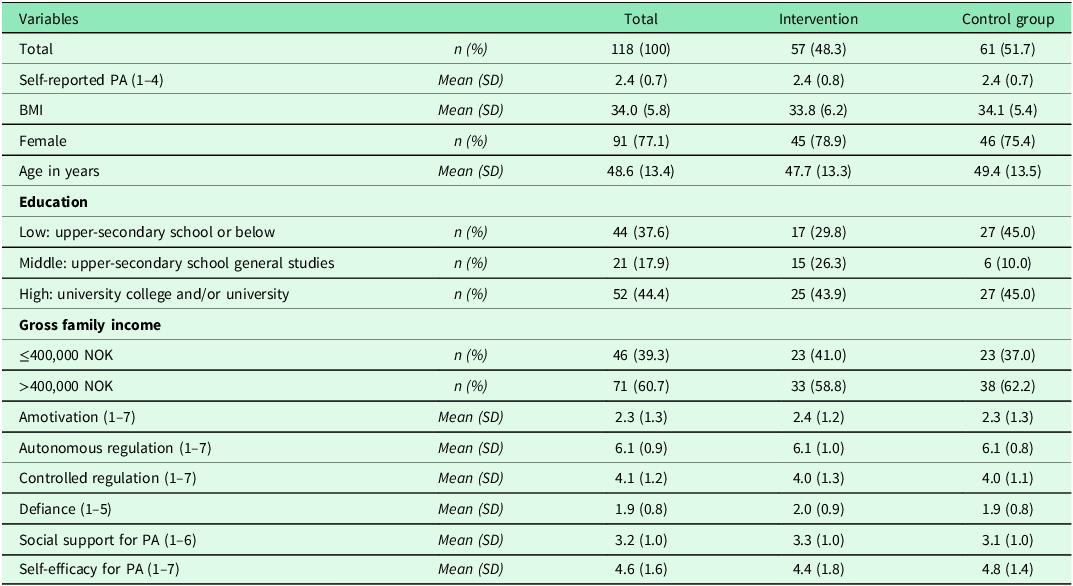
Descriptive statistics were used to summarize the data. Means and standard deviations (SD) were calculated for continuous variables, while categorical variables were reported as counts (n) and percentages (%) (Table 1).
Baseline characteristics of participants by intervention and control group. Continuous variables are presented as means and standard deviations (SD). Categorical variables are presented as counts (n) and percentages (%)

Table 1. Long description
A table comparing baseline characteristics of participants in intervention and control groups. The table has 15 rows and 5 columns. The columns are labeled Variables, Total, Intervention, and Control group. The rows are labeled with different variables such as Total, Self-reported PA, BMI, Female, Age in years, Education, Gross family income, Amotivation, Autonomous regulation, Controlled regulation, Defiance, Social support for PA, and Self-efficacy for PA. Each row provides data for the total participants, intervention group, and control group. For example, the Total row shows 118 participants overall, with 57 in the intervention group and 61 in the control group. The Self-reported PA row shows a mean of 2.4 with a standard deviation of 0.7 for both groups. The BMI row shows a mean of 34.0 with a standard deviation of 5.8 for the total, 33.8 with 6.2 for the intervention group, and 34.1 with 5.4 for the control group. The Female row shows 91 participants overall, with 45 in the intervention group and 46 in the control group. The Age in years row shows a mean of 48.6 with a standard deviation of 13.4 for the total, 47.7 with 13.3 for the intervention group, and 49.4 with 13.5 for the control group. The Education rows are divided into Low, Middle, and High categories, showing counts and percentages for each group. The Gross family income rows are divided into ≤400,000 NOK and >400,000 NOK categories, showing counts and percentages for each group. The Amotivation row shows a mean of 2.3 with a standard deviation of 1.3 for the total, 2.4 with 1.2 for the intervention group, and 2.3 with 1.3 for the control group. The Autonomous regulation row shows a mean of 6.1 with a standard deviation of 0.9 for the total, 6.1 with 1.0 for the intervention group, and 6.1 with 0.8 for the control group. The Controlled regulation row shows a mean of 4.1 with a standard deviation of 1.2 for the total, 4.0 with 1.3 for the intervention group, and 4.0 with 1.1 for the control group. The Defiance row shows a mean of 1.9 with a standard deviation of 0.8 for the total, 2.0 with 0.9 for the intervention group, and 1.9 with 0.8 for the control group. The Social support for PA row shows a mean of 3.2 with a standard deviation of 1.0 for the total, 3.3 with 1.0 for the intervention group, and 3.1 with 1.0 for the control group. The Self-efficacy for PA row shows a mean of 4.6 with a standard deviation of 1.6 for the total, 4.4 with 1.8 for the intervention group, and 4.8 with 1.4 for the control group.
SR-PA was the primary outcome, derived from two survey questions and recoded into a composite score with a normal distribution. This score formed the basis for the main analyses and was further examined in sensitivity analyses and correlation tests. Analyses were conducted as complete-case analyses including participants with available baseline and six-month follow-up data. Missing outcome data were not imputed due to the relatively small sample size and exploratory nature of the analyses.
The effect of the intervention on SR-PA was estimated using linear regression models (Tables 2 and 3). In subsequent analyses, associations between SR-PA and sociodemographic or motivational factors were examined with regression models. Two complementary approaches were applied:
SR-PA at baseline and 6-month follow-up for the intervention and control groups. Results are presented as means (SD), as well as regression coefficients (B), p-values, and 95% confidence intervals (CI)

Table 2. Long description
A table comparing SR-PA outcomes for control and intervention groups at baseline and 6-month follow-up. The table has 3 rows and 9 columns. The columns are labeled as Outcome, Baseline N, Baseline Mean, Baseline SD, 6 months follow-up N, 6 months follow-up Mean, 6 months follow-up SD, Regression B, Regression p-Value, and Regression 95% CI. The rows are labeled as (Control) and Intervention. For the (Control) group, Baseline N is 61, Baseline Mean is 2.4, Baseline SD is 0.7, 6 months follow-up N is 43, 6 months follow-up Mean is 2.4, 6 months follow-up SD is 0.7, Regression B is 0.00, Regression p-Value is not applicable, and Regression 95% CI is Ref. For the Intervention group, Baseline N is 57, Baseline Mean is 2.4, Baseline SD is 0.8, 6 months follow-up N is 42, 6 months follow-up Mean is 2.6, 6 months follow-up SD is 0.7, Regression B is 0.21, Regression p-Value is 0.18, and Regression 95% CI is (−0.10; 0.52).
Linear regression analysis of change in SR-PA from baseline to 6-month follow-up, adjusted for baseline SR-PA. Results are presented as unstandardized regression coefficients (B), p-values, and 95% confidence intervals (CI)

Table 3. Long description
A table with three columns and two rows. The columns are labeled B, p-Value, and 95% CI. The rows are labeled Baseline SR-PA and Intervention. The values in the table are as follows: Row 1: B, 0.49; p-Value, less than 0.001; 95% CI, (0.31; 0.68). Row 2: B, 0.26; p-Value, 0.06; 95% CI, (-0.01; 0.53). The table presents the results of a linear regression analysis, showing the unstandardized regression coefficients (B), p-values, and 95% confidence intervals (CI) for the change in SR-PA from baseline to 6-month follow-up, adjusted for baseline SR-PA.
-
1. Temporal causal analysis (Table 4): Predictors were entered individually into regression models adjusted for age, gender, and randomization group. This approach provides insight into predictors of SR-PA at follow-up but may be biased if baseline differences exist.
-
2. Residual change analysis (Table 5): Regression models were additionally adjusted for baseline SR-PA, allowing estimation of change in PA over time while controlling for initial activity levels.
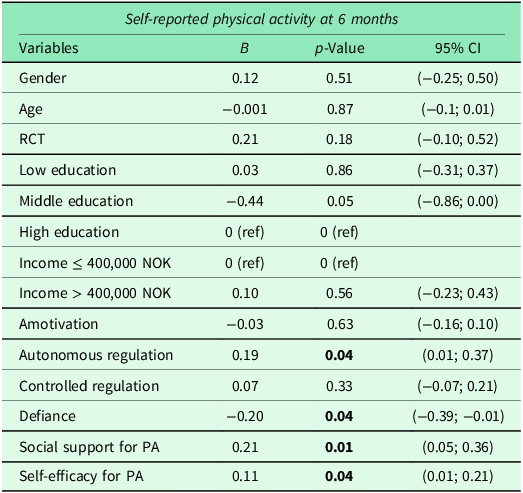
Associations between psychosocial and demographic predictors and SR-PA at 6-month follow-up (temporal causal model). Linear regression analyses were conducted to examine associations between each predictor SR-PA at follow-up, without adjusting for baseline SR-PA. All models were adjusted for age, gender, and RCT group. Results are presented as unstandardized regression coefficients (B), p-values, and 95% confidence intervals (CI)

Table 4. Long description
A table titled ‘Self-reported physical activity at 6 months’ with 13 rows and 4 columns. The columns are labeled ‘Variables’, ‘B’, ‘p-Value’, and ‘95% CI’. The table presents data on the associations between various predictors and self-reported physical activity at 6 months. Each row lists a different variable, including gender, age, RCT, education levels, income, amotivation, autonomous regulation, controlled regulation, defiance, social support for PA, and self-efficacy for PA. The ‘B’ column shows the unstandardized regression coefficients, the ‘p-Value’ column shows the p-values, and the ‘95% CI’ column shows the 95% confidence intervals. Notable trends include significant p-values for middle education, autonomous regulation, defiance, social support for PA, and self-efficacy for PA, indicating these variables have a notable association with self-reported physical activity at 6 months.
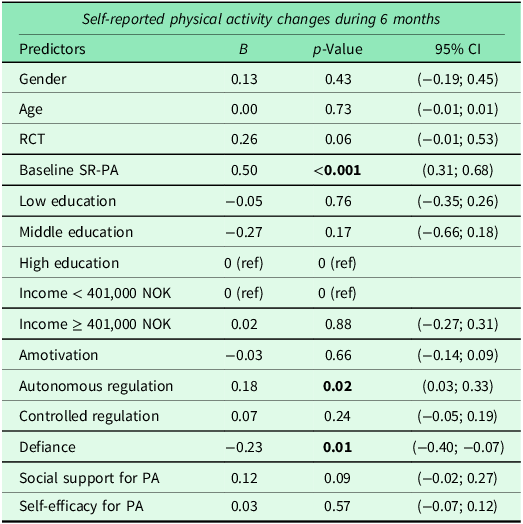
Associations between psychosocial and demographic predictors and change in SR-PA from baseline to 6-month follow-up (residual change model). Linear regression analyses were conducted to examine associations between each predictor and change in SR-PA from baseline to follow-up. All models were adjusted for age, gender, RCT group, and baseline SR-PA. Results are presented as unstandardized regression coefficients (B), p-values, and 95% confidence intervals (CI). Bold indicates p < 0.05

Table 5. Long description
A table titled ‘Self-reported physical activity changes during 6 months’ presents the results of linear regression analyses examining associations between various predictors and changes in self-reported physical activity (SR-PA) from baseline to 6-month follow-up. The table includes 14 rows and 4 columns. The columns are labeled ‘Predictors’, ‘B’, ‘p-Value’, and ‘95% CI’. The ‘Predictors’ column lists different variables such as gender, age, RCT, baseline SR-PA, education levels, income, amotivation, autonomous regulation, controlled regulation, defiance, social support for PA, and self-efficacy for PA. The ‘B’ column shows the unstandardized regression coefficients, the ‘p-Value’ column shows the p-values, and the ‘95% CI’ column shows the 95% confidence intervals. Notable values include a significant p-value of less than 0.001 for baseline SR-PA with a B value of 0.50 and a confidence interval of (0.31; 0.68). Autonomous regulation has a p-value of 0.02 with a B value of 0.18 and a confidence interval of (0.03; 0.33). Defiance shows a p-value of 0.01 with a B value of -0.23 and a confidence interval of (-0.40; -0.07). Other predictors such as gender, age, RCT, low education, middle education, high education, income, amotivation, controlled regulation, social support for PA, and self-efficacy for PA have varying p-values and confidence intervals, indicating their respective associations with changes in SR-PA.
Both approaches have strengths and limitations. Temporal causal models are useful for identifying predictors without conditioning on baseline, but residual confounding remains a concern. Residual change models better control for baseline activity and estimate within-person changes, though they may be sensitive to measurement error. Previous methodological work highlights the importance of adjusting for time-varying confounding and clearly stating model assumptions (Mansournia et al., Reference Mansournia, Naimi and Greenland2019; Simonsen et al., Reference Simonsen, Gjærde, Nielsen, Valentin, Waagepetersen, El-Galaly and Jakobsen2025).
Tables are referenced consistently, and results are presented with regression coefficients, CI, and effect size estimates to ensure transparency and interpretability.
Model assumptions were evaluated prior to regression analyses. Multicollinearity was examined using the Variance Inflation Factor, with all predictors showing values close to 1 (ranging from 1.0 to 1.1), indicating no issues with collinearity. Independence of residuals was examined with the Durbin–Watson statistic, which was close to 2 (≈2.1), indicating that the residuals were independent of each other. Inspection of residual and P–P plots further indicated that residuals were normally distributed and randomly dispersed.
Normality of the SR-PA variables was examined by skewness and kurtosis. For baseline and six-month follow-up SR-PA, skewness ranged from –0.04 to 0.10 and kurtosis from –0.69 to −0.61, all within acceptable thresholds (skewness < 2, kurtosis < 1). Group-specific analyses (intervention vs. control) confirmed similar values, with skewness ranging from –0.15 to 0.07 and kurtosis from –0.97 to –0.37. Motivational predictors (autonomous and controlled regulation, amotivation, social support, defiance, and self-efficacy) likewise showed values within acceptable limits. These results support the assumption of approximate normality and justify the use of linear regression.
Ethical approval
Prior to enrolment, all participants provided informed consent. The study was approved by the Regional Committee for Medical and Health Research Ethics (no. 2013/1291).
Results
Of the 118 participants included, 77% were women with a mean age of 48.5 years. Average SR-PA was 2.4 on a four-point scale across all groups. BMI values were similar, most participants (44%) had a high level of education, and 61% reported a gross family income above 400,000 NOK.
Psychosocial measures were likewise similar. Autonomous regulation was consistently high (mean 6.1), whereas amotivation and defiance were low (2.3 and 1.9, respectively). Social support for PA and self-efficacy for PA showed small differences but remained comparable between groups. Overall, the intervention and control groups were well matched on demographic and psychosocial characteristics, with only negligible differences (Table 1).
Tables 2 and 3 show the estimated effect of the intervention on SR-PA. At the 6-month follow-up, participants in the intervention group reported higher SR-PA (mean 2.6, SD 0.7) compared with the control group (mean 2.4, SD 0.7). In the adjusted regression model, the intervention was associated with increased SR-PA (B = 0.26, 95% CI −0.01 to 0.53), which corresponds to ≈0.37 SD, indicating a small-to-moderate standardized effect size. While the confidence interval included zero, the estimate remained compatible with a modest positive intervention effect. Baseline SR-PA was a strong predictor of follow-up levels (B = 0.49, 95% CI 0.31−0.68), underlining the importance of initial activity patterns when evaluating intervention effects.
Multiple linear regression analyses examined the associations between predictors and SR-PA at follow-up, adjusted for age, gender, and randomization group (Table 4). Autonomous regulation, social support for PA, and self-efficacy for PA were all positively associated with SR-PA, suggesting that higher internal motivation, greater confidence in engaging in PA, and external social support contribute to increased activity. In contrast, defiance was negatively associated with SR-PA, indicating that individuals resistant to external influence may be less likely to engage in PA. Participants with middle education reported lower SR-PA compared with those with higher education (B = −0.44, 95% CI −0.86−0.00), with the upper bound at zero indicating uncertainty.
In Table 5, the model was further adjusted for baseline SR-PA to assess change in PA rather than absolute levels. This adjustment resulted in several notable differences in effect sizes and significance.
After adjustment for baseline SR-PA, autonomous regulation remained positively associated with change in SR-PA (B = 0.18, 95% CI 0.03−0.33), while defiance remained negatively associated (B = −0.23, 95% CI −0.40 to −0.07). Social support and self-efficacy showed little evidence of association with change, as the 95% CI included zero. The intervention effect was estimated as B = 0.26 (95% CI −0.01 to 0.53); although the CI included zero, the estimate remained compatible with a modest increase in SR-PA. Estimates for education, income, age, gender, amotivation, and controlled regulation were close to null or had wide CIs spanning zero.
Sensitivity and reliability analyses
Sensitivity analyses showed moderate positive correlations between SR-PA and objectively measured MVPA by armband. At baseline, SR-PA correlated with MVPA (r = 0.43, p < 0.001, N = 116). At six-month follow-up, the correlation remained significant though slightly attenuated (r = 0.37, p < 0.001, N = 79).
The two SR-PA items (duration and intensity) demonstrated a Cronbach’s alpha of 0.47, indicating modest internal consistency. This suggests that the two items should not be interpreted as interchangeable indicators of a single construct. However, the items may capture related but partially distinct dimensions of physical activity behaviour, including duration and intensity. The corrected item–total correlation was 0.31, and moderate correlations with objectively measured MVPA support some degree of construct validity.
Discussion
This study examined changes in self-reported physical activity (SR-PA) following participation in a three-month behaviour change programme at Norwegian HLCs. Autonomous motivation, self-efficacy for PA, and social support were positively associated with SR-PA, while psychological defiance showed a negative association. Education level was also a potential predictor, with individuals in the middle education category reporting lower SR-PA compared with those with higher education. The intervention effect was not statistically significant (B = 0.26, 95% CI −0.01 to 0.53, ≈0.37 SD). The confidence interval included zero, and the finding should be interpreted with caution.
While the finding is inconclusive, even modest increases in PA may carry public health relevance, given that small improvements in activity levels are associated with reduced risk of non-communicable diseases (Yerrakalva et al., Reference Yerrakalva, Hajna, Suhrcke, Wijndaele, Westgate, Khaw, Wareham, Brage and Griffin2023; Ekelund et al., Reference Ekelund, Sanchez-Lastra, Dalene and Tarp2024).
Our findings contrast with those of Samdal et al. (Reference Samdal, Meland, Eide, Berntsen, Abildsnes, Stea and Mildestvedt2018), who reported no intervention effect on MVPA measured with accelerometers. This discrepancy likely reflects fundamental differences between measurement approaches. SR-PA captures perceived activity, which may be more sensitive to intervention-related changes in behaviour, while accelerometers reflect objective movement. Importantly, wearing an activity monitor may itself function as a behaviour change technique, potentially inflating PA levels in both groups and obscuring true intervention effects (Samdal et al., Reference Samdal, Eide, Barth, Williams, Meland and Abildsnes2017). SR-PA is not without limitations either. Studies show that self-report instruments tend to overestimate PA compared to accelerometer-based measurements, and validity varies by individual factors such as obesity and gender (Steene-Johannessen et al., Reference Steene-Johannessen, Anderssen, Van der Ploeg, Hendriksen, Donnelly, Brage and Ekelund2016; Davies et al., Reference Davies, Choo-Kang, Soepnel, Geffen, Mtintsilana, Africa, Bovet, Viswanathan, Bedu-Addo, Boateng, Apusiga, Dei, Forrester, Lambert, Sinyaka, Layden, Gilbert, Ecklu-Mensah, Joyce and Luke2024; Arumugam et al., Reference Arumugam, Alsaafin, Shalash, Qadah, Al-Sharman, Moustafa, Shousha, Kumaran, Migliorini and Maffulli2024). Despite this, SR-PA has shown reasonable validity against objective biological markers of cardiovascular health (Holen et al., Reference Holen, Rønnaug, Mildestvedt, Eide and Meland2012), and in our study demonstrated construct validity through expected associations with motivational factors.
Compared to a study focusing on Chinese adolescents (Yiming et al., Reference Yiming, Shi, Alghamdi, Kayani and Biasutti2023), our findings similarly demonstrated that both social support and self-efficacy play crucial roles in promoting PA. While their study highlighted these factors as key mediators in adolescent activity levels, our results extend this insight to an adult population, showing strong associations between social support, self-efficacy, and increased SR-PA. These findings suggest that interventions targeting self-efficacy and social support may be effective across different age groups and settings.
An important aspect that emerged was the interplay between autonomy and defiance. A recent systematic review found that competence, intrinsic regulation, and identified regulation, which are key constructs of Self-Determination Theory, positively influence PA across different age groups (Xu et al., Reference Xu, Shamsulariffin, Azhar and Xi2025). This aligns with earlier SDT-based research demonstrating that autonomy fosters sustained behaviour change, whereas perceived external control can provoke defiance and undermine adherence (Van Petegem et al., Reference Van Petegem, Vansteenkiste, Soenens, Beyers and Aelterman2015; De Meyer et al., (Reference De Meyer, Soenens, Vansteenkiste, Aelterman, Van Petegem and Haerens2015). In our study, participants who approached the intervention with a sense of autonomy appeared to derive greater benefit, whereas those showing signs of defiance experienced lower PA levels during and after the 6-month observation period.
This highlights the importance of how interventions like HLCs are communicated and delivered. Interventions that support participants’ sense of ownership and autonomous decision-making, rather than imposing external pressure, may enhance long-term adherence and effectiveness. Ahmadi et al. (Reference Ahmadi, Noetel, Parker, Ryan, Ntoumanis, Reeve, Beauchamp, Dicke, Yeung, Ahmadi, Bartholomew, Chiu T.K., Curran, Erturan, Flunger, Frederick, Froiland, González-Cutre, Haerens, Jeno, Koka, Krijgsman, Langdon, White, Litalien, Lubans, Mahoney, Nalipay M.J., Patall, Perlman, Quested, Schneider, Standage, Stroet, Tessier, Thogersen-Ntoumani, Tilga, Vasconcellos and Lonsdale2023) developed a classification of SDT-based motivational behaviours, identifying specific actions that support autonomy, competence and relatedness, as well as behaviours that should be avoided. This framework may offer practical guidance for how HLC counsellors structure their interactions with participants.
The two SR-PA items (duration and intensity) demonstrated a Cronbach’s alpha of 0.47, indicating modest internal consistency, as discussed by Tavakol and Dennick (Reference Tavakol and Dennick2011). This suggests that the two items should not be interpreted as interchangeable indicators of a single construct. However, the items may capture related but partially distinct dimensions of physical activity behaviour, including duration and intensity. The corrected item–total correlation was 0.31, and moderate correlations with objectively measured MVPA support some degree of construct validity. In contrast, Samdal et al. (Reference Samdal, Meland, Eide, Berntsen, Abildsnes, Stea and Mildestvedt2018) reported that motivational factors did not predict objectively measured MVPA, highlighting possible differences between self-reported and device-based assessments.
The intervention was delivered across several HLCs with some variation in implementation, staffing, and available resources. Although this reflects real-world primary care practice and strengthens ecological validity, it may also have introduced heterogeneity in intervention exposure and reduced the ability to detect consistent effects across sites.
Beyond measurement considerations, participant attrition represents another limitation. The study experienced a dropout rate of approximately 30%. Participants with mental health challenges, musculoskeletal issues, or chronic somatic diseases were more likely to leave the study. This may be due to these groups facing greater challenges in adhering to the intervention. However, the study administration did not receive permission from Regional Committee of Ethics to ask the participants why they left the study.
This level of attrition may have introduced selection bias, as participants who remained in the study were likely more motivated and healthier at baseline, which could limit the generalizability of our findings to broader HLC populations. Complete-case analyses may also have introduced bias if participants lost to follow-up differed systematically from participants who completed the study. However, attrition rates were similar in both groups, which may have reduced the risk of differential attrition bias between intervention and control participants.
Conclusion
Participation in the Healthy Life Centre programme was associated with a small increase in SR-PA at six months. While the effect estimate was imprecise (B = 0.26, 95% CI −0.01 to 0.53), corresponding to ≈0.37 SD, the estimated effect size was compatible with a modest increase in SR-PA. Autonomous motivation was positively associated and defiance negatively associated with activity. These findings underline the importance of motivational and psychosocial factors in sustaining behaviour change. Although the intervention effect was modest, even small improvements in PA may have meaningful public health benefits.
Data availability statement
The data supporting the findings of this study are not publicly available due to ethical restrictions. De-identified participant data may be made available upon reasonable request to the corresponding author.
Acknowledgements
All authors meet the criteria for authorship as defined by the ICMJE, and all have approved the final version of the manuscript. The authors thank the Healthy Life Centres and patient organizations for their valuable collaboration in carrying out this study. The authors used OpenAI’s ChatGPT (versions 2023–2025) for language refinement only. All analyses, interpretations, and conclusions remain the sole responsibility of the authors.
Author contributions
Conceptualization: Eivind Meland, Thomas Mildestvedt. Data curation: Martin Svege Iglebæk, Jardar Espeland. Formal analysis: Martin Svege Iglebæk, Jardar Espeland. Methodology: Eivind Meland, Thomas Mildestvedt. Project administration: Thomas Mildestvedt, Eivind Meland. Supervision: Eivind Meland, Thomas Mildestvedt. Validation: Eivind Meland, Thomas Mildestvedt. Visualization: Martin Svege Iglebæk, Jardar Espeland. Writing – original draft: Martin Svege Iglebæk, Jardar Espeland. Writing – review & editing: Eivind Meland, Thomas Mildestvedt. Note: The original data collection and funding were part of the Norwegian Healthy Life Study (Abildsnes et al., Reference Abildsnes, Meland, Mildestvedt, Stea, Berntsen and Samdal2017, Research Council of Norway grant no. 228454). The present authors conducted a secondary analysis and did not participate in the collection of primary data or acquisition of funding.
Funding statement
This work was supported by the Research Council of Norway (grant no. 228454).
Competing interests
The author(s) declare none.
Ethical standards
This research was conducted in accordance with national and institutional ethical regulations for studies involving human participants and with the principles of the Declaration of Helsinki (1975, revised 2008).




 Open access

