I. INTRODUCTION
The cement hydration model CEMHYD3D,Reference Bentz1, Reference Bentz2 developed at the National Institute of Standards and Technology (NIST), was the first 3D microstructure model of its kind for simulating cement paste hydration. For more than 10 y it has remained as one of the leading simulation tools for predicting cement paste hydration and property development. Using a digital image model of 3D microstructure, it enables calculation of a wide range of other cement paste properties such as elastic moduli,Reference Haecker, Garboczi, Bullard, Bohn, Sun, Shah and Voigt3 effective DC conductivity,Reference Bentz, Jensen, Coats and Glasser4 and AC impedance response.Reference Torrents, Mason and Garboczi5
In spite of these successes, the empirical rules lying at the heart of CEMHYD3D cause a number of inherent limitations. First, little information about the kinetics of microstructural change can be determined from the model because the rules by which it changes the microstructure have no intrinsic time scale. In fact, the only way to attach a time scale to the microstructural changes is by calibrating to experimental measurements of the time dependence of the nonevaporable water, chemical shrinkage, or heat release. Second, there is little thermodynamic information in CEMHYD3D that can be used to predict the stable hydration products or how the stability is affected by the temperature or composition of the pore water. These two limitations provide a motivation for finding an alternative way to simulate cement paste hydration and microstructure development that has a stronger foundation in thermodynamics and kinetics. This paper presents a new simulation method that relies on equilibrium thermodynamic considerations, an accurate empirical model of clinker dissolution kinetics, and a lattice-based 3D model of microstructure.
The hydration of cement paste is an inherently nonequilibrium process. When mixed with water, the thermodynamic driving force for dissolution of clinker phases is large, on the order of 1 kJ per mol of alite, and several tens of kJ per mol of C3A.Reference Bentz1 Portland cement paste can release about 100 J of heat per gram of solid within the first several minutes after mixing. Moreover, at least one of the important solid products of hydration, C–S–H gel, precipitates with no long-range crystalline order and therefore cannot be in its lowest free energy state. Therefore, one might expect equilibrium thermodynamic considerations to have little relevance to the course of cement paste hydration and microstructure development.
However, within several hours after setting, the rate of hydration reaches a maximum, begins to decrease, and continues to decrease considerably with time. In addition, most of the solid products of hydration that exist in mature cement paste have nucleated and are present in significant quantities by the time the maximum rate has occurred. At later times, the dissolution rates of initial cement phases decrease significantly because less surface area for dissolution remains and because that surface can be partially covered with hydration products, such as C–S–H gel. The hydration products, however, remain in intimate contact with the pore solution and their surface areas continue to increase. Therefore, one may be able to assume at later ages that the assemblage of hydration products is approaching equilibrium with the pore solution. This assumption is supported by experimental observationsReference Jennings6, Reference Brown and Skalny7 that the chemical composition of the solution changes slowly with time and is consistent with the known solubilities of the hydration products. Under the Brown assumption,Reference Brown and Skalny7 continued microstructure development is viewed as a sequence of quasi-static changes from one microstructure state to another as the slow dissolution of the unhydrated cement phases causes infinitesimal perturbations to the pore solution composition.
By assuming near equilibrium conditions between the hydration products and the pore solution, we are essentially assuming that the solution and hydration products together form a subsystem that has a fixed elemental composition at any instant of time, this composition being determined by the extent of dissolution of each of the clinker phases. This implies that the Gibbs free energy is the governing thermodynamic potential, and its minimization leads to predictions of the equilibrium mass fraction and composition of each hydrated product phase, as well as the composition and speciation of the pore solution. The power of this approach depends on having a fairly comprehensive database of thermodynamic properties of each of the condensed phases and solute species that can possibly be present. These properties include the Gibbs free energy of formation, molecular mass, density, and temperature-dependent heat capacity.
Although this approach is primarily thermodynamic, it still requires some kind of kinetic model to predict the dissolved mass of initial cement phases as a function of time. The rate of dissolution of cement phases, even at later times, should depend on temperature and on microstructural characteristics such as the specific surface area of each cement phase and the water-to-cement mass ratio (w/c). Lothenbach and colleagues have used an empirical kinetic model of clinker phase dissolutionReference Parrot and Killoh8 for this purpose, coupling it to a Gibbs free energy minimization program called GEMSReference Kulik9 to model the time dependence of the phase assemblage and pore solution composition in portland cement pastes.Reference Lothenbach and Winnefeld10, Reference Lothenbach and Wieland11 They reported both pore solution speciation and mass fractions of each phase as a function of time out to 1.1 y of hydration for ordinary portland cement (OPC) pastes with or without limestone additions at 20 °C. They used the same modeling tools to simulate the influence of curing temperatureReference Lothenbach, Matschei, Möschner and Glasser12 and limestone additionsReference Lothenbach, Le Saout, Gallucci and Scrivener13 on the hydration kinetics and porosity of pastes of OPC, sulfate-resistant portland cement (SRPC), and Portland-limestone cement (PLC). Guillon, Chen, and ChanvillardReference Guillon, Chen, Chanvillard, Schlangen and De Schutter14 used a different thermodynamic databaseReference Guillon15 with the thermodynamic speciation software PHREEQCReference Parkhurst and Appelo16 and coupled it to a kinetic model of OPC hydration by TomosawaReference Tomosawa and Justnes17 to predict the rate of cement hydration and time dependence of the mass fractions of hydrated phases in an OPC.
One aspect that is not present in these recent thermodynamic approaches is a model of the spatial distribution of phases, that is, the microstructure, as a function of time. The microstructural state of cement paste is specified by the volume, location, and orientation in space of each domain of the different phases that are present. Therefore, because the free energy of a phase is translationally and rotationally invariant, microstructure is not a thermodynamic property. Even if the excess free energy of the various kinds of interphase boundaries were taken into account, minimization of free energy would only require a definite area of each type of interface without regard to its location in space.Reference Adamson and Gast18 In all of the thermodynamic hydration approaches just cited, global microstructure characteristics of the initial cement paste are accounted for through the particle fineness and w/c, but only as input to the kinetic model of clinker phase dissolution.Reference Parrot and Killoh8, Reference Tomosawa and Justnes17 Nevertheless, important properties of concrete, such as its elastic modulus and its permeability to liquids or gases, depend on various details of the cement paste microstructure.Reference Haecker, Garboczi, Bullard, Bohn, Sun, Shah and Voigt3, Reference Bentz, Jensen, Coats and Glasser4, Reference Promentilla, Sugiyama, Hitomi and Takeda19, Reference Schwartz, Auzerais, Dunsmuir, Martys, Bentz and Torquato20 Therefore, attempts to predict the durability and service life of cement-based materials should ideally capture the changes in cement paste microstructure.
In this paper, we describe an extension of the thermodynamic approach by coupling its predictions to a new lattice-based model of 3D microstructure development. The combined thermodynamic/microstructural model is applied to simulate the hydration of two OPCs, and the model predictions are compared to experimental measurements of the phase assemblage, porosity, compressive strength, and heat release. In addition, quantitative comparisons are made between the simulated microstructures and microstructures observed using scanning electron micrographs of polished sections of the hydrated cement pastes at different ages.
II. MATERIALS AND METHODS
Modeling results are compared to experimental measurements made on pastes of two different OPCs. The Cement and Concrete Reference Laboratory (CCRL) biannually issues pairs of proficiency samples of portland cement to be evaluated by hundreds of testing laboratories using ASTM standard test methods.21 Many of the chemical characteristics and performance properties of these cements are therefore extremely well documented. Two of these cements were chosen for this study, hereafter designated as CCRL 15122 and CCRL 168.23
A. Particle size distribution
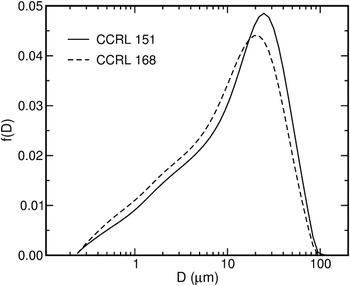
The particle size distributions (PSDs) of both cements were determined using laser diffraction from a dilute suspension of particles in isopropyl alcohol. Six independent measurements were made for each cement, and the averages of these measurements are shown in Fig. 1 as probability density functions. CCRL 168 is modestly finer than CCRL 151. The median effective diameter of CCRL 168 is 11 μm compared with 13 μm for CCRL 151. The specific surface areas of the cement powders reported for CCRL 151 and CCRL 168 are 379 m2/kg ± 13 m2/kg and 408 m2/kg ± 10 m2/kg, respectively, as measured according to a standardized air permeability test (ASTM C 20421) in the CCRL testing program.22, 23
Particle size distributions, plotted as probability density functions, measured for cements CCRL 151 and CCRL 168 using laser diffraction from a dilute suspension of particles in isopropyl alcohol.

B. Quantitative phase analysis and image processing
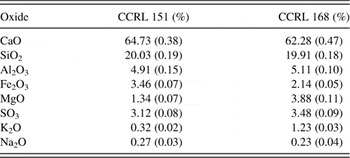
Quantitative x-ray powder diffraction (QXRD) by Rietveld refinement was performed on both cement powders, using an internal standard of 11% corundum (Al2O3) by mass. Table I gives the mass percent of the major oxide components in each cement, from which it can be seen that the major differences between the two cements are in the mass fractions of MgO and K2O, CCRL 168 being higher in both and slightly lower in CaO.
Major oxide components for CCRL 151 and CCRL 168 as measured by approximately 250 laboratories, reported as mass%. Values in parentheses represent 1 standard deviation in the reported measurements.

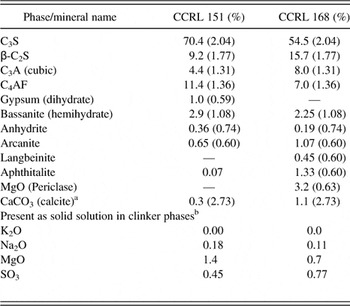
Table II shows the results of the QXRD analysis for each cement, and indicates a greater difference in the normative phase compositions of the cements than might be expected from the oxide analyses in Table I. CCRL 151 has significantly more C3S and C4AF, and less C2S and C3A, than CCRL 168. CCRL 168 also contains a small amount of periclase which is absent in CCRL 151.
Phase composition, in mass% of major phases in CCRL 151 and CCRL 168, based on Rietveld refinement of x-ray powder diffraction patterns using 11% corundum by mass as an internal standard. Numbers in parentheses indicate within-laboratory 95% confidence radius.Reference Stutzman and Leigh29

a Calculated based on TGA measurements of the mass of CO2.
b Based on total oxide measurements and mass fractions of K2SO4 and Na2SO4 determined by QXRD.
The preparation techniques for specimens analyzed by scanning electron microscopy (SEM) and x-ray microanalysis have been described in detail elsewhere,Reference Stutzman, Clifton, Jany and Nisperos24, Reference Stutzman and Sutter25 so only a brief description will be given here. For analyzing the unhydrated cement powders, polished specimens were made by mixing the powder in an epoxy resin, curing the resin, and cutting to obtain a plane surface. Grinding and polishing were performed down to a 0.25 μm diamond paste, and the specimens were coated with carbon to provide a conductive surface.
Both backscattered electron (BE) and x-ray (XR) element images were collected simultaneously by SEM, using a typical accelerating voltage and current of 10 kV and 2 nA, respectively. XR maps were collected for Ca, Si, Al, Fe, S, K, Na, and Mg. Phase segmentation was based primarily on the BE images by correlating the local brightness levels to the phase average atomic number. The XR maps were used to facilitate distinction between phases with similar brightness levels, and to identify phases that are not easily detected in the BE images, such as periclase and alkali sulfates.Reference Stutzman and Sutter25
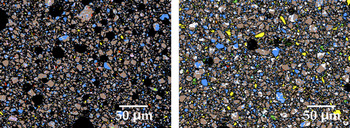
Image segmentation was accomplished by multi-spectral processing as described in Guillon’s thesis.Reference Stutzman and Sutter25 Noise reduction of the raw images was accomplished by median filtering and clipping, if necessary. The BE and XR images for a given image field are read into a hyperspectral data processing application.Reference Landgrebe and Biehl26 Small portions of the image are used to establish training sets for phase identification, and a classifier, such as the Minimum Euclidean Distance or the Fischer Linear Likelihood classifiersReference Landgrebe27 is used to group like pixels. Processed images of CCRL 151 and CCRL 168 are shown in Fig. 2.
Final processed images of CCRL 151 (left) and CCRL 168 (right) with segmented phases.

C. Stereological analysis
Quantitative image analysis was performed on images of initial cement powders and of hydrated cement pastes for modeling and comparing microstructures. For the initial powders, segmented images like those in Fig. 2 were analyzed quantitatively to determine properties of interest for creating representative starting 3D microstructures for modeling. Properties of interest, including the area fraction, surface perimeter fraction, and spatial distribution of each clinker phase, were measured. The spatial distribution of phases was quantified by calculating various two-point correlation functions on the images, as described fully in Bentz et al.Reference Bentz, Stutzman, Haecker, Remond, Pietersen, Larbia and Janssen28 Briefly, on an M × N digital image field, the two-point correlation function, Sp(x, y), for a phase or collection of phases designated by p is given by

where Ip(x, y) = 1 if the pixel at location (x,y) contains the phase or phases designated by p, and Ip(x, y) = 0 otherwise. Assuming that the microstructure is isotropic, Sp(x, y) is transformed to a function of distance only, Sp(r), where  . Correlation functions for isotropic materials are identical in 2D and 3D, so correlation functions calculated on the final images like those in Fig. 2 can be used directly to reconstruct 3D microstructures with the same statistical spatial distribution of phases.
D. Tracking hydration and microstructure development
Pastes of CCRL 151 and CCRL 168 were made by mixing the powder in 18 MΩ deionized water. The water-to-solids mass ratio was 0.45, corresponding to a water-to-cement mass ratio w/c = 0.51 once the internal standard is subtracted from the solid mass.
QXRD was performed at regular time intervals during hydration to track the rate of consumption of clinker phases and the rate of production of certain hydration products. Initial data and 24 h data were collected from a sealed specimen holder to retain moisture and exclude CO2. At later ages, disks were cut from a cast cylinder of the paste using a low-speed diamond saw, and the cut disk surfaces were carefully lapped on a 1200-grit abrasive paper to minimize surface roughness.
While the analysis of unhydrated cement powders by QXRD is challenging, the use of QXRD to monitor phase development in a hydrating cement paste introduces the additional complexity of an amorphous component to the x-ray pattern, both from the water and from poorly ordered hydration products such as C-S-H gel. Nevertheless, Rietveld refinement of x-ray diffraction patterns on hydrating cement pastes has been established in the literature over the past 50 y.Reference Copeland and Bragg30–Reference Scrivener, Füllman, Gallucci, Walenta and Bermejo32 In fact, the empirical kinetic model of Parrott and Killoh that is adopted in this paper used QXRD to establish values of the degree of hydration coefficients for each of the clinker phases.Reference Parrot and Killoh8 The analysis of hydrated cement utilizes diffraction traces from crystal structure models of each phase in the material system, from which the x-ray diffraction pattern can be calculated for any given set of volume fractions of those phases. If all the phases in the cement paste were well ordered crystals, then the volume fractions of the various phases could be inferred by calculating theoretical diffraction patterns and adjusting the volume fractions of the various phases until the calculated pattern matched the experimentally measured one. When unknown quantities of amorphous phases are present, however, a known amount of a well-characterized internal standard (corundum, NIST SRM 676 in this study) is required to provide a baseline signal for calibrating the signal intensities to volume fractions.
Most of the crystal structure models used in this study were taken from published data.Reference Moore and Taylor33–Reference Taylor36 In general, the refinement proceeded in steps where diffraction patterns of selective extractions of the cements were refined and the structural and peak shape profile parameters were established. These parameters were subsequently fixed to avoid correlation problems in the more complex mixtures. The procedure used for C–S–H gel was somewhat different and deserves some comment here. C–S–H in cement pastes is typically poorly ordered, or may actually change from amorphous to poorly ordered with time. The contribution of C–S–H to the diffraction pattern can be inferred from measurements on C3S pastes, for which C–S–H is the only solid present other than the well-ordered crystalline phases C3S and CH. From these kinds of experiments, it is observed that C–S–H exhibits a diffuse peak at 0.304 nm (hereafter called the “ordered” C–S–H peak) amid a broad amorphous hump in the background. Although a number of structure models for C–S–H analogs have been published,Reference Cong and Kirkpatrick37–Reference Bonaccorsi, Merlino and Kampf39 we have not been able to find one that readily fits the ordered C–S–H peak and the broad background. Therefore, rather than using what is most likely an improper structure model, we elected to include the contribution of C–S–H in the amorphous category along with water and other amorphous components that may be present. This decision still requires us to account for the ordered C–S–H peak, or else the intensity scale factors for the other phases would be adversely affected. The most satisfying solution was to use a disordered calcite structure model with a fine particle size to account for the peak broadening. Potential sources of bias in this approach stem from the possibility of an incomplete accounting of all phases, possible errors associated with the hydration product models, and the use of the broadened calcite model to account for the diffraction peak of the ordered C–S–H. These potential sources of bias are a subject of ongoing research.
SEM imaging uses backscattered electron and x-ray imaging to establish the spatial distribution of the constituent phases and is limited by the interaction volume, roughly on the order of 500 nm. This precludes discrete imaging of the fine needles of ettringite, but does provide insight into the phase identification of the more poorly-ordered constituents. For example, monosulfoaluminate is readily observed at later ages in cement pastes in the BE image where it exhibits a gray level similar to that of C–S–H, a more uniform texture, and a platy morphology. X-ray microanalysis of monosulfate also indicates the presence of aluminum, sulfur, and calcium. In this way, these characterization methods complement each other and the consensus estimates are most likely stronger estimates than either analysis individually.
III. MODELING APPROACH
A. Thermodynamic calculations
The thermodynamic component of the model is identical to that described elsewhere by Lothenbach et al.Reference Lothenbach, Matschei, Möschner and Glasser12 The change in mass of each of the four major clinker phases over a small time interval disturbs the equilibrium between the pore solution and the hydrated phase assemblage by introducing Ca, Si, Al, Fe, and hydroxide into the pore solution. Equilibrium is reestablished at the end of that time interval by changes in the mass of each hydrated phase. The mass change of the clinker phases during each time interval is estimated by the empirical model of Parrot and Killoh.Reference Parrot and Killoh8 The compositions of the solid and liquid phases as a function of time and temperature are calculated based on:
(i) the composition of the cement powder (Table II),
(ii) the calculated degree of the dissolution of the clinker minerals (see description of kinetic model below), and
(iii) thermodynamic calculations using a self-consistent thermodynamic database.
Thermodynamic modeling was performed using the Gibbs free energy minimization program GEMS.Reference Kulik9 Chemical interactions involving solids, solid solutions, and aqueous electrolytes are considered simultaneously, including the speciation of dissolved species. The mass and, in the case of solid solutions, composition of each solid hydrate are computed as a function of time. The ultimate destination of dissolved alkali components is modeled using a distribution ratio R d of 0.42 mL/g for uptake of both Na and K in C–S–H gel.Reference Lothenbach and Winnefeld10 Thermodynamic data for aqueous species and some solids were taken from the PSI-GEMS thermodynamic database,Reference Hummel, Berner, Curti, Pearson and Thoenen40 and solubility products for cement minerals were taken from compilations given in Lothenbach et al.Reference Lothenbach, Matschei, Möschner and Glasser12 and Matschei et al.Reference Matschei, Lothenbach and Glasser41 Minimization of Gibbs free energy enables one to consider solid solution composition to be a function of liquid solution composition. The composition of C–S–H is assumed to follow the solid solution model originally developed by Kulik and Kersten,Reference Kulik and Kersten42 while the ideal solid solution between Al and Fe is assumed for the ettringite, monocarbonate, monosulfate, hemicarbonate, and hydrotalcite phases.
B. Reaction rates of cement clinker phases
Dissolution of cement clinker provides the species required to form the solid hydrates. The kinetic model of Parrot and KillohReference Parrot and Killoh8 describes the rate of dissolution of the four major clinker phases, C3S, C2S, C3A, and C4AF, by a set of empirical equations that attempt to describe the alternate rate-controlling mechanisms of hydration, including nucleation and growth of hydrated phases, and diffusion of solute. The rate of dissolution at any time by each of these mechanisms is assumed to depend on the instantaneous degree of hydration, w/c, and six empirical parameters for each phase. The empirical equations and values of the empirical parameters used in this study are given in Lothenbach et al.Reference Lothenbach, Le Saout, Gallucci and Scrivener13 and will not be reproduced here.
C. Microstructure modeling
Microstructure is modeled as a 3D digital image, in which each voxel in a 100 × 100 × 100 array represents a volume of 1 μmReference Haecker, Garboczi, Bullard, Bohn, Sun, Shah and Voigt3 that is occupied by a single phase. The possible phases are each assigned positive integer identification numbers, hereafter called phase ids. The initial, unhydrated cement paste microstructure is created using the Virtual Cement and Concrete Testing Laboratory software.Reference Bullard and Stutzman43 First, digitized representations of cement particles are randomly parked in the digital image without overlap,Reference Bentz1, Reference Bentz2 each particle volume Vi being drawn from the measured PSD by assuming the PSD represents the distribution of “equivalent spherical diameters,” that is, the diameter of a sphere with volume Vi. Particles are placed in descending order of volume. The shape of each particle is created using a truncated spherical harmonic (SH) series. The SH coefficients of thousands of individual particles of CCRL 151 have been measured by x-ray microtomography and stored for each particle in a database, and these particle database files are sampled at random from the database and given a 3D orientation by assigning random values for the three Euler angles when creating the microstructure. The procedure is described in more detail in Bullard and StutzmanReference Bullard and Stutzman43 and in Garboczi and Bullard.Reference Garboczi and Bullard44, Reference Bullard and Garboczi45 Particle shapes for CCRL 151 were used for both cements in this study because shapes for CCRL 168 have not yet been experimentally characterized, but there is no reason to think that they are not similar to those of CCRL 151. Reconstruction of the clinker phase volume fractions, surface area fractions, and spatial distribution in 3D was performed after the generic particles were placed, using procedures and algorithms described elsewhere in detail.Reference Bentz1, Reference Bentz2
Once the initial microstructure for a cement paste is created, the 3D array is scanned once to identify the different interfaces between each of the solid phases and the solution. For each solid phase m, two lists are created. One of these is a “dissolution site” list {D}m which is the set of all the voxels of phase m that are capable of dissolving because at least one nearest neighbor is occupied by solution. The other list is a “growth site” list {G}m which is the set of all solution voxels at which phase m can potentially grow because at least one nearest neighbor is also occupied by phase m.
After {D}m and {G}m are generated for each solid phase m, the members of the lists are evaluated for their potential to dissolve or grow, respectively. In order to evaluate these potentials, we assign “affinities” between solid phases, representing the relative tendency for the phases to grow in contact. A negative affinity between two solids means that they will tend to minimize their contact with each other; a positive affinity means they will tend to increase their contact with each other; and a zero affinity means that the phases will not be biased one way or the other. In order to encourage different kinds of growth morphologies, we enable a phase to have a positive, negative, or zero affinity for itself. For example, if a phase has a positive affinity for itself, growth of the phase will tend to occur at solution sites with greater numbers of itself as neighbors; a positive affinity will therefore tend to produce equiaxed and rounded shapes. On the other hand, if a phase has a negative affinity for itself, growth of the phase will tend to occur at solution sites with fewer numbers of itself as neighbors; this will tend to produce shapes with high aspect ratio and sharp corners. In the model, affinities are dimensionless integer values.
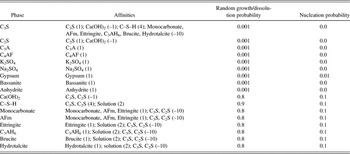
Table III gives the affinities used in these simulations. We emphasize that the concept of affinity as introduced here does not yet have any well-defined physical significance in terms of crystal growth theory, but instead is introduced as a mere convenience to generate different growth morphologies. However, in the future, it may be possible to establish a stronger link between the affinities and physical parameters such as interfacial energy and growth mobility of interfaces as a function of orientation.
Interphase affinities, random growth probabilities, and nucleation probabilities assumed in the simulations. In the Affinities column, a number in parentheses next to a phase is the affinity for that phase. Only nonzero values are listed.Footnote a

a Where it is convenient and not likely to cause confusion, conventional cement chemistry notation is used, that is, C = CaO, S = SiO2, A = Al2O3, F = Fe2O3,  , and H = H2O.
At the beginning of a simulation, the thermodynamic calculations are made as described in the previous section. The result of these calculations is a master table of the time dependence of the phase mass fractions, the first column storing the time in hours, and each of the other columns storing the volume fractions of a given phase. Thus the ith row of the jth column contains the volume fraction of phase j – 1 in the microstructure at time ti.
For the first time step, the first row of the master table is read. By comparing the target volume fractions in the table to the current volume fractions in the microstructure, a determination is made of the net number of voxels, Nm of each phase m that must be added to, or removed from, the microstructure. The phase ids of a certain subset of the voxels in the microstructure are therefore changed to simulate microstructure development during that first time interval. In order to accomplish this, {D}m and {G}m are sorted in ascending and descending order, respectively, of their affinities for phase m. Then, for dissolution (or growth) of Nm voxels of phase m, the first Nm voxels in {D}m (or {G}m) are switched to solution (or phase id m). We have observed that more realistic-looking microstructures are obtained if some randomness is imposed on the ordering of {G}m. Therefore, we make random pairwise swaps of the ordering of {G}m until a prescribed fraction of the growth sites, shown in Table III as the random growth/dissolution probability, have been affected. If a solid phase m must grow but {G}m is empty, the phase is nucleated at randomly selected (x,y,z) locations where the nucleating phase is adjacent to a phase with which it has a high affinity in Table III. Even if {G}m is not empty, a finite nucleation probability is defined for each growing phase, as shown in the last column in Table III. The value of the nucleation probability is the probability that any given voxel of a phase that needs to grow will precipitate as a new embryo instead of attaching to an existing surface of that phase. For these simulations, the nucleation probability of any particular phase is assumed to be a fixed value, although one expects it to be a function of the nucleation energy barrier and driving force for nucleation according to classical nucleation theory.Reference Kaschiev and van Rosmalen46 The values in Table III were chosen to make the spatial distribution of hydrated phases in the simulated microstructures have statistical properties similar to the experimentally observed ones, as described in the Results section.
Changing the phase ids of voxels in the microstructure will inevitably change the membership in the {D} and {G} lists. Sites formerly belonging to {G}m must be removed from {G}m if growth occurred there. Similarly, sites formerly belonging to {G}m must be removed from {G}m if they have been isolated from the solution by overgrowth of m or another solid phase. Therefore, after updating the phase ids of the affected voxels, {D} and {G} for each phase are updated and re-sorted. When updating {D}, voxels containing a C–S–H phase are counted as also containing water in their gel porosity. Thus, for example, a C3S voxel with C–S–H nearest neighbors is counted as a dissolution site for C3S. Other than that, the criteria for membership in {D} and {G} and the sorting procedures are the same as described previously.
IV. RESULTS
A. Bulk phases
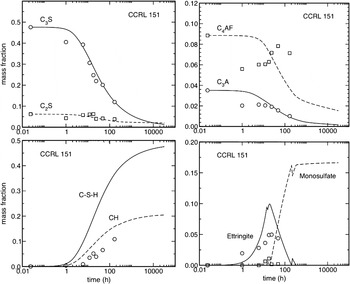
Figure 3 compares, for the CCRL 151 paste with w/c = 0.45, the measured and predicted time dependences of the masses of the four major clinker phases and of four of the major hydrated phases, C–S–H gel, CH, ettringite, and monosulfate, for sealed curing conditions at 23 °C. The reported values are mass fractions, normalized to the total system mass (solid plus solution). With the exception of C4AF, the kinetic model gives a reasonably good fit to the consumption of the clinker phases. In addition, the model somewhat overestimates the mass fraction of CH and ettringite, and significantly overestimates the mass fraction of monosulfate after 72 h. Based on the unusual trends in the experimental measurements of the amount of C4AF, which is known to be a very slowly dissolving component of cement clinker, it is difficult to determine how better agreements between the experimental data and the model calculations can be obtained at this point.
Mass fractions of the four major clinker phases, C–S–H gel, CH, ettringite, and monosulfate as a function of time in CCRL 151 paste (w/c = 0.45) hydrated at 23 °C under sealed conditions. Continuous and dashed curves are model predictions. Open symbols are experimental measurements made by QXRD. QXRD measurements of C–S–H gel are not available. Uncertainties in the experimental data, estimated as one standard deviation of 10 analyses, are: CH = 0.02 to 0.03, AFt = 0.02 to 0.06, C3S = 0.01 to 0.03, C2S = 0.006 to 0.02, C3A = 0.01, C4AF = 0.015.

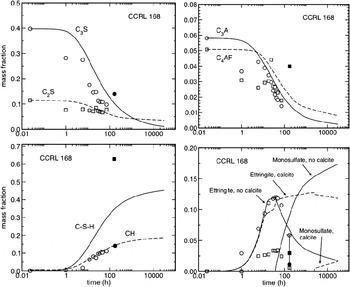
Figure 4 shows the same phase information for CCRL 168 that Fig. 3 shows for CCRL 151. For CCRL 168, mass fraction estimates for several phases at 7 days hydration were also made by SEM analysis on two different image fields, and these measurements are shown in Fig. 4 as closed symbols. Again, the kinetic model exhibits reasonable agreement with the measured consumption of the four major clinker phases, although in general it appears to somewhat overestimate the amount of each phase remaining at any given time. The model predicts the mass fraction of CH better for CCRL 168 than it does for CCRL 151. The greatest discrepancies occur for ettringite and monosulfate. If one accounts for the 1.1% calcite present in the cement (see Table II), the ettringite phase remains remarkably stable at later ages because of the presence of the monocarbonate phase which forms preferentially to monosulfate. This is represented by the dashed lines in Fig. 4 for ettringite and monosulfate. However, although the experimental data indicate little monosulfate forming at later ages, those data also indicate that some monosulfate forms at earlier times before the sulfate sources are consumed at about 90 h. Reductions in both the monosulfate and the ettringite mass fractions are observed after about 90 h, but the dashed line for ettringite indicates that very little reduction is expected.
Mass fractions of the four major clinker phases, C–S–H gel, CH, ettringite, and monosulfate as a function of time in CCRL 168 paste (w/c = 0.45) hydrated at 23 °C under sealed conditions. Continuous and dashed curves are model predictions. Open symbols are experimental measurements made by QXRD, and closed symbols are estimates from quantitative SEM at 7 days hydration. QXRD measurements of C–S–H are not available. The solid and dashed lines for ettringite and monosulfate correspond to calculations with calcite excluded and included in the cement, respectively. Uncertainties in the QXRD data are the same as in Fig. 3, and uncertainties in microscopy estimates, expressed as ±1 standard deviation in two replicates, are smaller than the symbol except as shown for ettringite.

An accurate accounting of the calcite content is important for thermodynamic calculations because it alone controls the amount of available carbonate and therefore determines the extent to which hemicarboaluminate phases will form in preference to ettringite and monosulfate phases. Nevertheless, some calcite is usually expected to be present in cement powders. Taylor states that most cements contain calcite formed by carbonation of free limeReference Taylor36; even if the free lime content is effectively zero in a cement, local heterogeneities will result in lime-rich regions that readily carbonate, even when specimens are stored in a dessiccator. Unfortunately, small quantities of calcite in cement are difficult to detect by QXRD because the primary diffraction peak for calcite overlaps the main peak for C3S, and because the secondary peaks are much smaller and fall within the background. As an alternative, therefore, we inferred the calcite mass fractions reported in Table II from TGA measurements. Even so, there is a strong possibility of overestimating the calcite content by TGA if any free lime in the cement powder reacts with residual carbon dioxide in the atmosphere during heating of the powder sample. Data for CCRL 151 indicates that this happens readily during heating in air,Reference Bullard and Stutzman43 so it is legitimate to suspect that the initial calcite content in CCRL 168 is overestimated by TGA. Therefore, we also conducted simulations on CCRL 168 in which the inferred calcite content in the cement was neglected. In these simulations (the solid lines for ettringite and monosulfate in Fig. 4) the agreement between the model and the experimental data is much better for ettringite. In addition, the monosulfate phase is predicted to form earlier, which is also more consistent with the experimental data than when calcite is not neglected. This time, however, the model significantly overestimates the amount of monosulfate at later ages. The better agreement to the ettringite data in the absence of calcite in Fig. 4 suggests that the calcite content has been overestimated. When calcite in the initial powder is neglected, the model significantly overestimates the amount of monosulfate at later ages. At this point, we cannot readily account either for the early formation of monosulfate, between 8 h and 36 h, or for its apparent disappearance at later ages.
B. Heat of hydration and compressive strength
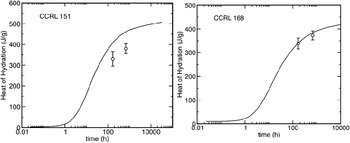
Laboratories participating in the CCRL proficiency sample program used the ASTM C186 heat of solution test method21 to measure the heats of hydration at 7 days and 28 days for both cements. Figure 5 shows the mean values with the error bars representing ±1 standard deviation. The model tracks the isothermal heat release from the paste continuously because it accounts for the enthalpy of formation of each solid phase and solute species. The continuous curves show the model predictions using a cement paste with w/c = 0.4 cured isothermally at 23 °C under sealed conditions. The fit to the experimental data is good for CCRL 168, but the model overestimates the heat release at both times for CCRL 151. This is not too surprising in light of the fact that the model overestimates the mass fractions of CH and ettringite as CCRL 151 hydrates (see Fig. 3).
Predicted time dependence of the heat release in CCRL 151 and CCRL 168 pastes (w/c = 0.40) cured under sealed conditions at 23 °C. Continuous curves are model predictions. Open circles are the mean values measured at 168 h (7 days) and 672 h (28 days), and the error bars represent ±1 standard deviation of approximately 20 measurements each.Reference Schwartz, Auzerais, Dunsmuir, Martys, Bentz and Torquato20, 21

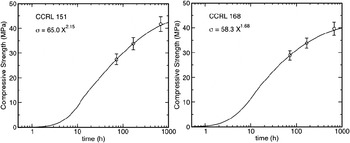
For simulating the compressive strengths of mortar cubes, as measured by the ASTM C109 test method,21 simulations were run for pastes of both CCRL 151 and CCRL 168 at w/c = 0.485, using isothermal curing at 23 °C under sealed conditions. From each simulation we calculate the Powers gel-space ratio, X, defined as the ratio of the combined volume of all hydration products (the gel), to the sum of the gel volume and the volume of capillary pores. The mortar cube compressive strength, σ, is estimated from X as a function of time, t, according to the following relation recommended by TaylorReference Taylor36:

For each cement paste, the values of A and n in Eq. (2) were determined algebraically from the experimental data at 3 days and 7 days. Figure 6 shows the simulation results and the experimental data measured by the testing laboratories at 3 days, 7 days, and 28 days. The fit is necessarily perfect at 3 days and 7 days because the constant parameters were determined by fitting to those measurements; therefore, the only meaningful comparison can be made at 28 days. The calibrated Eq. (2) fits the 28 day strength well within the experimental uncertainty. Further testing is required on a wider range of cement pastes, but it may be possible to make reasonable strength predictions with the model by fitting only the lead coefficient A using the measured strength at 3 and setting the exponent to a fixed value between 1.68 and 2.15.
Predicted time dependence of the compressive strength in CCRL 151 and CCRL 168 mortars (w/c = 0.485) cured under sealed conditions at 23 °C. Continuous curves are model predictions using the gel-space ratio equation given in each plot. Open circles are the mean values measured at 72 h (3 days), 168 h (7 days) and 672 h (28 days), and the error bars represent ±1 standard deviation of approximately 200 measurements each.Reference Schwartz, Auzerais, Dunsmuir, Martys, Bentz and Torquato20, 21

C. Microstructure development
All the simulation results in the previous section involved only bulk phase quantities as a function of time. In this section we compare the spatial distribution of the phases in the microstructure of CCRL 168 to experimental observations.
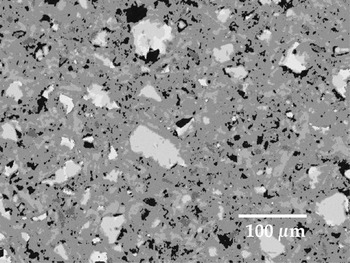
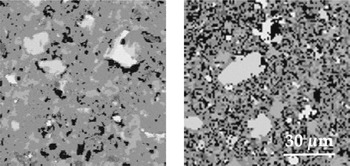
Figure 7 shows an SEM image of a polished section of CCRL 168 paste hydrated for 7 days at 23 °C under sealed conditions, and Fig. 8 compares a representative portion of that image to a representative 2D slice of the simulated 3D microstructure at the same time. The simulated microstructure appears to compare favorably to the observed microstructure. For example, both microstructures show an intimate intermixing of hydration products in the outer product, the unhydrated particle morphologies are similar, and the location and spacing of the larger capillary pores are similar.
SEM image of a polished section of CCRL 168 paste hydrated for 7 days at 23 °C under sealed conditions. The images have been segmented into the following phase collections, in order of decreasing brightness in the images: clinker silicates, clinker interstitial phases, CH, C–S–H gel, monosulfate, ettringite, capillary pores.

Representative portion of the observed hydrated microstructure from Fig. 7 (left) compared to the simulated hydrated microstructure (right).

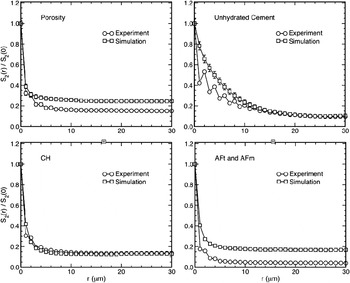
The simulated and observed microstructures have similar volume fractions of the major unhydrated and hydrated solid phases, with the exception of ettringite, as already shown in Fig. 4. In addition, we can make a rough quantitative comparison of the spatial distribution of the major phases by using two-point correlation functions. The two-point correlation function, S(r), for a given phase in a structure is the conditional probability that the phase is found at a location given by the position vector r given that the origin of the vector is also occupied by that phase. In an isotropic structure, S can be plotted as a function of distance r = |r| between the two points in question. S(r) captures a number of properties of the spatial distribution of the phase. For example, the limiting value S(r → 0) is the probability that a randomly chosen point coincides with the phase, and is equal to the volume fraction ϕ of the phase. Likewise, the limiting value S(r → ∝) is ϕ 2. In addition, the limiting slope of S as r → 0 is –1/4 of the surface-area-to-volume ratio of the phase, and the first minimum of S is an estimate of the average effective radius of the domains of the phase. These and other properties of S are discussed in detail in Berryman and Blair.Reference Berryman and Blair47
Figure 9 shows the observed and simulated correlation functions for the microstructures in Fig. 7 and Fig. 8, respectively. In the figure, the plots have been normalized to the value of the correlation function at r = 0, to reduce the effect of the differences in volume fractions of the phases in the real and simulated microstructures. The agreement between the real and simulated microstructures is reasonably good, especially for CH and the unhydrated cement. The differences at larger distances for the capillary porosity are due primarily to the differences in calculated total porosity and that observed in the micrograph in Fig. 7. Although each curve has been normalized to its value at r = 0, which is the volume fraction φ of the phase(s) in the corresponding microstructure, the limiting value of the correlation function at larger distances is φ 2 in a perfectly random microstructure. Normalizing the curves by φ therefore reduces, but does not eliminate, the systematic differences at large distances.
Two-point correlation functions as a function of distance, r, normalized by their values at r = 0, for the simulated hydration of CCRL 168 with w/c = 0.45, including capillary porosity, unhydrated cement grains, CH, and combined ettringite (AFt) and monosulfate (AFm) phases. Error bars for the simulations represent ±1 standard deviation at each point for five different 2D slices of the microstructure. Where error bars are not visible, they are smaller than the symbol.

At large distances there are significant differences between the real and calculated correlation function for the combined phases of ettringite plus monosulfate (Fig. 9). These differences are attributable to the difference between the volume fraction of these phases in the simulated microstructure (0.16) and the micrograph in Fig. 7 (0.04). At this time, we cannot readily account for this low volume fraction in the microstructure compared to the simulated microstructure and even to the QXRD results in Fig. 4. Perhaps the low volume fraction in Fig. 7 is an anomalous sampling error that would be corrected by analyzing additional image fields of the same specimen.
V. DISCUSSION
Among several motivations for simulating microstructure development of hydrating cement pastes, a major reason is to enable the reconstruction of realistic microstructures that can subsequently be used to calculate or estimate material properties that influence performance and service life. This latter reason has been our principal motivation for developing the current model.
Several recent publications have demonstrated that bulk properties, that is, those that depend only on the total amounts of each phase, can be reasonably estimated for a variety of cement types using only equilibrium thermodynamic calculations coupled with empirical kinetic equations for the dissolution rate of clinker phases.Reference Lothenbach and Winnefeld10, Reference Lothenbach and Wieland11, Reference Lothenbach, Le Saout, Gallucci and Scrivener13, Reference Guillon, Chen, Chanvillard, Schlangen and De Schutter14 But properties that depend on microstructure are more difficult to estimate because the emergent microstructure is sensitive to the kinetic rate laws and anisotropy of growth and dissolution by which it is governed. Our approach here has been to estimate microstructural changes by using a few simple rules for growth and dissolution, tailored to each phase, as summarized in Table III. As already described, the rules we have used for simulating growth and dissolution were not derived from any fundamental physical or chemical principles. Instead, the rules were developed to simulate nucleation and coherent growth or dissolution at interfaces with some built in randomness that can be tuned for each phase. The rule parameters were chosen to produce simulated microstructures that compare favorably to experimentally observed microstructures both in their qualitative appearance and in their two-point correlation functions.
Microstructure-dependent properties such as the effective elastic and viscoelastic moduli, gas and liquid permeabilities, and diffusion formation factor can be calculated using finite difference or finite element methods on a 3D digitized microstructure image.Reference Berryman and Blair47, Reference Garboczi, Bentz, Martys and Wong48 Some of these properties, particularly the elastic moduli, depend primarily on the volume fraction of each solid phase and the connectivity of the solid structure. The dependence of these properties on the finer details of the microstructure is fairly weak. But other properties, such as permeability, depend much more strongly on the distribution in size and shape of pores across multiple length scales. A simulated microstructure must have greater fidelity to the actual microstructure to make accurate calculations of these latter properties. Good matches to the two-point correlation functions will not guarantee that the microstructure is accurate enough. A more satisfactory test of the microstructure would compare the actual pore-size distribution, measured by gas adsorption or low-temperature calorimetry, to the pore-size distribution measured on the actual microstructure.
The pore space in cement paste is extremely complex topologically, and has important features on length scales ranging from nanometers to micrometers. The simulations presented in this paper have a lattice spacing of 1 μm; neither capillary pores smaller than 1 μm, nor the gel porosity, can be resolved in these simulations, so we would not expect to be able to make accurate calculations of transport properties. In order to include such small pores explicitly, one would need to run the simulations at a lattice resolution of a few nanometers. But this strategy is not currently feasible for at least two reasons. First, it would require about 1012 lattice sites to include a representative volume element of cement paste, about 106 μm3, while still resolving the smallest pores. This number of lattice sites is too large, by several orders of magnitude, to be simulated with this model or with any of the finite difference or finite element models for calculating transport properties. In addition, even if these computational limitations could be overcome, the physics of C–S–H growth at these length scales is not well understood, so formulating nanoscale C–S–H growth rules that would accurately reproduce the gel pore morphology for the different types of C–S–HReference Richardson38, Reference Allen, Thomas and Jennings49 would be a major challenge. A more effective strategy for including small pores probably would be to simulate the hydration of much smaller volumes, approximately 1 μm3, using a lattice resolution of about 10 nm. By simulating a statistical ensemble of these small systems and examining the evolution in porosity at such small length scales, it may be possible to develop constitutive models of the pore volume and morphology that can be used in the model at larger length scales. Such constitutive models would also need to draw heavily on experimental measurements of C–S–H gel pore structure by gas adsorption,Reference Jennings50 by neutron scattering techniques,Reference Allen, Thomas and Jennings49 and by direct microscopic examination.Reference Richardson38
A second challenge is to extend the model to simulate hydration of cements containing supplementary cementitious materials (SCMs). The thermodynamic model has been successfully used to simulate the influence of limestone additions to portland cement, but the microstructure development model has not yet been tested on such systems. Even more importantly, for SCMs such as blast furnace slag and fly ash, general kinetic models for their dissolution rates as a function of composition and fineness do not yet exist. Developing models for slag and fly ash dissolution rates is a major challenge that must be addressed before the thermodynamic model or the microstructure model can be applied to such systems. Finally, limited experimental observations have indicated that the nanostructural properties of C–S–H gel change slowly with age and also depend significantly on the composition of the cement.Reference Richardson38 Again, constitutive models will be required to account for these changes in C–S–H, especially when simulating microstructures that are decades or centuries old.
VI. SUMMARY
A numerical model has been described for simulating the microstructure development of hydrating cement paste. The model couples three separate submodels: an empirical model of the dissolution kinetics of the four major clinker phases, an equilibrium thermodynamic model for determining the phase assemblage based on equilibrium with the pore solution, and a rule-based digital image model for incrementally changing the 3D microstructure in a way that is consistent with the thermodynamic calculations. This model has been tested here on two ordinary portland cement pastes, and reasonable agreement between simulation and experiment was obtained for the bulk phase volume fractions at any time beyond about 10 h of hydration. In addition, the actual and simulated microstructures were mostly in good qualitative and quantitative agreement, both in terms of the microstructure appearance and the two-point correlation functions. The model also provides good agreement with the measured 28-day compressive strength of ASTM C 109 mortar cubes and the heat of hydration. Furthermore, the model should be transferable to cementitious materials containing SCMs provided that some experimental data on the dissolution kinetics of those materials is available to supplement the dissolution kinetics model for the cement clinker phases.
ACKNOWLEDGMENTS
This work was supported by the United States Department of Energy Cementitious Barriers Partnership program and by the Sustainable Concrete Materials program at NIST.