Introduction
The population aged over 60 years in China reached more than 185 million people in 2016, accounting for 13.26 per cent of the country's population (National Bureau of Statistics of China, 2016). With the development of information and communication technologies, smartphones have become one of the most commonly used information and computer technology products among the older Chinese population. Older people are subjected to reduced abilities and fewer opportunities to participate in social activities. Smartphones provide an easy method to communicate with more people and access information freely at home (Ihm and Hsieh, Reference Ihm and Hsieh2015). Smartphones help older people reduce loneliness and depression and build connections with the outside world. However, poorly designed text and layout can lead to visual fatigue and affect a user's performance and experience (Streveler and Wasserman, Reference Streveler, Wasserman and Shackel1984; Chen et al., Reference Chen, Xie, Ma and Zhang2005; Darroch et al., Reference Darroch, Goodman, Brewster and Gray2005). Few studies have been conducted regarding older users’ experience of reading Chinese fonts on mobile displays. Improvements in the user experience (UX) of older people will enhance their quality of life; therefore, study of the UX of font size (FS) and spacing on smartphones for older people is in great demand.
Research regarding the suitable FS and spacing for comfortable reading on smartphones is scant. Studies have been conducted on feature phones and computer screens, in terms of FS, word spacing (WS) and line spacing (LS) (Shurtleff, Reference Shurtleff1967; Tullis et al., Reference Tullis, Boynton, Hersh, Katz, Mack and Marks1995; Bernard et al., Reference Bernard, Chaparro, Mills and Halcomb2003; Wang et al., Reference Wang, Sato, Rau, Fujimura, Gao and Asano2009). Bernard et al. (Reference Bernard, Liao, Mills and Tremaine2001) recommended a 14-point (pt) FS for older people on computers. Ko et al. (Reference Ko, Mohapatra, Bailey, Sheedy and Rempel2014) observed that when the height of the font increased from 1.78 or 2.33 to 3.56 millimetres (mm) for text-based computer tasks, users’ productivity was improved. Likewise, Alotaibi (Reference Alotaibi2007) reported an improvement in reading performance for subjects with both normal sight and simulated visual impairment when the FS was increased. The lower bound of English characters can be read on smartphones at 4 pt for younger people and 6 pt for older people; however, 8–12 pt was recommended for older people using smartphones (Darroch et al., Reference Darroch, Goodman, Brewster and Gray2005). Huang et al. (Reference Huang, Rau and Liu2009) investigated the optimal Chinese FS with a view distance of 350 mm for four smartphone screen resolutions, suggesting 1.0-mm character height as the threshold for readability. FS recommendations were made based on readability and legibility; however, the comfortable reading range of FS, WS and LS were not considered in their tests. Therefore, this research is a continuation of previous studies to investigate the effect of the perceived comfortable FS and spacing on the reading experience.
Research on WS and LS is inadequate. Rayner and Pollatsek (Reference Rayner and Pollatsek1996) argued that reading unspaced text was not easy for most readers and used diagnostic methods to examine the role of spacing. Unspaced text interfered with both word identification and eye movement control (Rayner et al., Reference Rayner, Fischer and Pollatsek1998). These studies indicated that decreasing WS could deteriorate reading performance. Chan and Lee (Reference Chan and Lee2005) explored the factors that influence reading performance of traditional Chinese on computer screens, indicating superior performance in double LS than single LS. Wang et al. (Reference Wang, Sato, Rau, Fujimura, Gao and Asano2009) investigated the effect of inter-line spacing and inter-character spacing on legibility by inviting older adults to read on smartphones; they observed that commonly used text spacing was unsuitable for older people, and text spacing influenced the reading performance, readability, visual fatigue and text preference. Overall, these studies indicate that increased WS and LS are beneficial for reading performance.
This study aimed to deduce a comfortable reading range of FS, WS and LS for older people based on the findings of previous studies. We also investigated the effects of a comfortable range of FS, WS and LS on reading experience from a UX theory perspective. UX is ‘a person's perceptions and responses that result from the use or anticipated use of a product, system, or services’, as defined by the international standard for ergonomics of human system interaction, ISO 9241-210 (International Organization for Standardization 2010). In this study, the concerns of UX are usability, visual comfort, cognitive load (CL) and reading performance. This research addresses the question of how to design a range of FS, WS and LS for older users to read comfortably.
Larger FS, WS and LS were manipulated in this study to investigate their effects on reading experience. We also examined how different combinations of FS, WS and LS influence usability, visual comfort, CL and reading performance to examine how these combinations are further shaped by different reading scenarios. The framework of this research is presented in Figure 1. This study addresses the following research questions:
(1) What range of FS, WS and LS is suitable for older people to read comfortably on a smartphone?
(2) How do FS, WS and LS affect usability, visual comfort, CL and reading performance?
(3) Do eye movement data support subjective ratings?
(4) Is the combination of maximum FS, WS and LS suitable for all scenarios?
Research framework.

Method
Range of comfortable FS, WS and LS
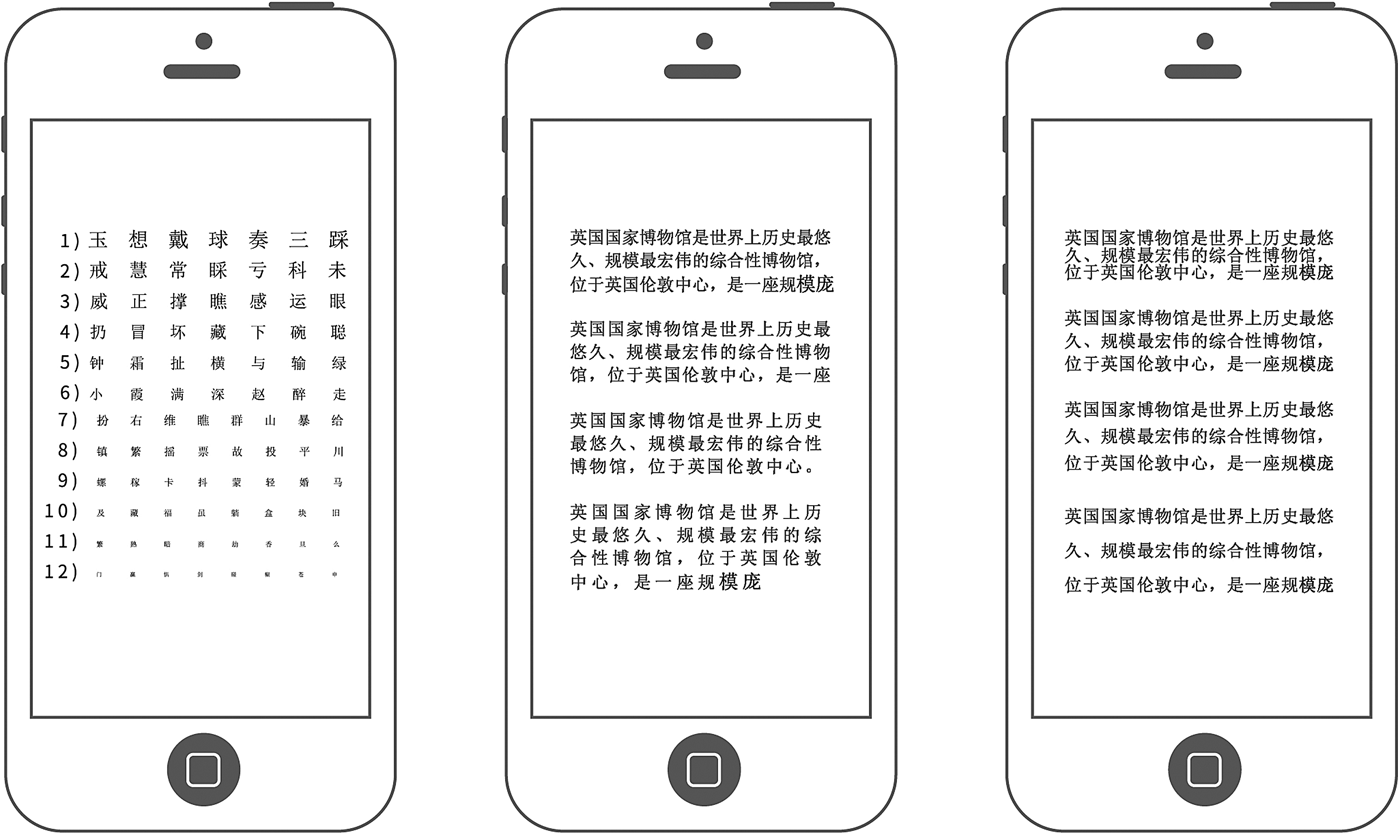
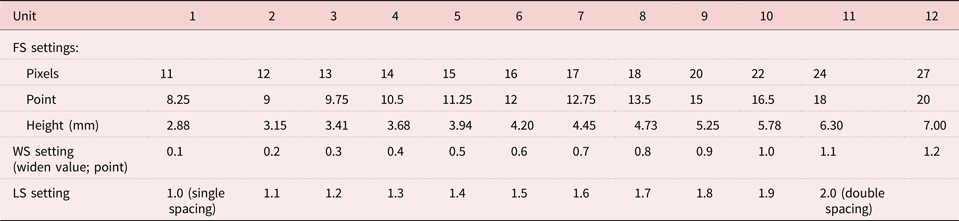
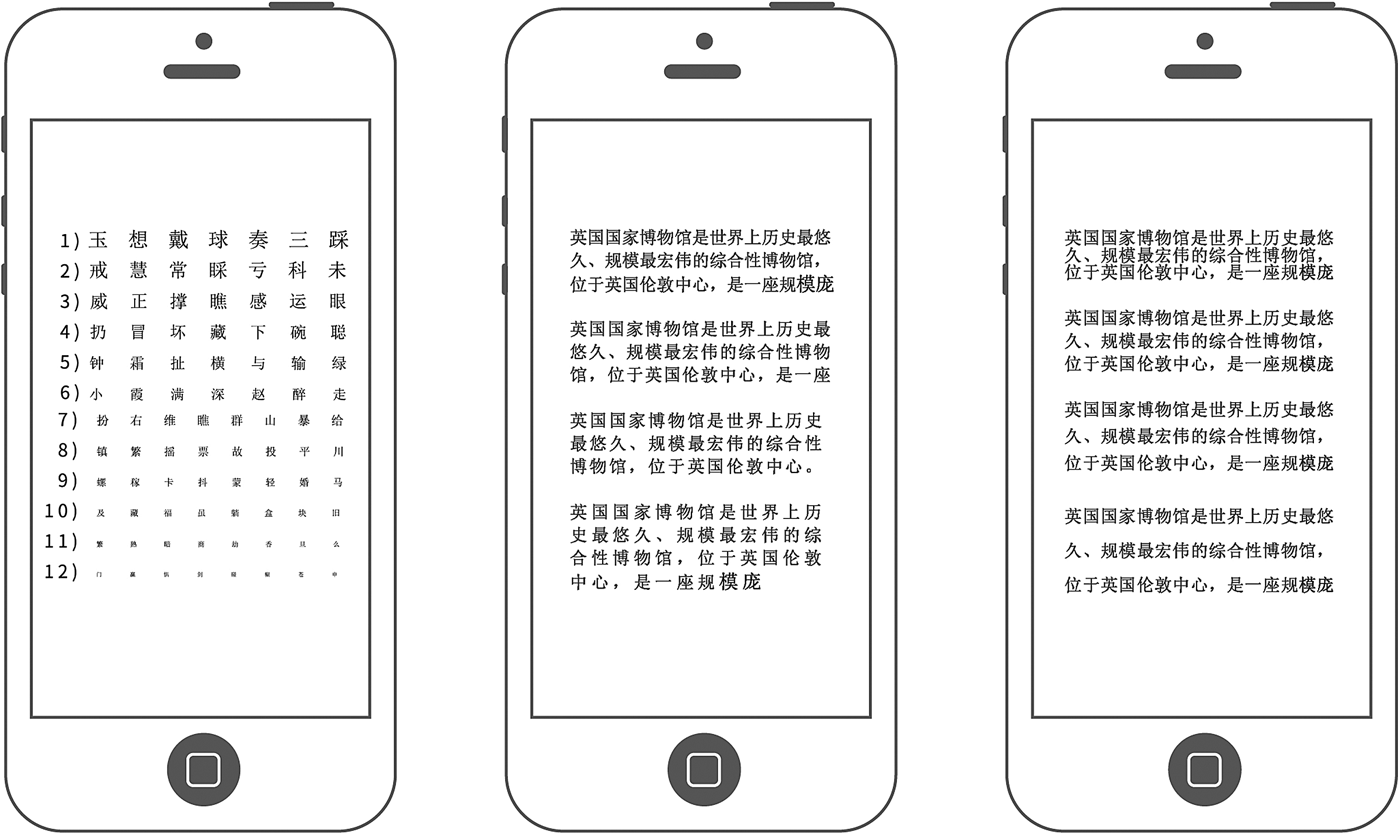
A survey was conducted to predetermine an appropriate range of older people's vision and other characteristics related to product use with 190 participants, aged from 59 to 79 years. This study used a vision chart derived from the logarithmic-progression letter charts, and the material was displayed on an iPhone 6, as presented in Figure 2. There were 12 FS and WS in this survey, and the information is summarised in Table 1. The minimum FS value was 11 pixels (px) (8.25 pt) and the maximum value was 27 px (20 pt). Widen standard WS over 0.1 pt was the minimum value, and over 1.2 pt was the maximum value. LS was set from single spacing to double spacing.
Samples of visual comfort test material.
Range of font sizes (FS) and spacing for visual comfort survey
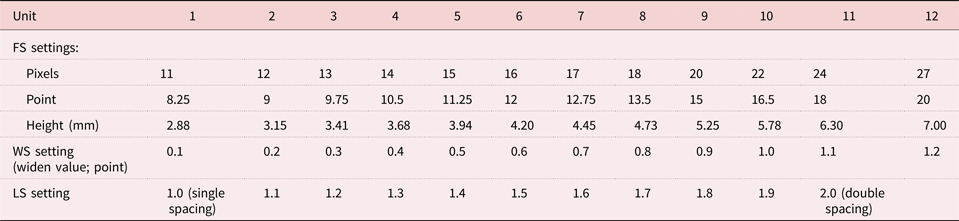
Notes: mm: millimetres. WS: word spacing. LS: line spacing.
The FS chart had 12 rows with seven or eight letters per row, and the spacing settings were consistent with the Regan acuity chart (Hazel and Elliott, Reference Hazel and Elliott2002). The WS chart was composed of 12 WS settings with the same content, whereas the LS chart was composed of 11 LS settings.
In the WS and LS charts, FS was fixed at 11 px, which is the minimum recommended FS value on a smartphone (Darroch et al., Reference Darroch, Goodman, Brewster and Gray2005). Moreover, when testing comfortable WS, the LS was set as the standard LS, and vice versa. Standard WS and LS were used as the baselines to reduce their own influence in the survey.
Participants were asked to hold an iPhone 6 at a comfortable reading distance and choose the smallest row in a comfortable setting. Comfortable WS and LS measures had similar results with the FS measure. Participants were asked to use visual aids that they used in a daily reading setting. The screen size was 5.5 inches, with a resolution of 1,920 px × 1,080 px. Each participant took approximately 15 minutes to finish the survey.
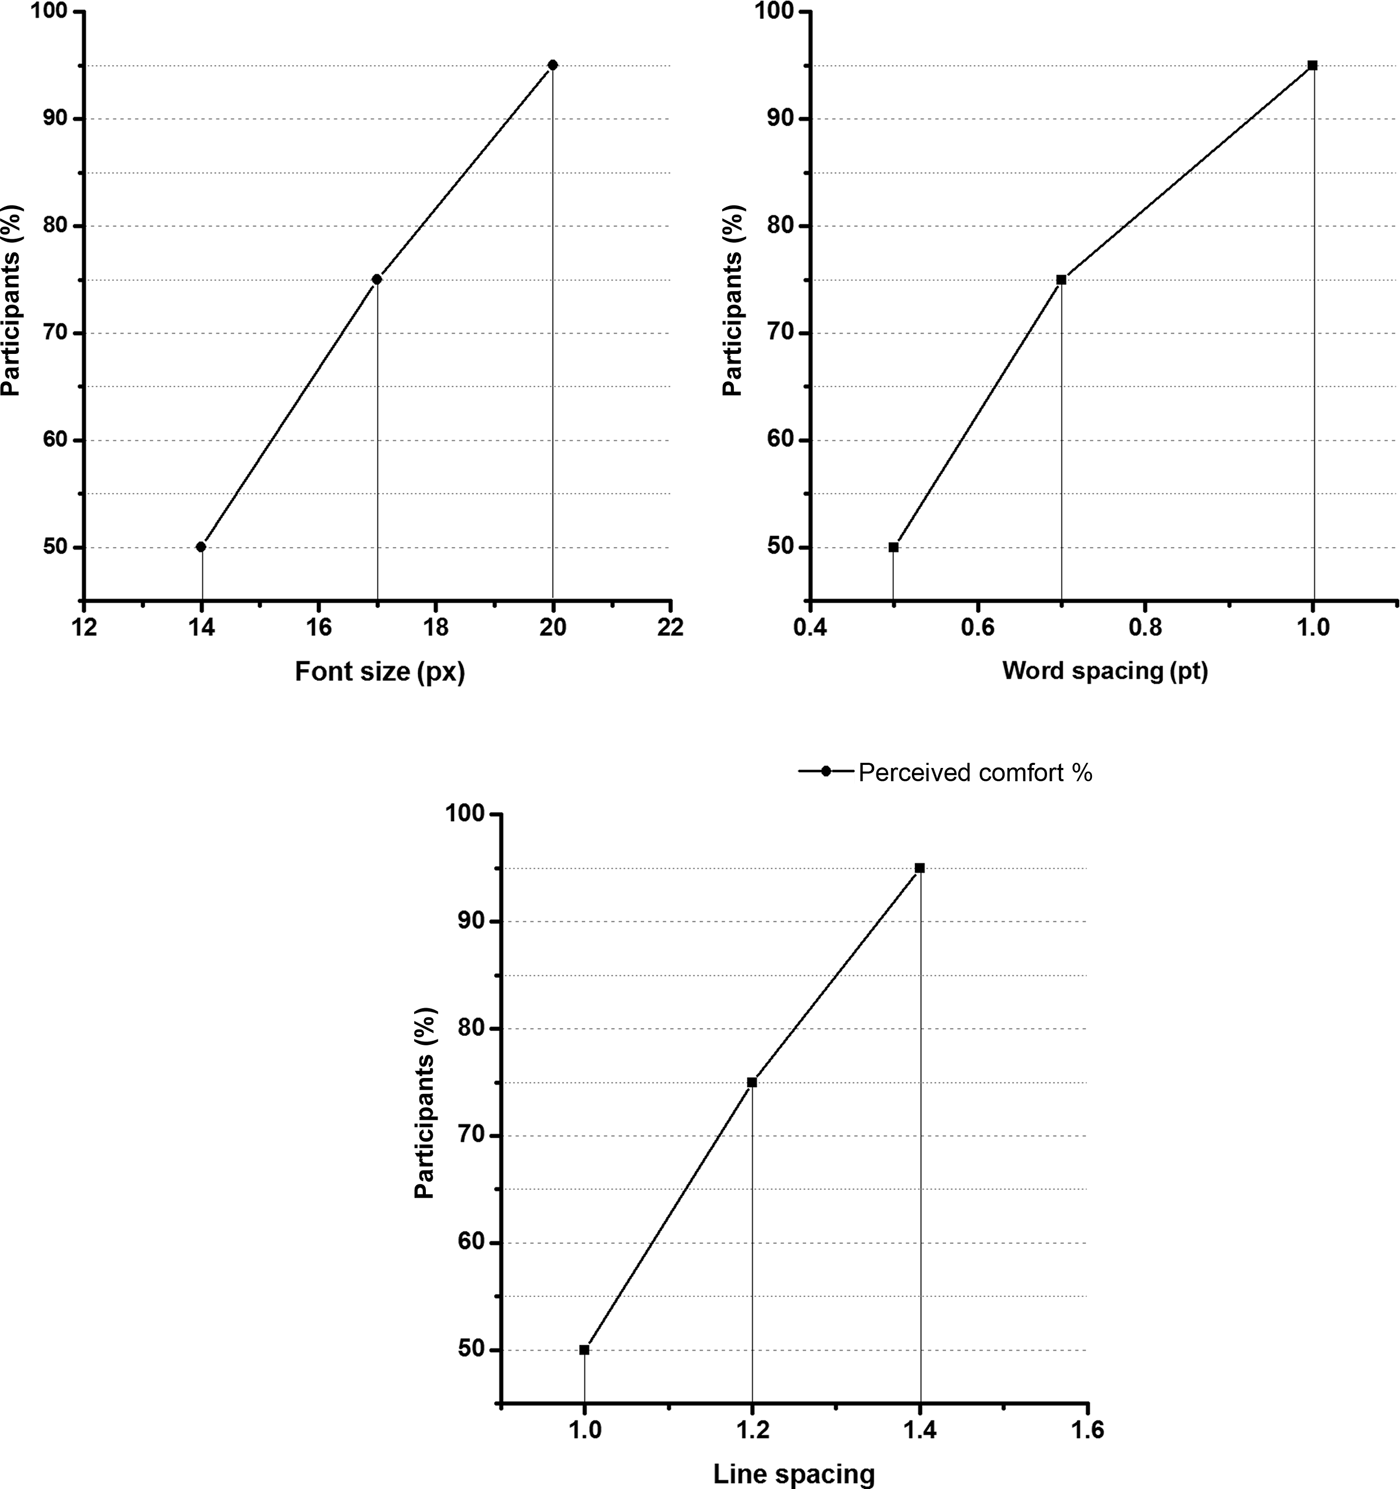
We set three levels for each variable, which were selected based on the proportion of the participants chosen. In our study, we chose the commonly used 95 per cent in ergonomics as the maximum level, with 75 and 50 per cent as the other two levels. For example, 50 per cent of participants perceived 14-px FS as comfortable, whereas 75 per cent of participants preferred 17 px, and 95 per cent of participants preferred 20 px. The selection is presented in Figure 3. The sizes selected were considerably larger than the default size. The three levels of FS were 14, 17 and 20 px. The WS was increased using standard WS by 0.5, 0.7 and 1.0 pt. The LS was increased by 1.0, 1.2 and 1.4 times standard LS.
Proportion of participants’ perceived comfort for font size, word spacing and line spacing.

Experiment design
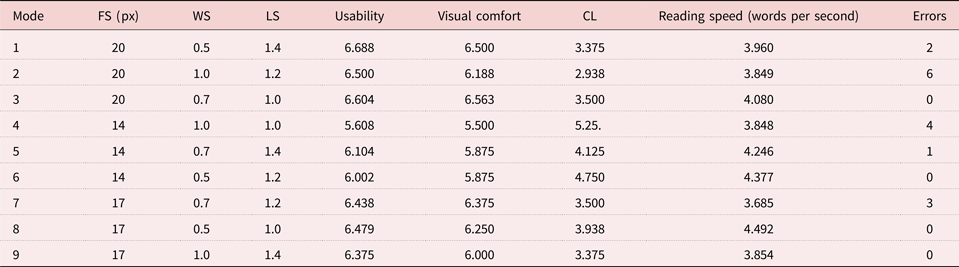
Previous studies have not observed interaction between FS and LS in reading performance and subjective ratings (Chan and Lee, Reference Chan and Lee2005) or inter-character spacing and inter-line spacing (Wang et al., Reference Wang, Sato, Rau, Fujimura, Gao and Asano2009). Therefore, a 3 × 3 × 3 orthogonal experiment design was employed to evaluate the effects of larger FS, WS and LS on usability, visual comfort, CL and reading performance. The orthogonal experiment design arrangement L9(34) is displayed in Table 2. There were nine modes of FS and text spacing in this experiment. According to the Latin square sequence, 20 participants used all these nine modes.
Orthogonal experimental design L9(34) to assess the effects of font size (FS), word spacing (WS) and line spacing (LS) on usability, degree of comfort, cognitive load (CL) and reading performance
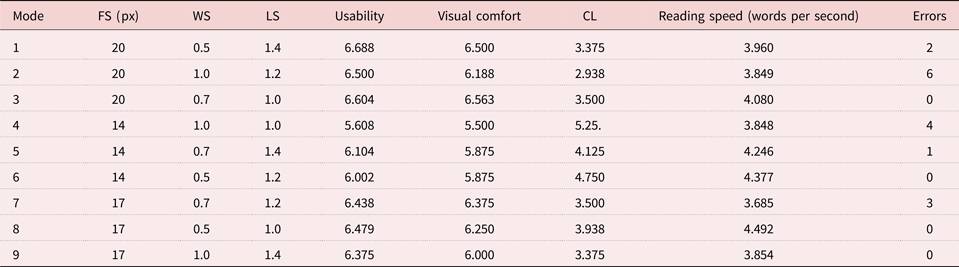
Notes: Mode denotes a combination of FS, WS and LS. px: pixel.
Usability, visual comfort and CL were assessed through subjective rating scales that were revised from ASQ (Lewis, Reference Lewis1991) and The Cognitive Load Subjective Ratings (Pass and Vanmerrienboer, Reference Paas and Vanmerrienboer1994). The scores ranged from 1 to 7. Reading time was recorded by reading software on the iPhone 6. During the experiment, eye movement data were recorded by Dikablis.
Participants
This study recruited 20 older participants from Tongji University for the Elderly (eight females, 12 males). The mean age of the participants was 61.93, standard deviation (SD) = 3.55, with a range of 57–70 years. The tests were conducted with the participants’ daily visual aids. All the participants used their smartphones to read every day for at least one hour.
Tasks
There were ten tasks for each participant, one visual search task and nine reading tasks as were shown in Figure 4. The reading materials were designed with nine combinations of FS and WS. First, participants were required to search for a specified character from a pseudo-chart. This task was used to set a baseline for eye movement data, and assure that the participants’ visual abilities were sufficient for the following task. Participants were asked to finish the reading tasks next. The reading materials were filled with general information about history, culture and geography from the Baidu encyclopaedia, and their difficulty levels were properly controlled through expert assessment. Participants were asked to answer a question about each of the reading materials, and any errors that occurred were recorded manually. After the experiment was completed, we conducted a short individual interview to understand why the errors occurred. The length of each article was approximately 200 characters (SD = 2.8).
Procedure of the experiment.

Procedure
The experiment was conducted at the laboratory of the Inclusive Design Research Centre at Tongji University in China. We simulated routine ambient lighting using 40-Watt LED lights during the experiment. An iPhone 6 with a specifically developed reading application was used in the experiment. The screen size was 5.5 inches, with a resolution of 1,920 × 1,080 px. The distance from the screen to the participants’ eyes was the same as their normal reading settings at home. Every participant spent 15 minutes adapting to the lighting, and then wore eye-tracker glasses. It took approximately 40 minutes for a participant to finish the experiment. To test the cumulative effect of CL, the experiment began at 9:00 am and finished at 11:00 am; the experiment was completed in approximately one week.
The experiments started with a questionnaire about basic information, such as age, visual ability and reading experience on smartphones. An introduction of the task and a brief practice session were conducted to help participants understand the tasks. Participants were asked to complete the visual search and reading tasks according to a list of steps. After each reading task was completed, participants were required to answer corresponding questions and complete the scales.
Data collection and analysis
Data from 20 groups were collected. For the visual search task, there were two groups of data, including eye movement data and reading performance. For reading tasks, there were 18 groups of data, including nine groups of eye movement data and nine groups of subjective ratings. Moreover, visual search was deemed a high cognitive-demand task (Borowsky et al., Reference Borowsky, Horrey, Liang, Garabet, Simmons and Fisher2016). In this study, we set the eye movement data of visual search tasks as a baseline to test whether participants’ UX was improved by different combinations of FS, WS and LS. The data were collected from the same group of participants. The orthogonal experiment results were analysed through range and variance analysis, and eye movement data were analysed through paired-samples t-tests. SPSS 19.0 was used to analyse the result, with p < 0.05 set as the level of significance.
Results
Effects of FS and spacing on UX
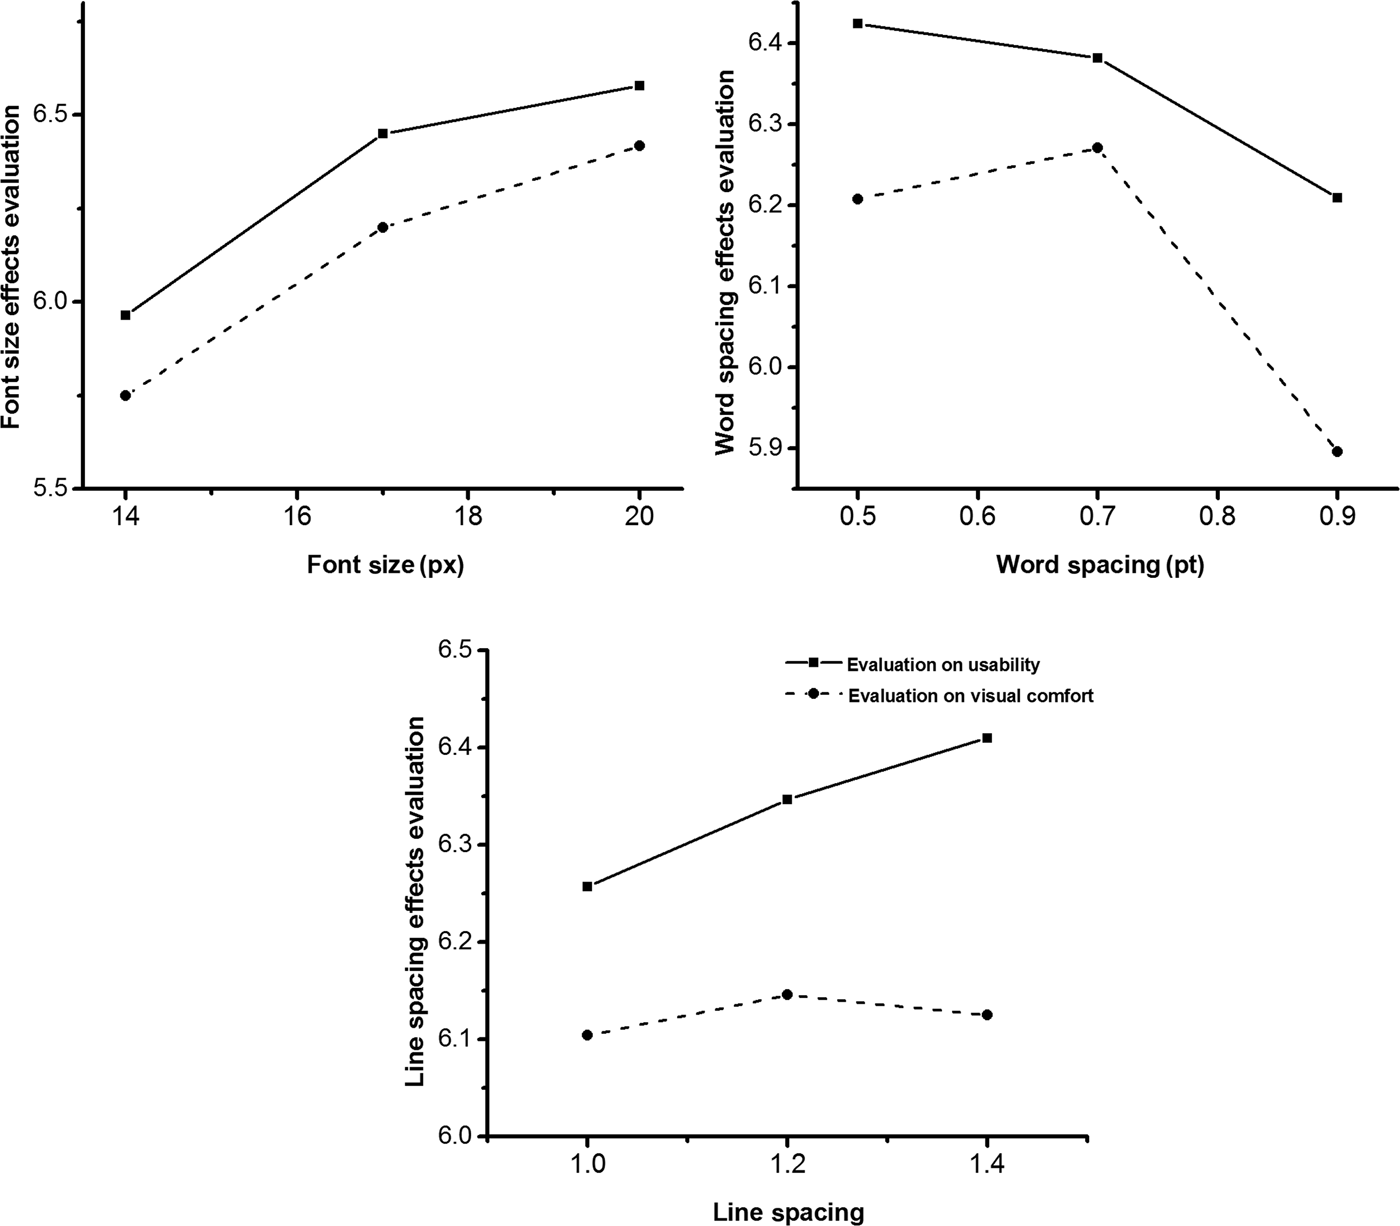
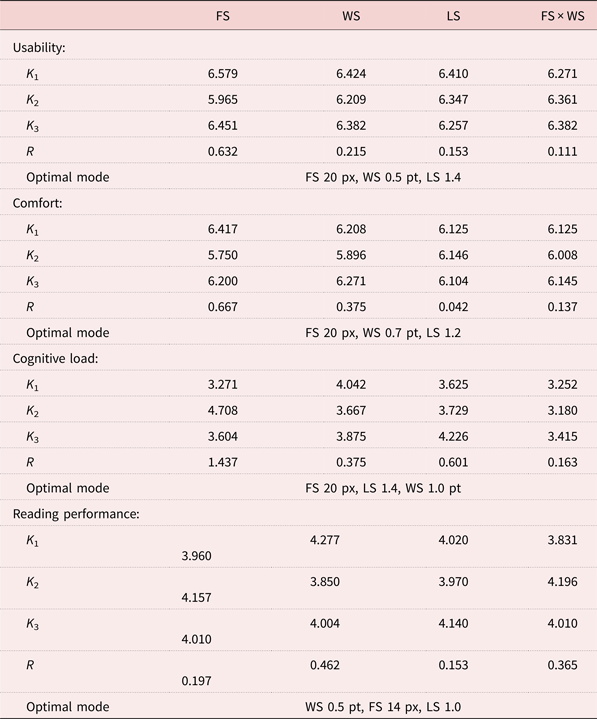
Usability improved with the increase of FS and LS. The mean value of subjective usability evaluation varied between 5.608 and 6.688. The highest value was observed in mode 1, whereas the lowest was observed in mode 4. Range analysis revealed that FS had the greatest effect on usability, followed by WS and LS. The optimal combination for older people's usability was 20 px FS, increasing the standard WS by 0.5 pt, with 1.4 times the standard LS (Table 3). The usability improved with the increase of FS and LS. However, usability declined with the increase of WS, as presented in Figure 5.
Effects on usability and visual comfort.

Orthogonal experimental range analysis: influence of three factors on usability, visual comfort, cognitive load and reading performance
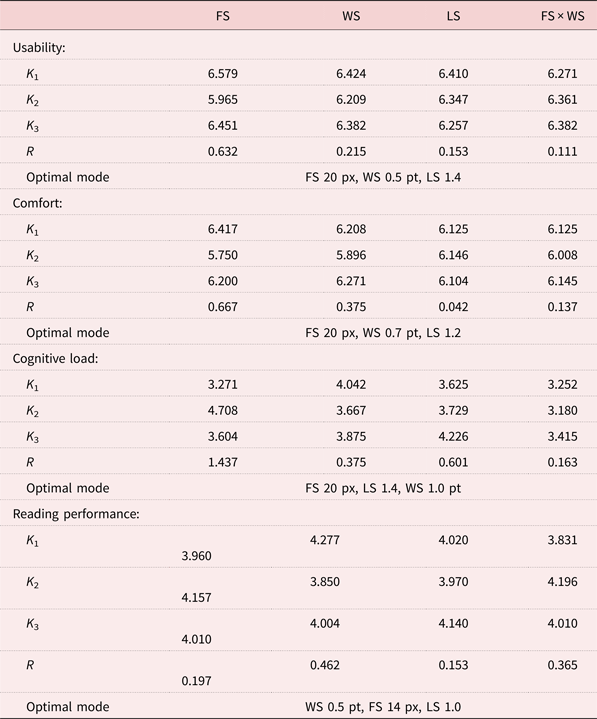
Notes: K 1 refers to the mean of the sum of the experimental results corresponding to level 1 in any column. R refers to range, R = max {K 1, K 2, K 3} − min {K 1, K 2, K 3}. FS: font size. WS: word spacing. LS: line spacing. px: pixel. pt: point.
Oversized WS reduced the perception of visual comfort. The mean value of visual comfort varied between 5.500 and 6.563. The highest evaluation of comfort was observed in mode 3, whereas the lowest was observed in mode 4. The factors that exerted the greatest effect on comfort were FS, followed by WS, FS × WS, and LS (Table 4). The optimal combination for older people's perception of comfort was under the condition of 20-px FS, increasing the standard WS by 0.7 pt, with 1.2 times the LS. As presented in Figure 5, the evaluation improved with FS increasing from 15 to 17 px, although the improvement tendency slowed from 17 to 20 px. The evaluation improved when WS increased from 0.5 to 0.7 pt, but dropped from 0.7 to 1.0 pt. In addition, visual comfort barely changed with the increase of LS.
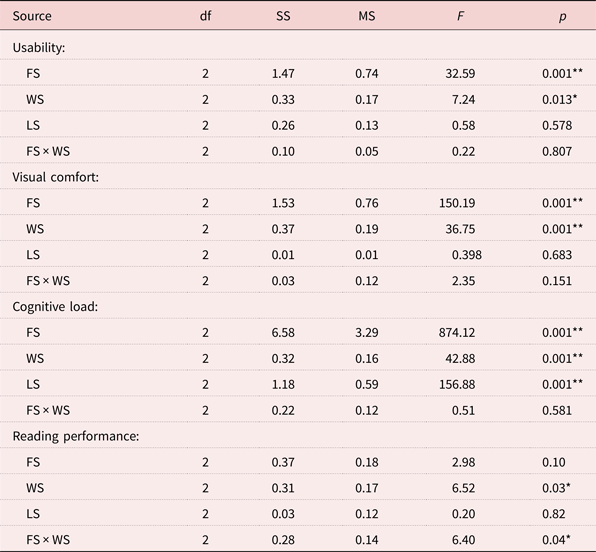
Results of analysis of variance of the orthogonal experiment
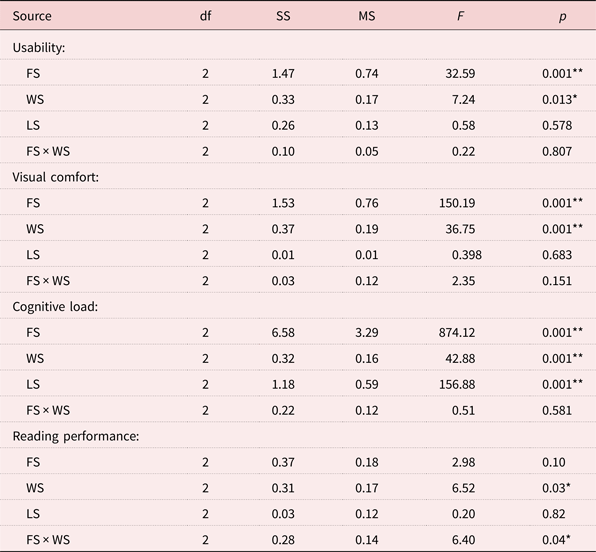
Notes: FS: font size. WS: word spacing. LS: line spacing. df: degrees of freedom. SS: sum of squares. MS: mean square.
Significance levels: * p < 0.05, ** p < 0.01.
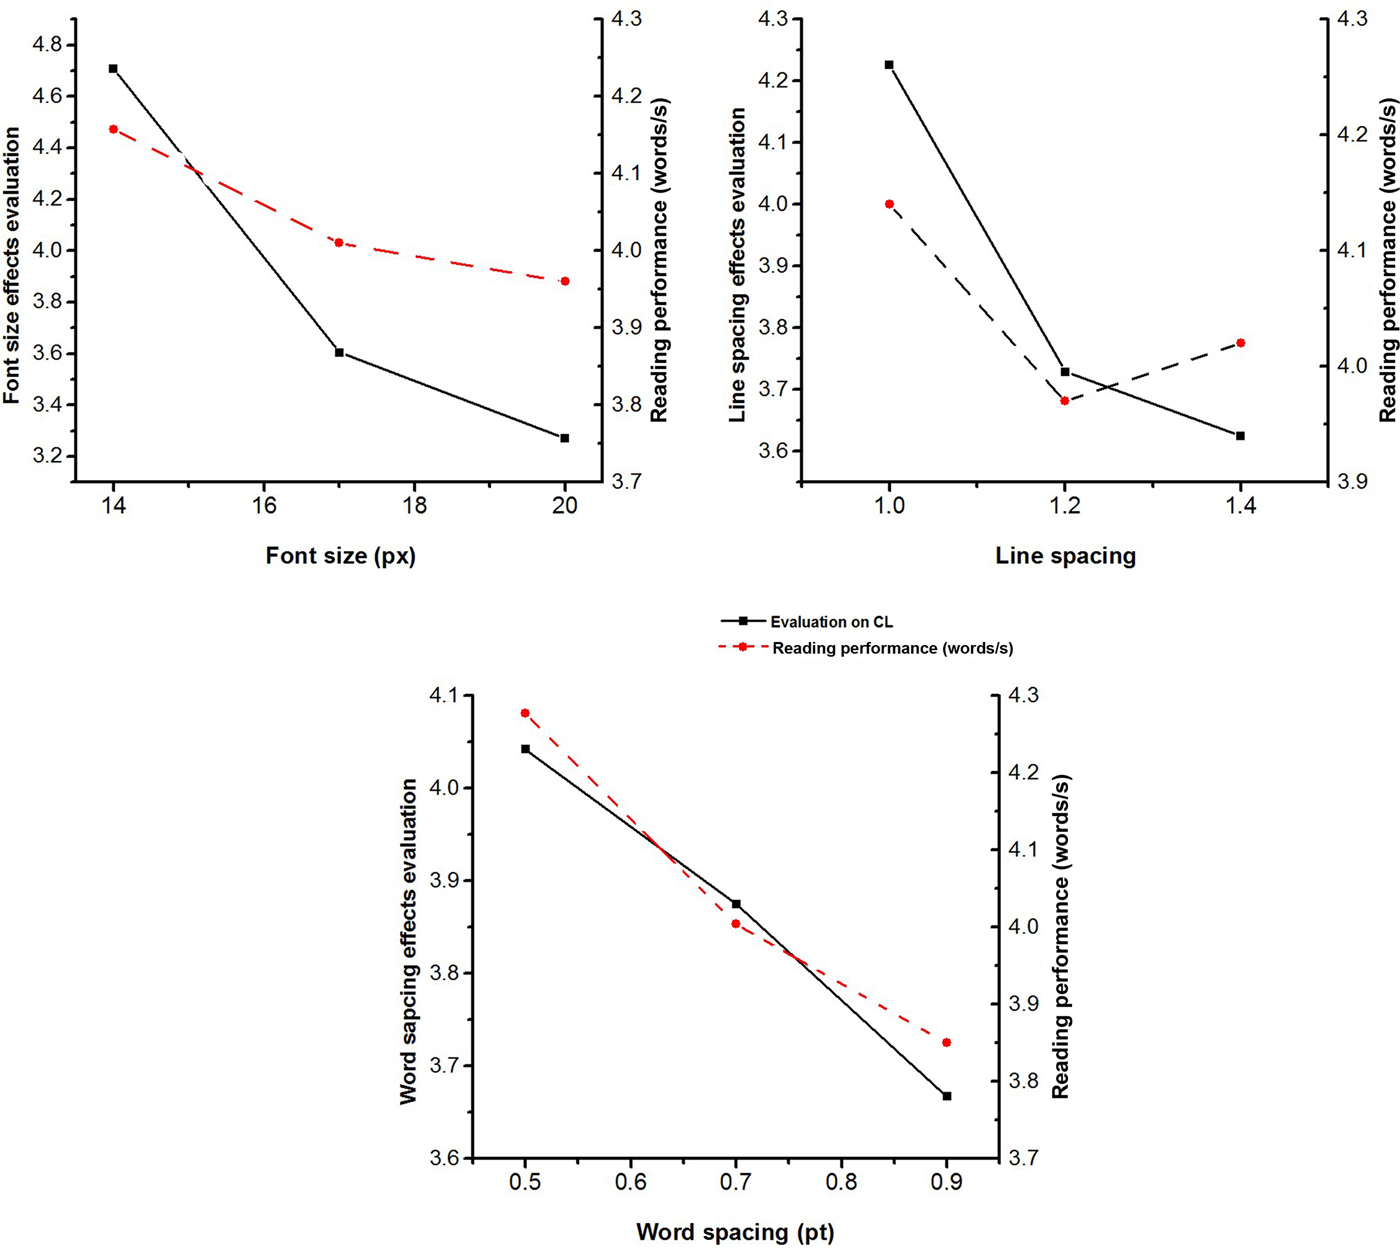
The CL decreased with the increase of FS and spacing. The subjective evaluation of CL was assessed through the Paas scale. The mean score varied between 2.938 and 5.25. The highest assessment of CL was observed in mode 4, whereas the lowest was observed in mode 2. Range analysis revealed that FS had the greatest effect on CL, followed by LS and WS. The optimal combination for the lowest CL was under the condition of 20-px FS, 1.4 times the standard LS, and increasing the standard WS by 1.0 pt (Table 3). With the increase of FS, LS and WS, the CL declined dramatically.
Reading performance was evaluated by the average number of words read per second, and reading time was recorded automatically by the software. The results are presented in Table 2; the mean values of reading performance varied between 3.685 and 4.492 words per second. The best reading performance was observed in mode 8, whereas the worst was observed in mode 7. Range analysis revealed that the greatest effects (in descending order) on reading performance were from WS, FS × WS, FS and LS. The optimal mode for reading performance was achieved by increasing the standard WS by 0.5 pt, FS by 14 px, with double (1.0-times increase) standard LS (Table 3). However, reading performance worsened with the increase of WS, FS and LS, as presented in Figure 6.
Effects on cognitive load (CL) and reading performance.

The effect tendency of these factors on reading performance, as presented in Figure 5, was different from that on usability and visual comfort. Reading performance worsened with the increase of WS, FS and LS.
Main effects of FS, WS and LS
The results of variance analysis strengthened the results of range analysis. The main effects of FS on usability (p < 0.001), visual comfort (p < 0.001) and CL (p < 0.001) were significant. Moreover, WS had a significant effect on usability (p < 0.05), visual comfort (p < 0.001), CL (p < 0.001) and reading performance (p < 0.05). LS had a significant effect on CL (p < 0.001). Variance analysis revealed that the interaction between FS and WS had a significant effect on reading performance (Table 4).
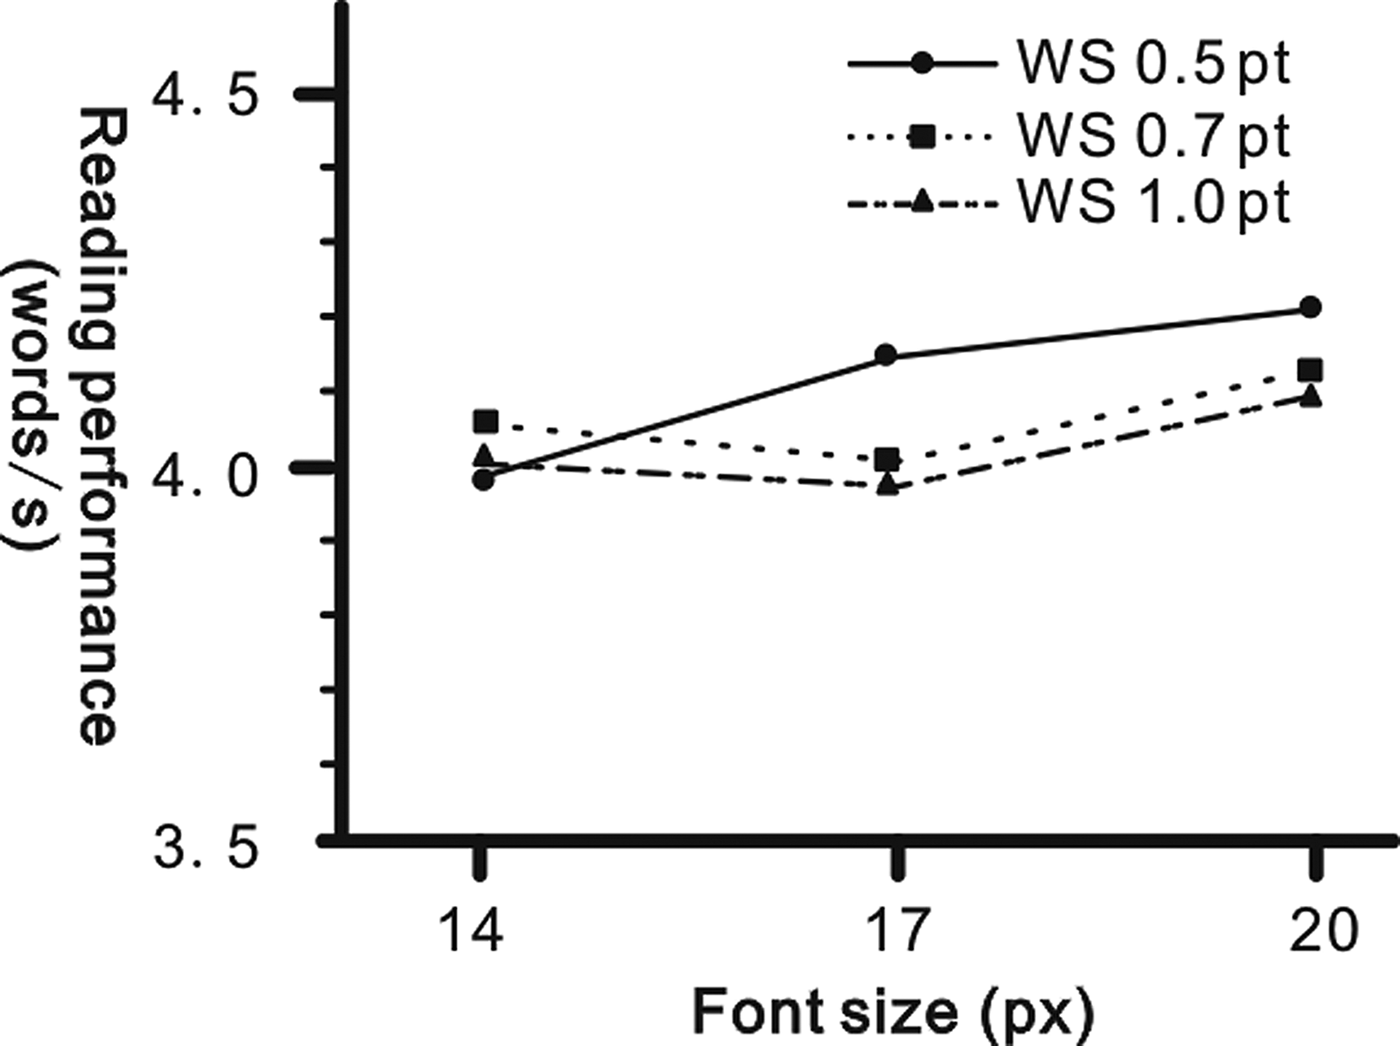
As presented in Figure 7, the reading performance improved when WS was fixed at 0.5 pt and FS was increased, indicating that the larger the FS is, the greater the reading performance. The reading performance dropped when WS was fixed at 0.7 or 1.0 pt and FS increased from 14 to 17 px or 17 to 20 px. The result indicated that when WS was fixed at 0.5 pt, the increased FS was most suited to improve reading performance.
Interaction of font size and word spacing (WS) on reading performance.

Eye movement data reflect usability, visual comfort and CL
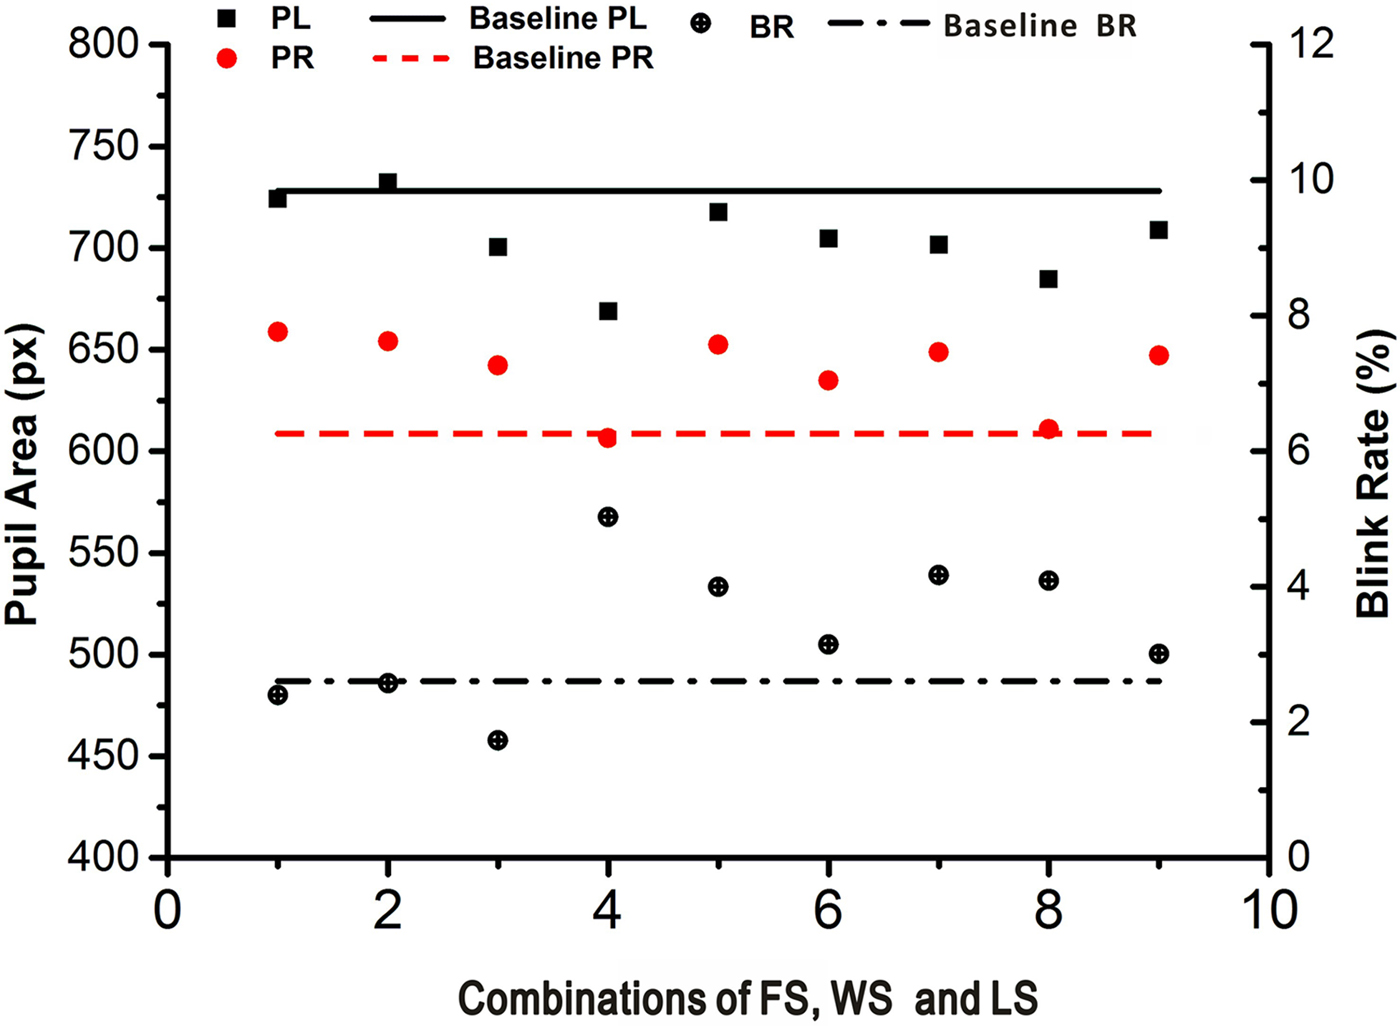
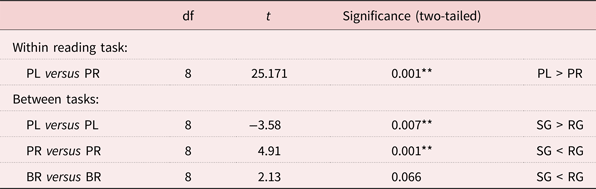
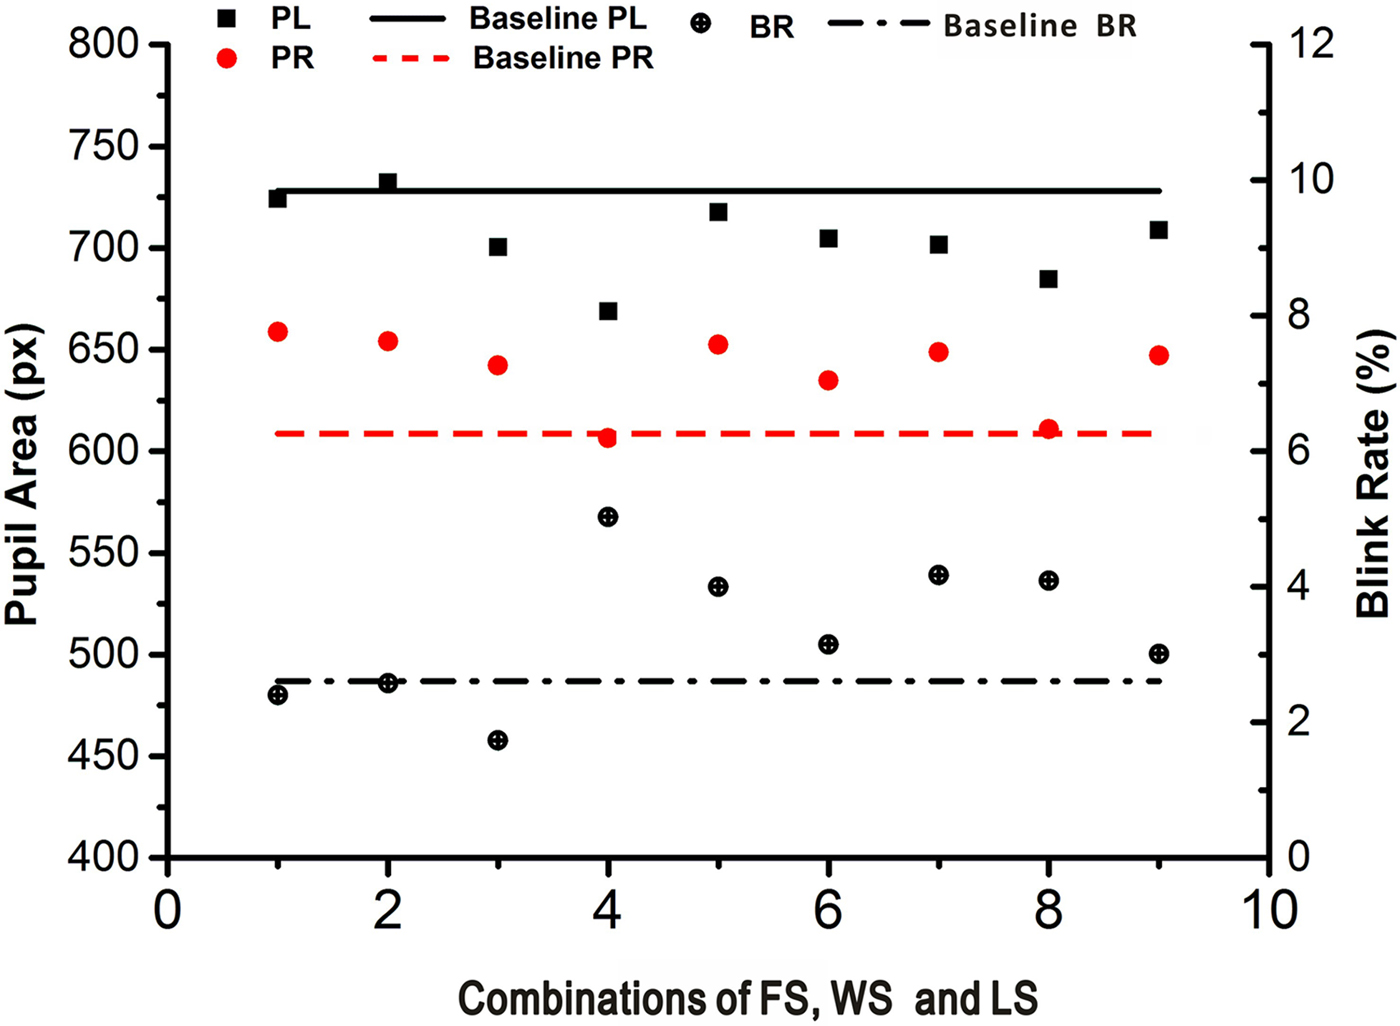
Eye movement data from ten groups were collected by eye trackers through visual search tasks during the experiment. The distributions of the mean pupil area (left eye: PL; right eye: PR) and blink rate (BR) of each mode are presented in Figure 8. According to the results of the paired-samples t-test showed in Table 5, a significant difference was observed between the PL and PR in terms of pupil area (t = 25.171, p = 0.001). PL was considerably bigger than PR size in the reading task group. Furthermore, a significant difference was observed between reading task PL and visual search PL (t = −3.581, p = 0.007); PL in the visual search group was bigger than that in the reading group on average. PL of the visual search group was set as the PL baseline. A significant difference was also observed between reading task PR and visual search PR (t = 4.909, p = 0.001). PR of the visual search group was smaller than that of the reading group, and PR of the visual search group was set as a PR baseline.
Scatter plot of pupil area and blink rate (BR).
Paired-samples t-tests for the reading task group of the left eye pupil area (PL), right eye pupil area (PR) and the visual search group of PL, PR and blink rate (BR)
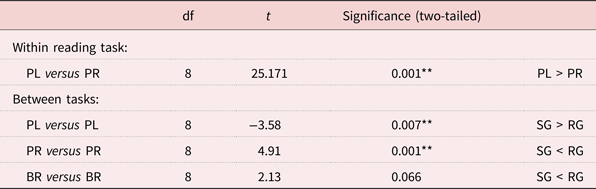
Notes: df: degrees of freedom. SG: searching group. RG: reading group.
Significance levels: * p < 0.05, ** p < 0.01.
The BRs of two groups were compared using paired-samples t-tests, and the result did not show a statistically significant difference between the two groups (t = 2.13, p = 0.066). Setting visual search BR as a baseline, Figure 8 shows that BR within the reading group was higher on average than the baseline, with the exceptions of modes 1–3.
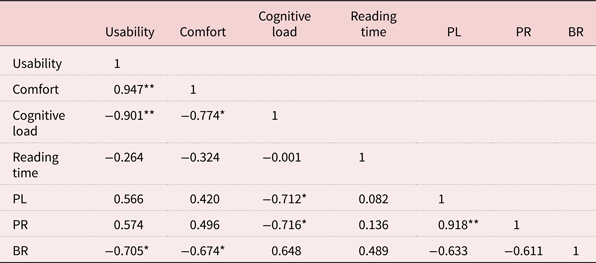
The correlation between PL and PR was calculated with Pearson's correlation coefficients, and significant correlations were observed for PL and PR (r = 0.918, p < 0.01). However, the correlations among PL, PR and BR were not significant (r = −0.633, p = 0.067; r = −0.61, p = 0.08), as presented in Table 6.
Correlations of user experience and eye movement data
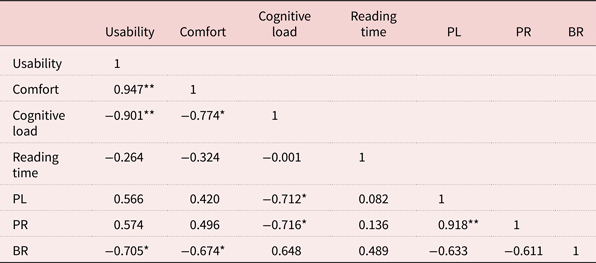
Notes: PL: left eye pupil area. PR: right eye pupil area. BR: blink rate.
Significance levels: * Correlation is significant at the 0.05 level (two-tailed). ** Correlation is significant at the 0.01 level (two-tailed).
Discussion
Comfortable range of FS and spacing
The results of the visual comfort survey indicated that older people preferred larger FS and spacing, but they commented negatively about the largest FS and spacing. The comfortable range of FS was 14–20 px (10.5–15 pt) in this study, which is bigger than that suggested by Darroch et al. (Reference Darroch, Goodman, Brewster and Gray2005), which recommended FS in the range of 8–12 pt for the readability of English text. The comfortable range of WS is to increase the standard WS by 0.5–1.0 pt; for LS, it was 1.0–1.4 times the standard LS. Few studies have discussed the comfortable ranges of WS and LS; however, related research has indicated that using spacing between words in Chinese and English text is preferred to not using spacing (Rayner et al., Reference Rayner, Fischer and Pollatsek1998; Ling and Schaik, Reference Ling and Schaik2007). Furthermore, research has found that reading performance when distinguishing Chinese characters is superior with double spacing instead of single spacing (Chan and Lee, Reference Chan and Lee2005); this indicates that larger LS improves legibility. However, in our study, the older participants had only a few positive comments when LS was over 1.4 times the standard LS; this suggests that larger LS is not always preferred.
Effects of FS and spacing on usability, visual comfort, CL and reading performance
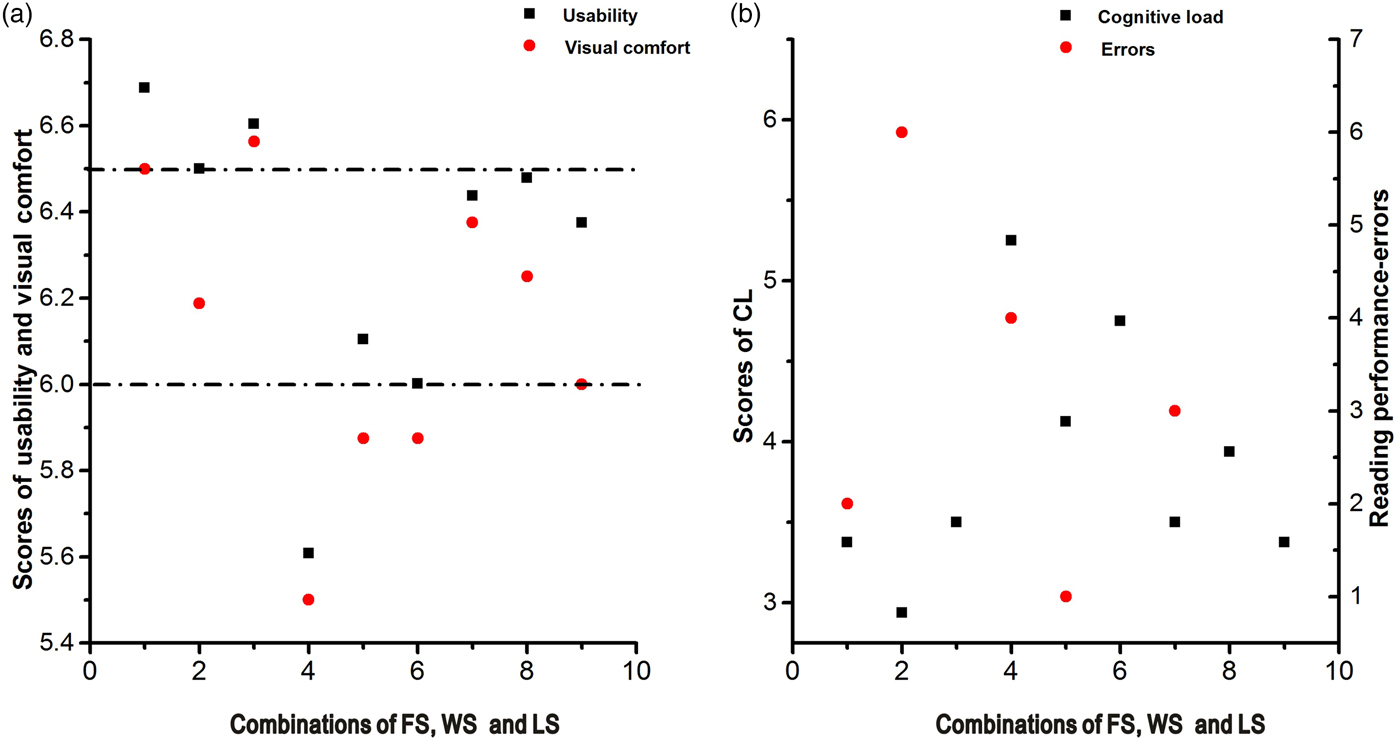
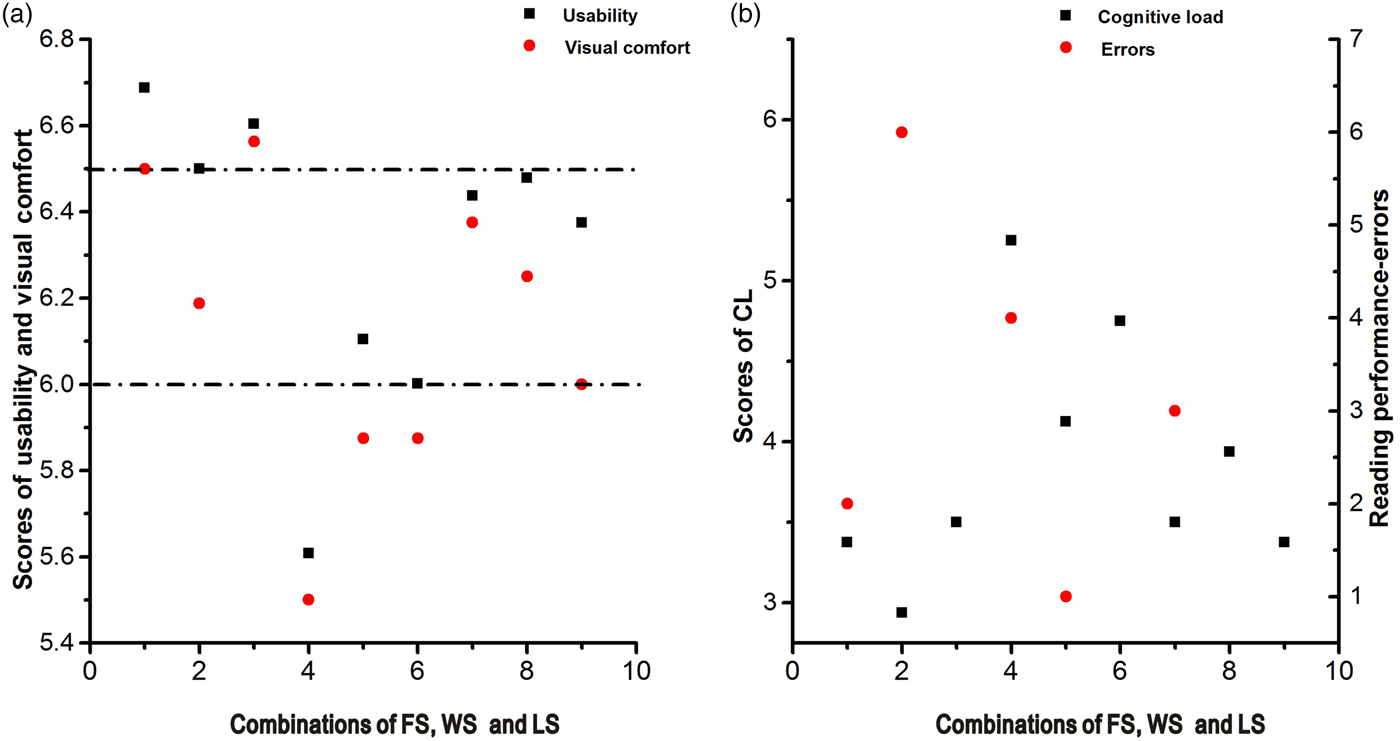
While reading on smartphones, older people are generally more likely to begin by judging whether the FS is sufficiently big to be distinguished and less likely to begin by judging whether they like the content (Brajnik and Giachin, Reference Brajnik and Giachin2014). In the current study, UX was examined to determine the effect of FS, WS and LS. The effects of FS, WS and LS on UX were obvious across the nine modes (Figure 9a). When the participants were evaluating UX for each mode, their attitudes towards the combinations were remarkably different, suggesting that older people are sensitive to changes in spacing and FS combination.
Scores for (a) usability and visual comfort; (b) cognitive load (CL) and reading performance.
The results of the orthogonal experiment analysis of variance indicated that the main effects of FS and word size on usability and visual comfort are significant, indicating that priority should be given to FS and WS when designing for usability and visual comfort. In particular, more attention should be paid to FS than WS because both range analysis and variance analysis proved that FS is more influential than WS. However, the results indicated that when FS was increased by more than 17 px, the improved usability and visual comfort were subtle. Mills and Weldon (Reference Mills and Weldon1987) observed that 80 characters per line were easier to read than 40 characters per line. However, no upper bound was apparent in our study; this may be because the range of FS that was chosen by the older participants did not get sufficiently high.
The evaluation of usability decreased as the WS increased, whereas it improved as the LS increased. No upper bounds of WS and LS were observed for usability. However, upper bounds of WS and LS for visual comfort were observed when the standard WS increased by 0.7 pt and LS was 1.2 times the standard. Our findings are partly in line with those of previous studies. However, previous studies have claimed that increases of WS and LS would improve readability and legibility (Rayner and Pollatsek, Reference Rayner and Pollatsek1996; Rayner et al., Reference Rayner, Fischer and Pollatsek1998; Wang et al., Reference Wang, Sato, Rau, Fujimura, Gao and Asano2009), but our findings indicate a decline in usability as WS increased. This may be because the comfortable range of WS that was chosen by the older participants was considerably higher than that in previous studies. The findings of previous studies also indicated that the upper bound of WS for usability should be observed; however, the upper bound of WS requires further research.
Cognitive processing capacity determines how much CL one can bear (Paas and Vanmerrienboer, Reference Paas and Vanmerrienboer1994). Older people experience declined cognitive processing capacity, including visual ability and working memory capacity and are, therefore, easily subject to an increase in CL (Paas et al., Reference Paas, Renkl and Sweller2003). Visual effort varied when the combinations of FS, WS and LS changed; therefore, it is crucial to consider older people's visual conditions and effort required to complete the work successfully.
The main effects of all the independent variables on CL were significant, and the order of effect size was FS, LS, WS. As presented in Figure 9b, the lowest evaluation of CL was obtained in mode 2, but more errors were also observed. Modes 4 and 6 obtained the highest evaluation of CL, although the errors observed were fewer than those in mode 2. Individual interviews were conducted to understand why there were more errors than the average in the highest and lowest CL modes. The answers from the participants can be divided into two categories. (a) The content was not difficult, and the characters were comfortable to read, but the participants read too fast to notice the information in the question. (b) The characters were compressed and hard to distinguish, and the participants could not read carefully. These indicate that CL should neither be too high nor too low. When the combinations of FS, WS and LS were too dense, participants were forced to make extra efforts to distinguish and process the information, which occupied more working memory. However, when the combinations of characters and content were comfortable to read, older people were more likely to be distracted and ignore detailed information. Therefore, the combinations of FS, WS and LS should be designed carefully to maintain CL within a reasonable range and ensure older people's attention does not stray and they can complete the tasks smoothly.
For reading performance, the variance analysis indicated that the main effect of WS on reading speed was significant, implying that WS can dramatically affect reading speed. The interaction between FS and WS was also significant, and the recommended combination of FS and WS was 14 px and 0.5 pt, respectively. This phenomenon can be explained by Mills and Weldon's (Reference Mills and Weldon1987) study, which stated that the characters per line influence readability. Because of the iPhone 6's limited screen size and the increase of FS or WS, the number of characters presented on the screen was reduced, and reading became harder than it would be with smaller FS and spacing. Although increased FS, WS and LS may waste spacing, they benefit older people with their declining cognitive and physical capabilities as well as visual impairment.
Evidence from eye tracking
To verify the findings of the subjective ratings, we used eye tracking to investigate whether the effects of FS, LS and WS can be detected by eye movement indicators: PL, PR and BR. The pupil area was proven to be an effective measure of CL (Granholm et al., Reference Granholm, Morris, Sarkin, Asarnow and Jeste1997), whereas BR was associated with symptoms such as stress, anxiety, fatigue and dry eyes (Rodriguez et al., Reference Rodriguez, Lane, Ousler, Angjeli, Smith, Bateman and Abelson2016).
In this study, the correlations of pupil area and CL were calculated with Pearson's correlation coefficients, and there were significant correlations between PL and CL (r = − 0.712, p = 0.031) and PR and CL (r = −0.716, p = 0.030), which suggest that pupil size negatively correlated with the subjective evaluation of CL. A smaller pupil area indicated higher CL levels. The smallest pupil area was observed in mode 4. However, it was difficult to deduce which was the largest pupil area because the values of modes 1, 2, 5, 7 and 9 were similar and on the same level.
Furthermore, the correlation of BR and UX was analysed with Pearson's correlation coefficients. Significant correlations were observed between BR and usability (r = −0.705, p = 0.034) and BR and visual comfort (r = −0.674, p = 0.046). BR was recorded with an eye tracker, and the blink duration was divided by the total time of the experiment. This means that the higher the BR is, the longer the time the eye will be closed, triggering declines in usability and visual comfort. In addition, regardless of individual differences, BR is mainly influenced by FS, WS and LS. This suggests that BR was an objective indicator for usability and visual comfort. The longest eye-closed time was observed in mode 4, corresponding to the lowest evaluation scores for usability and visual comfort in Figure 9a. The shortest eye-closed time was observed in mode 3, corresponding to the highest evaluation score for visual comfort and the second highest score for usability.
To summarise, by investigating the relationship between subjective evaluation and eye movement data, we observed that character combinations affect UX for older people when reading from the iPhone 6. We also observed that the pupil area and BR have significant correlations with elements of UX.
Evolution of text design from feature phones to smartphones
There are many differences between feature phones and smartphones. First, smartphones are similar to computers; users can easily access the internet or various useful mobile applications (Yamakami, Reference Yamakami, Barolli, Taniar and Enokido2012). Second, they often have touch screens that make them easy to use. Finally, smartphones have considerably larger screens than those of feature phones and considerably higher screen resolution, which are key factors influencing FS, WS and LS design.
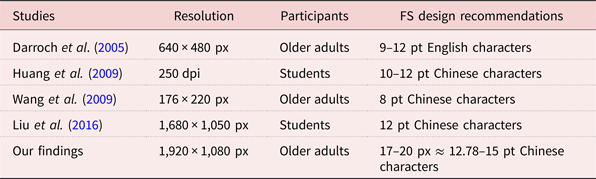
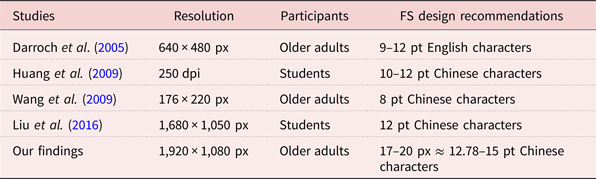
There have been previous studies conducted on feature phones. Their recommended settings are smaller than those indicated by our findings, as presented in Table 7. In addition, the resolutions of previous experiments’ devices have been relatively low when compared with the 1,920 × 1,080 px resolution used in this study. However, the findings from previous studies, with the exception of the study by Wang et al. (Reference Wang, Sato, Rau, Fujimura, Gao and Asano2009), have indicated that the FS recommendations have barely changed with improvements in screen resolution. Bernard et al. (Reference Bernard, Chaparro, Mills and Halcomb2003) recommended 14-pt FS for older people using conventional screens, which indicated that FS should be larger for larger screens.
Font size (FS) recommendation comparison between the findings of previous research and this study
Notes: px: pixel. dpi: dots per inch. pt: point.
There is a gap between our findings and the recommendations mentioned in previous studies. The reasons for the gap are as follows. (a) The survey of comfortable FS, WS and LS expanded the range of variables. Darroch et al. (Reference Darroch, Goodman, Brewster and Gray2005) recommended FS of 8–12 pt for readability, and many studies on FS have been carried out based on their findings. However, their study used small screens from ten years ago. The survey in this study was conducted using larger screens, and the comfortable range of FS perceived by older people was 14–20 px (10.5–15 pt), which is considerably larger than that indicated in previous studies. (b) The expectations of comfortable reading has changed. People spend much more time reading on smartphones than feature phones. Therefore, there is a need for a redesign of text display that can provide a comfortable reading experience for a longer period of time. (c) More characters can be displayed on larger screens, which require bigger FS and spacing for legibility. According to previous studies, the recommended FS is larger for computer displays than for smaller screens (Bernard et al., Reference Bernard, Chaparro, Mills and Halcomb2003; Darroch et al., Reference Darroch, Goodman, Brewster and Gray2005). In recent years, smartphone screens have become considerably larger than those of feature phones. Therefore, the recommendations for FS, WS and LS in this study were relatively big. Overall, our findings suggest optimal combinations of FS, WS and LS for smartphones are bigger than those for feature phones.
Design implications
A previous study claimed that people employ different strategies under different motivations when reading on smartphones (Scott and Hand, Reference Scott and Hand2016). Intensive reading and information search are two types of reading tasks usually performed in daily life. Older people may employ practical viewing strategies depending on their purposes (e.g. skim, quickly access information or intensive reading for fun).
Because of older people's multiple motivations for reading on smartphones, such as leisure, learning and communication, it is difficult to develop an optimal combination of FS, WS and LS to meet all the various needs of older people engaged in digital reading. The effects of text size and spacing on each construct of UX were varied. When designing a product for older people, it is necessary to choose the proper range of FS, WS and LS.
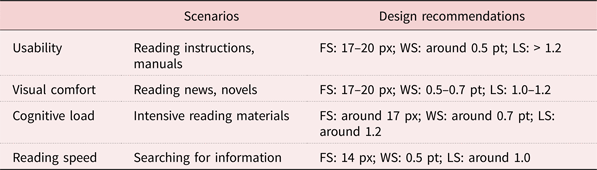
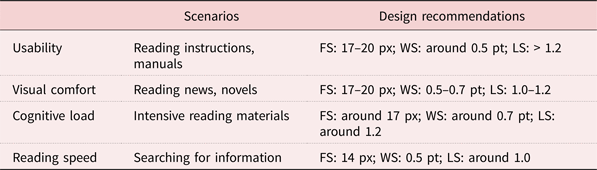
Table 8 summarises the study's findings for optimal ranges of FS, WS and LS for each construct of UX and its applications. Design elements may vary according to the reading motivations. Improved UX may lead to a pleasant reading experience, easier access and fewer errors for older people. Nevertheless, it is not always feasible to consider only one construct of UX. Table 8 presents combinations for design recommendations considering various situations. However, in practice, the UX should be considered as a whole, and designers should decide which UX constructs are more important in the design context. For example, when reading a manual on a smartphone, usability, visual comfort and CL should be considered together, and the combination should be approximately 17-px FS, 0.5-pt WS and LS 1.2 times the standard.
Summary of design recommendations
Notes: FS: font size. WS: word spacing. LS: line spacing. px: pixel. pt: point.
These findings can be applied to improve the reading experience of older people on smartphones. Designers rely heavily on personal experience when designing user interfaces. These findings can encourage designers to think actively about the needs of older people and identify solutions.
Conclusions
This study investigated the comfortable range of FS, WS and LS for older people reading on smartphones. We suggest upper bounds of WS and LS for visual comfort. In addition, the effects and interactions of FS, WS and LS were investigated with relation to usability, visual comfort, CL and reading performance. We observed that the main effects of FS and WS on usability, visual comfort and CL, and of the interaction between WS and FS on reading performance, were significant. These results are summarised as design guidelines for designers. The recommendations in this study are intended to encourage designers to understand the intricate relationships between Chinese character design and the constructs of UX. Furthermore, the study is expected to encourage designers to think actively about reader's motivations in various reading situations as well as provide evidence of how FS, WS and LS affect UX.
Financial support
This work was supported by the MOE (Ministry of Education in China) Project of Humanities and Social Sciences (grant number 17YJC760015) and the Natural Science Foundation of Zhejiang Province (grant number LGF18G010001).