





Introduction
An earlier version of this paper was presented at EuMW 2025 and was published in its proceedings [Reference Gebert, Schoch, Ufschlag, Wrana, Haussmann, John, Waagner and Kallfass1]. Over the last decades, an exponential growth in the demand for higher data rates for wireless communication has been observed [Reference Pärssinen, Alouini, Berg, Kuerner, Kyösti, Leinonen, Matinmikko-Blue, McCune, Pfeiffer and Wambacq2]. This trend further increased with the release of the fourth and fifth generations of mobile communication (4G and 5G) and is expected to continue with the release of the sixth generation of mobile communication (6G) [3]. In order to satisfy this demand, wireless communication systems with higher bandwidths are required. To achieve data rates above 100 Gbps, bandwidths in the gigahertz (GHz) range are required, even for highly complex modulation formats [Reference Pärssinen, Alouini, Berg, Kuerner, Kyösti, Leinonen, Matinmikko-Blue, McCune, Pfeiffer and Wambacq2]. Due to regulations, such large bandwidths cannot be allocated to the well-known but already occupied bands below 100 GHz [Reference Rajatheva, Atzeni, Björnson, Bourdoux, Buzzi, Doré, Erkucuk, Fuentes, Guan, Hu, Huang, Hulkkonen, Jornet, Katz, Nilsson, Panayirci, Rabie, Rajapaksha, Salehi, Sarieddeen, vensson, Tervo, Tolli, Wu and Xu4]. One way to address the limited available bandwidth is to move toward terahertz (THz) frequencies. A promising band for future communication standards is the WR 3.4 band between 220 and 330 GHz [Reference Petrov, Kurner and Hosako5–Reference Kürner7]. Low atmospheric attenuation is observed in this frequency range, and a large unoccupied bandwidth is available.
In order to develop systems at these high frequencies, a suitable semiconductor technology for the design and production of the monolithic microwave integrated circuits (MMICs) is needed. Today’s available complementary metal oxide semiconductor (CMOS) technologies are not mature enough to operate at 300 GHz [Reference Pärssinen, Alouini, Berg, Kuerner, Kyösti, Leinonen, Matinmikko-Blue, McCune, Pfeiffer and Wambacq2, Reference Wakayama8]. Therefore, the technology of choice is a III–V compound semiconductor-based technology. Even though these technologies offer simultaneously high gain, output power, and large bandwidth at sub-THz and THz frequencies, they lack transistor integration density and therefore are usually not suited for mixed-signal baseband processing circuits. Another drawback is that differential circuits are not common, in the technology used here, due to process variations, which do not allow sufficient differential operation. Therefore, single-ended topologies are used. This can strongly affect the overall system performance when working with high bandwidths at THz frequencies, due to interference, which can fall into the band of interest as the bandwidth increases. Especially spurs and local oscillator (LO) based signals have to be considered [Reference Wrana, Haussmann, Schoch, John, Tessmann and Kallfass9]. A concept to deal with this issue is to use a superheterodyne communication system, which has already been introduced in [Reference Dan, Ducournau, Hisatake, Szriftgiser, Braun and Kallfass6, Reference Dan, Grötsch, John, Wagner, Tessmann and Kallfass10]. This concept allows to separate the LO signal from the intermediate frequency (IF) signal by a large frequency offset. This way, higher LO harmonics will be outside of the band of interest and therefore will not cause distortion. The concept of a superheterodyne system allows to combine III–V-based technologies and silicon (Si)-based technologies. In a hetero integrated system, the Si-based technology is used for the baseband signal processing and for the signal conversion into a moderately high-frequency band well below 100 GHz, which allows for differential circuit topologies and therefore a suppression of the unwanted LO signals. For frequency conversion up to the sub-THz and THz frequency range, III–V-based technologies can be used. This paper introduces and focuses on the superheterodyne front-end chip set consisting of the transmitter (Tx) and receiver (Rx), which can be used in a combined communication system.
35 nm mHEMT MMIC technology for the front-end design
The front-ends presented here are produced in a 35 nm indium gallium arsenide (InGaAs) metamorphic high electron mobility transistor (mHEMT) technology provided by the Fraunhofer Institute for Applied Solid State Physics (IAF) [Reference Leuther, Tessmann, Massler, Losch, Schlechtweg, Mikulla and Ambacher11]. The transistors achieve a transit frequency ( $f_{\mathrm{t}}$) and maximum frequency of oscillation (
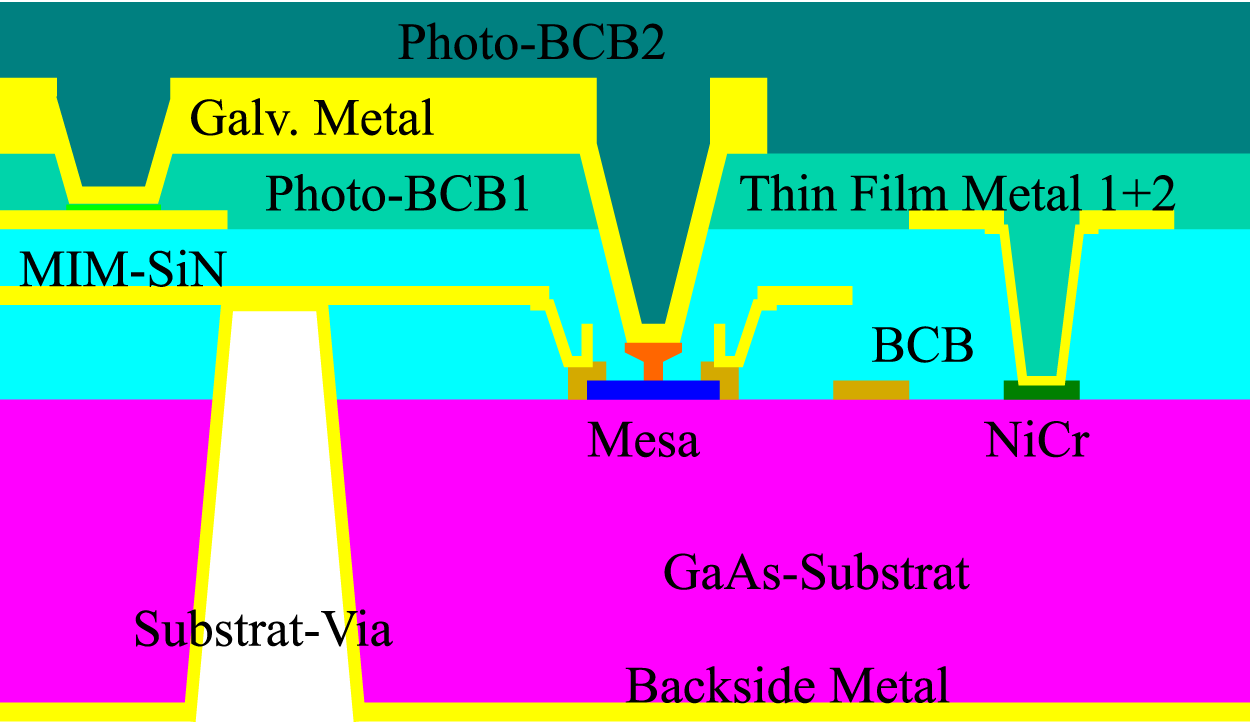
 $f_\mathrm{max}$) of > 500 and > 1000 GHz, which allow the design of circuits with high gain and output power, even at THz frequencies. The back-end-of-line (BEOL) and the technology’s layer stack are shown in Figure 1. The technology provides a resistor layer made of nickel chromium (NiCr) with a nominal sheet resistance of 50
 $\Omega/\square$. For the design of capacitors, a Si nitride (SiN) layer is used as a dielectric. The direct current (DC), signal, and interconnection routing can be done using the three available metal layers, which can be used to build a thin-film microstrip-line (TFMSL) topology with different characteristic impedance values.
35 nm InGaAs mHEMT technology BEOL layer stack.

Design of the superheterodyne front-end chip sets
The superheterodyne front-ends presented in this paper consist of three basic operational building blocks. The first is the generation of the required LO signal, the second is the frequency conversion, and the third is the amplification. This can be seen in Figure 2, where the basic block diagrams of the Tx and Rx are shown. For LO generation, an LO chain including a frequency doubler (X2) and a buffer amplifier (Buffer) is used, which allows the front-end to operate with LO frequencies from 100 to 120 GHz. The LO signal is generated off-chip. The Tx and Rx both use an identical resistive mixer, which is chosen due to its broadband behavior and high linearity. For radio frequency (RF) signal amplification, a seven-stage amplifier is used in the Tx and Rx. For both front-end MMICs, the amplifiers are similar in their structure and topology, which allows for a symmetric MMIC design. The symmetry of the Tx and Rx is beneficial for later chip integration into split-block packages, due to identical chip size and pad configuration. The chip micrographs are shown in Figure 3.
A basic block diagram of the Tx (a) and Rx (b) presented here.

A chip micrograph of the Tx (a) and RX (b) presented here, each with a chip size of 2.75 $\times$1
 $\rm{mm^{2}}$.

Design of the LO chain using harmonic load-pull simulations
The LO chain is optimized for a frequency range from 100 to 120 GHz, resulting in an on-chip LO frequency range from 200 to 240 GHz. The X2 consists of a single-ended common-source (CS) mHEMT operated between class-B and -AB mode, for even-order frequency generation, while suppressing odd-order frequency products [Reference Klymyshyn and Zhen13]. The suppression of the third harmonic is of crucial concern in the X2 design process, because this frequency product can directly fall into the band of interest. Therefore, the X2 is designed for high output power of the second harmonic, while suppressing the fundamental and third-harmonic frequencies. Therefore, the operation point is set toward a class-AB mode, which results in a conduction angle larger than 180 $^{\circ}$, which decreases the power of the second harmonic but simultaneously leads to stronger suppression of the odd-order harmonics. Further optimization can be achieved by designing the output-matching networks using harmonic load-pull simulations. This way, the optimum load for the fundamental, second and third harmonics can be found in order to increase the available output power and simultaneously improve the suppression of unwanted frequency components [Reference Thomas and Branner14]. For the second harmonic, the optimum load
 $R_{\mathrm{L,2}}$ is defined by eq. 1:
 \begin{equation}
R_{\mathrm{L,2}}=\frac{V_{\mathrm{d,max}}-V_{\mathrm{d,min}}}{2I_\mathrm{2}}
\end{equation}
The values  $V_{\mathrm{d,max}}-V_{\mathrm{d,min}}$ and
 $I_{\mathrm{2}}$ describe the maximum voltage swing and the current of the second harmonic [Reference Maas12]. The terminations of the fundamental and third harmonic in the simulations were set to either an open- or a short-circuit configuration. The simulation predicts an optimum load impedance of
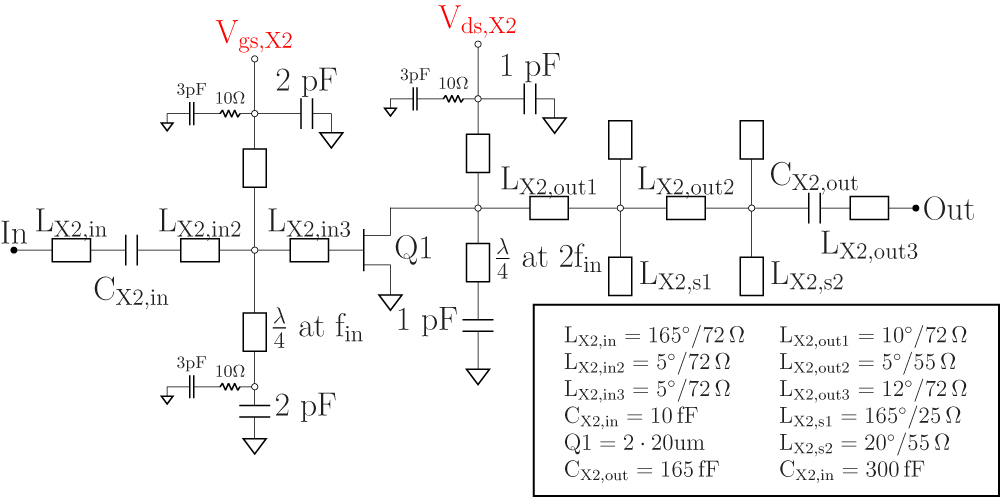
 $Z_{\mathrm L,2}=\left[17+j11\right]\;\Omega$ under the condition of a short-circuit termination for the fundamental and an open-circuit termination of the third harmonic. This configuration results in an increase in conversion gain (CG) by 2 dB compared to other configurations. At the same time, this configuration provides optimum suppression of the fundamental and third harmonic, even though the impact on the suppression is minor compared to the CG improvement. The X2 schematic is shown in Figure 4. The output matching network (OMN) is designed to transform a 50
 $\Omega$ load into the optimum harmonic load impedance. In this way, a simulated CG of
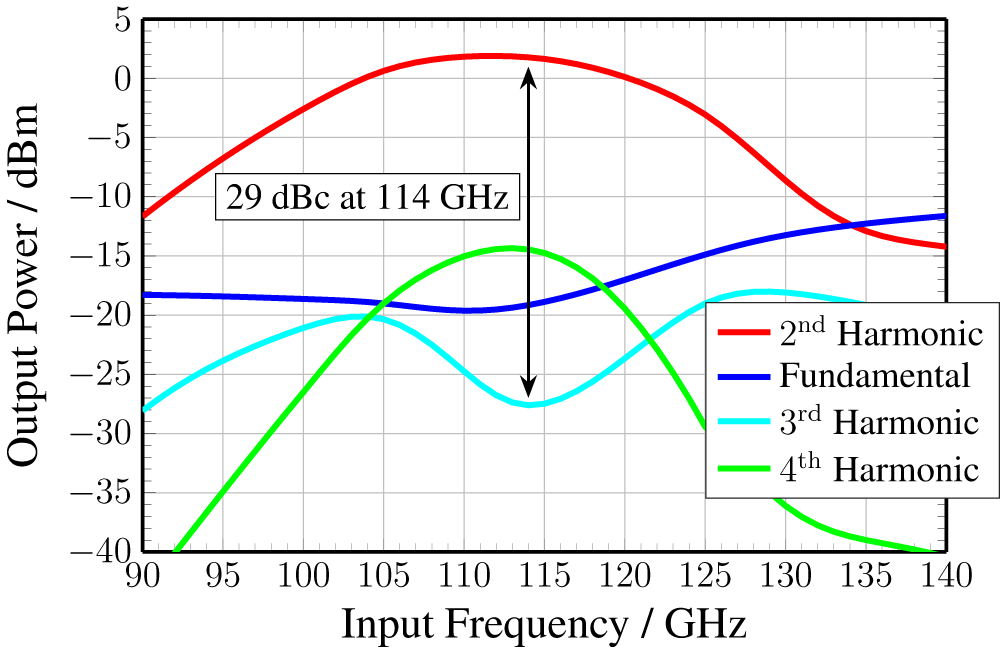
 $-$3.5 dB for the standalone X2 is achieved. The simulated output power is shown in Figure 5. At the desired center frequency around 110 GHz, an output power of 3 dBm for the second harmonic and a suppression of 29 dBc between the second and third harmonics is simulated.
Schematic of the standalone X2 with optimized output matching using harmonic load-pull simulations.

Simulation results of the standalone X2 with optimized output matching using harmonic load-pull simulation, with an input power of 4 dBm.

The buffer amplifier consists of a two-stage amplifier, each stage with two parallel two-finger mHEMTs with a gate width of  $\rm{2\times20}$ µm and
 $\mathrm{2\times22}$ µm. Due to the bandpass transfer characteristic from 200 to 240 GHz, the buffer is additionally designed to further suppress harmonics of the LO signal. Using this design, an output power of the second harmonic exceeding 3 dBm and a suppression of the third harmonic greater than 50 dBc is achieved in measurements, which is comparable with other designs [Reference Groetsch, Wagner, Leuther, Meier and Kallfass15, Reference Turkmen, Aksoyak, Debski, Winkler and Ulusoy16].
Single-ended resistive mixer design
The up- and down-conversion of the signals is done using a fundamental resistive mixer. Therefore, a CS mHEMT is biased close to its threshold region with an ideally drain voltage of zero. In the design presented here, the drain of the mHEMT is floating. The mixer is optimized for an IF from 60 to 90 GHz, and an RF range from 250 to 330 GHz. Accordingly, the LO can be swept between 200 and 240 GHz, allowing the allocation of the IF signal to different RF ranges and therefore enabling frequency-division duplex (FDD) communication concepts. A simulated CG of  $-$10 dB can be achieved at an LO saturation of 0–1 dBm. The mixer is matched at all ports to 50
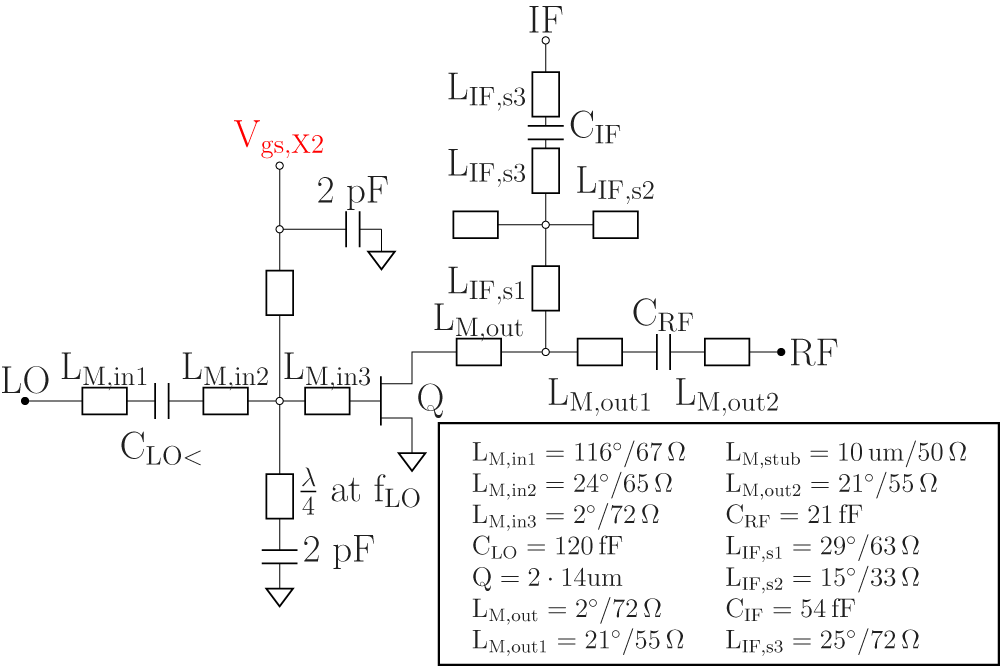
 ${\Omega}$ for minimum reflection. The schematic of the resistive mixer is shown in Figure 6. The LO and IF matching is achieved using a matching network including a stub matching according to the frequency range. The RF side is matched using
 $C_{\mathrm{X2,out}}$ and a short inductive TFMSL. In this superheterodyne concept, a single-ended mixer concept without additional image rejection is sufficient. Due to the high IF and LO frequencies used, an image frequency around 140 GHz is generated, which is filtered by the inherent cutoff of the waveguide in the split-block package.
Schematic of the resistive mixer including the LO, IF, and RF matching networks.

Design of the multi-purpose amplifier stages
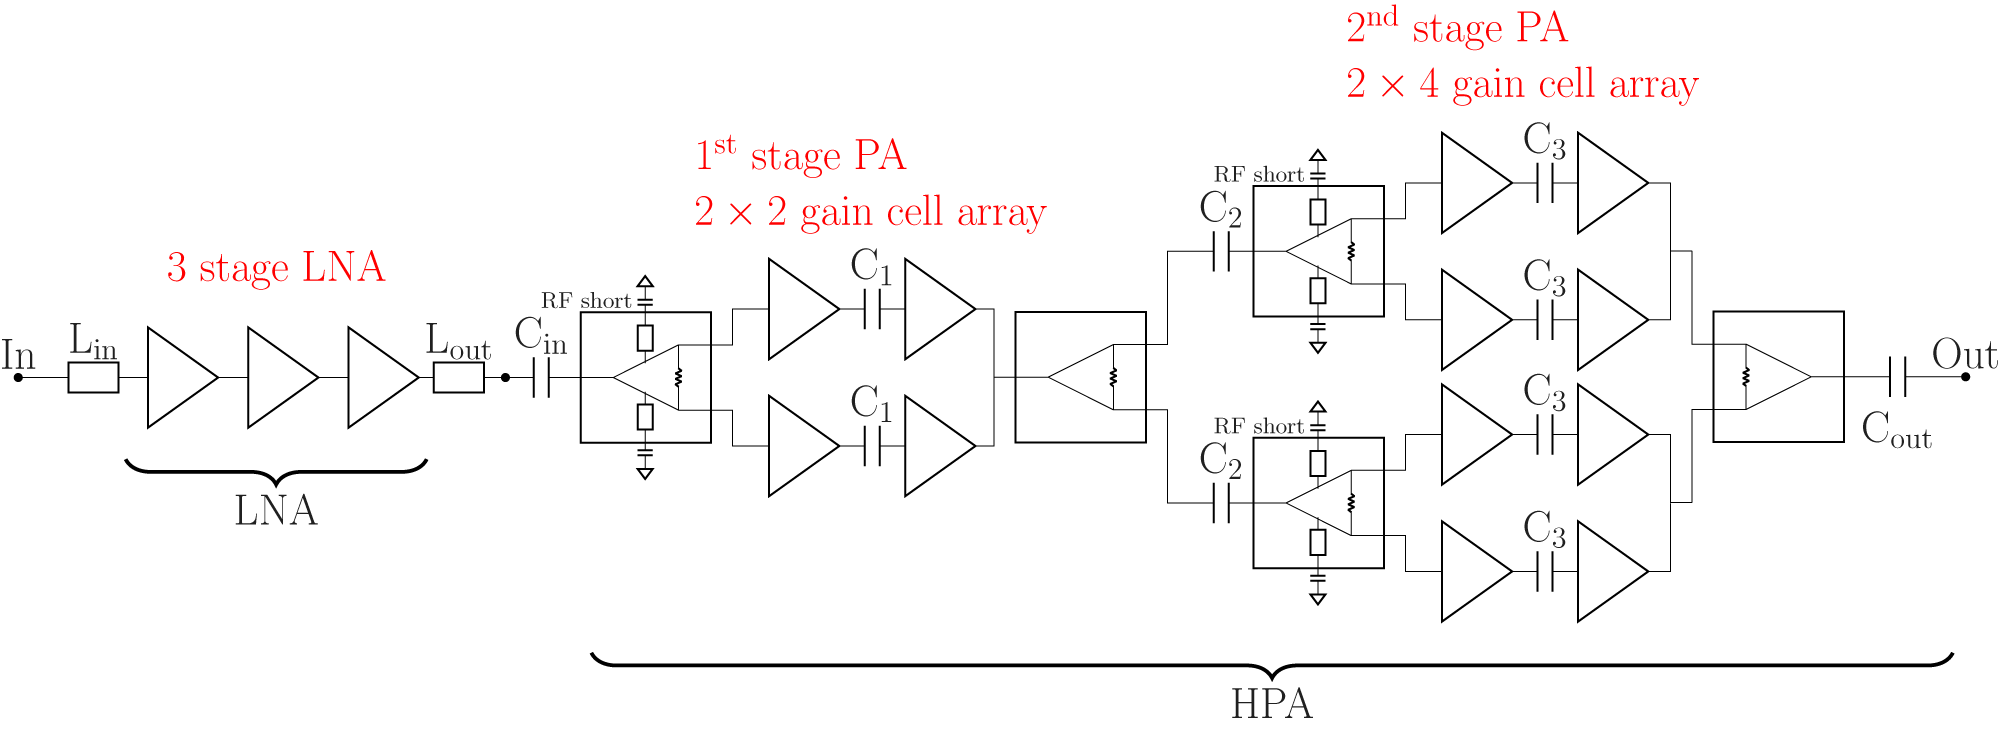
Both front-ends, Tx and Rx, use the same amplification stage, which is based on the amplifier presented in [Reference Schoch, Tessmann, Leuther, Wagner and Kallfass17]. Usually, two different amplifiers are used for the Tx and Rx, in order to achieve an optimum noise figure (NF) for the Rx and high output power for the Tx. In the design presented here, a combined amplifier stage can be used due to its optimized design, allowing simultaneous use in the Tx and Rx. A schematic block diagram of the amplifier is shown in Figure 7. The first stage is a low-noise amplifier (LNA) that provides a simulated gain of 15 dB, while having a simulated NF of 7 dB, which allows for sufficient Rx operation. The second stage consists of a high-power amplifier (PA) providing a simulated saturated output power of  $\rm{P_{sat}}$ > 10 dBm with a gain of up to 20 dB. This combination of amplifier functionality allows for simultaneous use of the amplifier in the Rx and Tx. As seen in Figure 7, the LNA uses three cascaded CS amplifiers with inductive source degeneration in order to improve simultaneous noise and gain matching. The inductive degeneration is implemented using shorted TFMSL-stubs. Even though the NF of the PA is higher compared to that of the LNA, the overall amplifier is still sufficient for use as an LNA for the Rx. This is due to the gain of the first-stage LNA, which compensates for the noise contribution of the cascaded second stage according to the Friis equation. The gain of the PA is used to increase the overall CG of the Rx, which increases the possible transmission distance.
Block diagram of the LNA (left) and the HPA (right) used as a multi-purpose amplifier in the Rx and Tx.

To provide sufficient output power for the Tx, the PA consists of four cascaded stages. As seen in Figure 7, the driving amplifier consists of two cascaded stages with two parallel CS mHEMTs each, while the power stage consists of two stages with four parallel CS mHEMTs. In the Tx design, the LNA is used as an additional driving stage to compensate for the mixer conversion loss. This way, the PA can be operated in the range of high output power while providing good linearity.
Measurement results of the front-end chip set
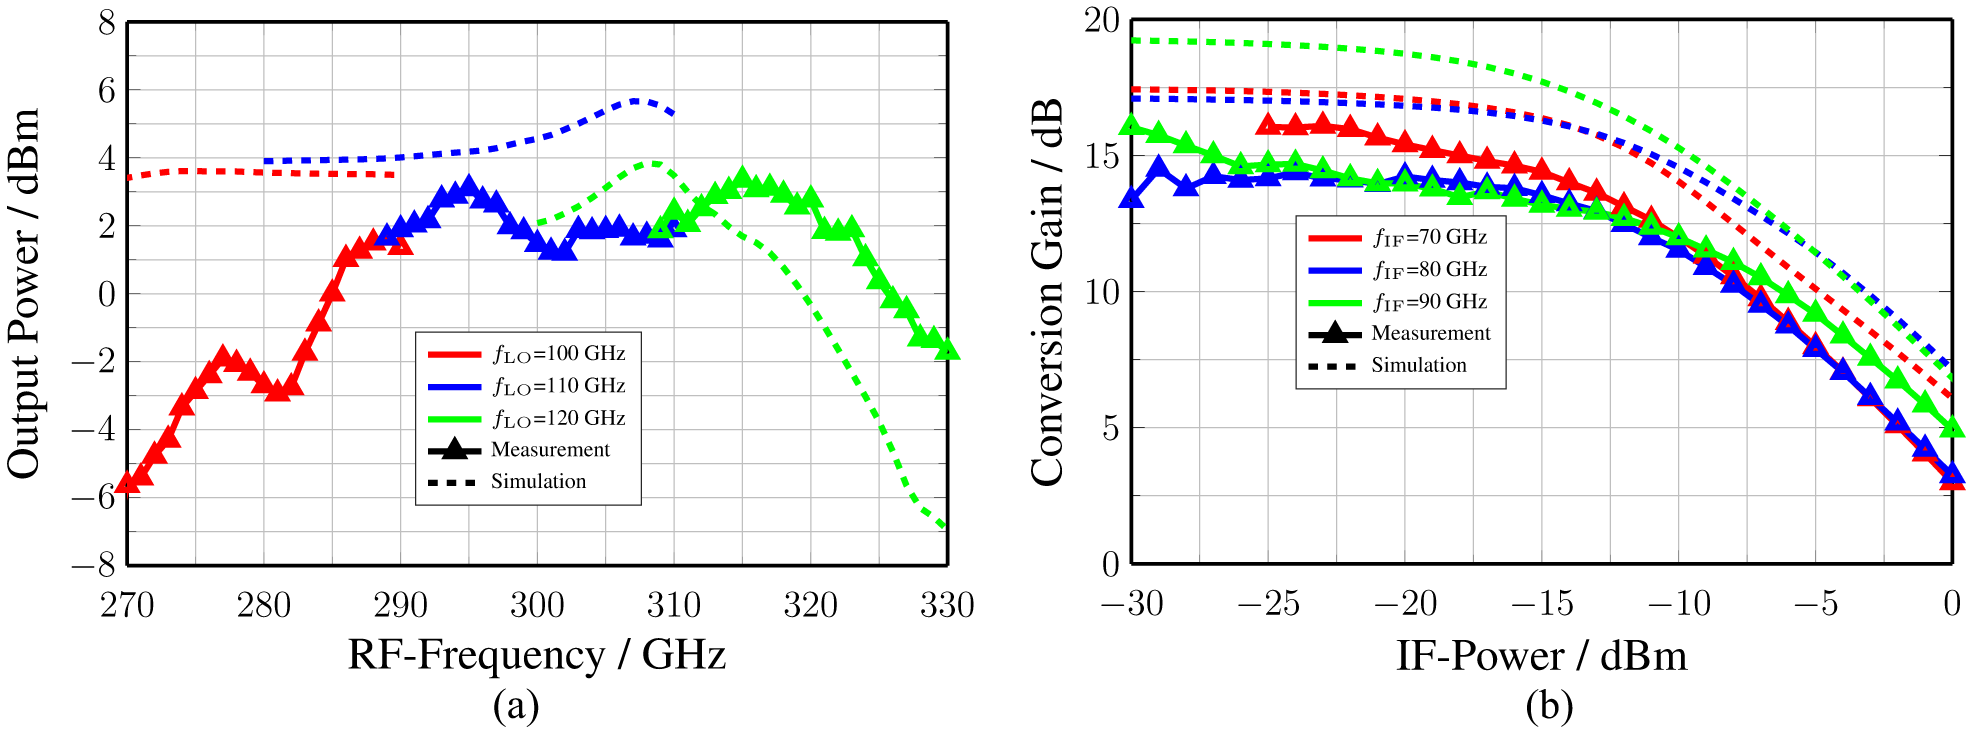
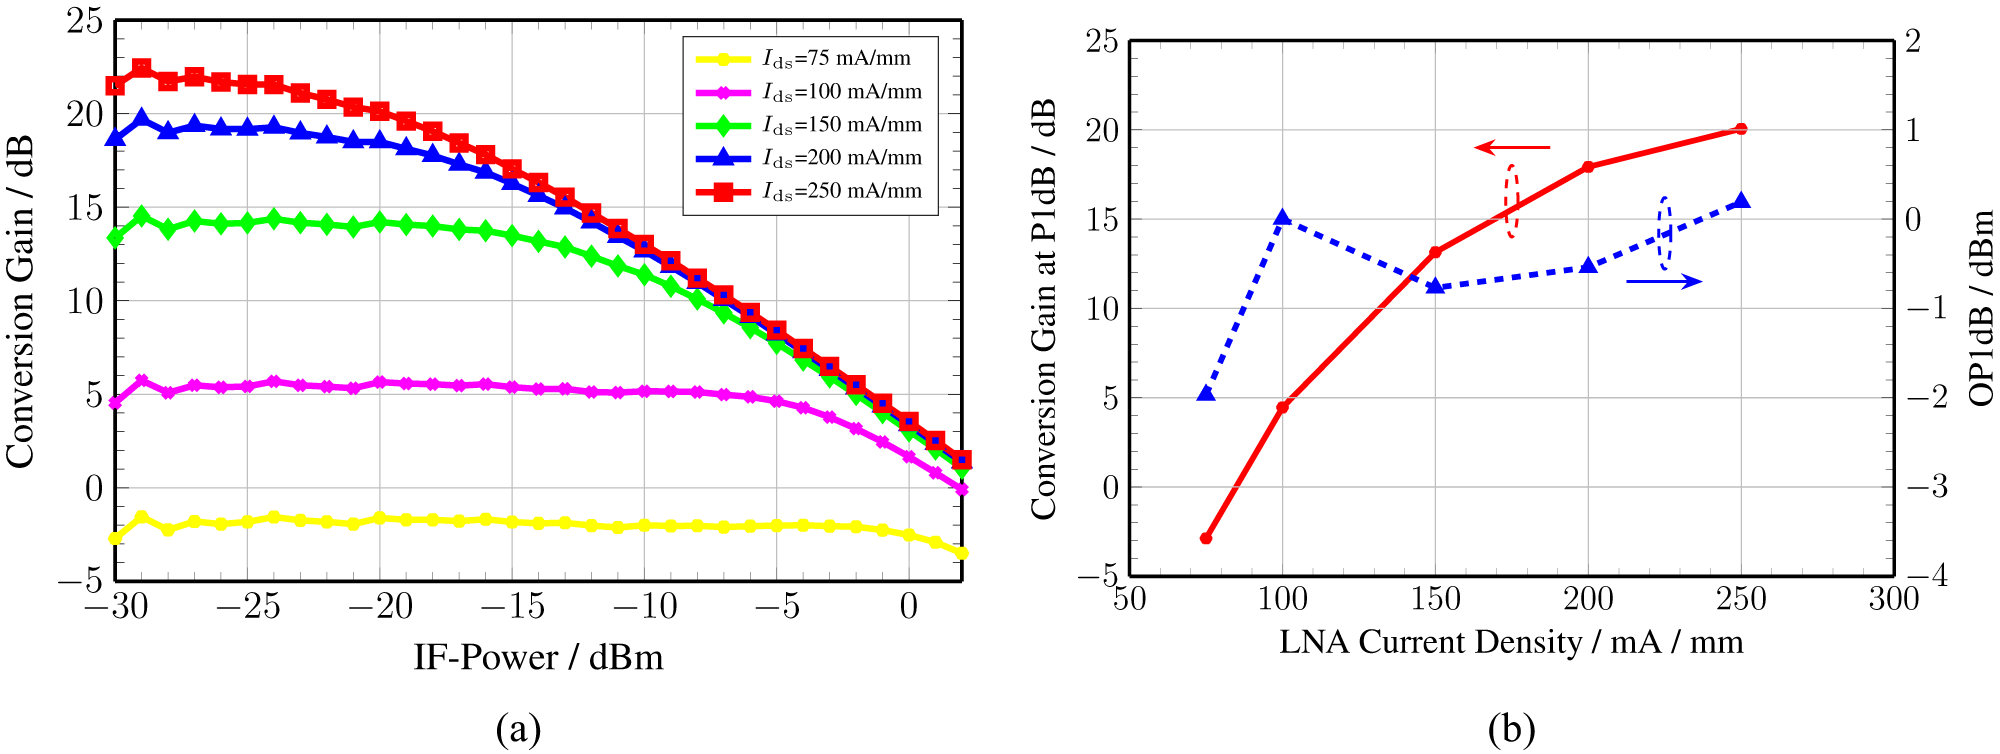
The measurements were performed using spectrum analyzers; therefore, only scalar measurements could be performed. The Rx was measured using an Anritsu spectrum analyzer (MS2760A). The Tx was measured using a Keysight spectrum analyzer PXA N9030A in combination with a VDI SAX1001 mixer. The LO is generated using a signal generator in combination with an external frequency multiplier. In Figure 8, the frequency response (a) and a power sweep (b) for the Tx are shown. The measurements show an overall RF bandwidth of more than 40 GHz from 285 and 325 GHz. As can be seen, the measurements agree well with the simulations despite a frequency shift of roughly 10 GHz toward higher frequencies. A output power of 4 dBm can also be reproduced in simulations. For lower LO frequencies, the output power drops, which is most likely due to a frequency shift in the LO chain and the buffer amplifier. The shift in the LO chain causes the LO power, and therefore the CG of the mixer, to drop for lower LO frequencies. In Figure 8(b), the Tx CG versus the IF power for several IF frequencies is shown. An overall linear CG of up to 15 dB is achieved with an output-referred 1 dB compression point (OP1dB) of 0 dBm. In Figure 9(a), the CG of the Tx versus IF power for different operation points (OPs) of the LNA is shown. As seen there, depending on the LNA OP, the CG can be adjusted. This way, the LNA can be used as a variable gain amplifier (VGA) in the Tx. In Figure 9(b), the CG in compression and the corresponding OP1dB are shown. As seen, the CG can be adjusted between 5 and 20 dB depending on the LNA’s OP, with only minor changes in the OP1dB. The previous and following measurements were performed with the LNA biased at an OP of 150 mA/mm.
Simulated (dashed) and measured (solid) Tx CG plotted versus RF frequency for different LO frequencies with  ${P_{\mathrm{LO}}}$ = 4 dBm and
 ${P_{\mathrm{RF}}}$ =
 $-$35 dBm (a) and the CG plotted versus IF frequency for different RF powers with
 ${P_{\mathrm{LO}}}$ = 4 dBm and
 ${f_{\mathrm{LO}}}$ = 110 GHz (b).

Simulated (dashed) and measured (solid) Tx CG plotted versus IF power for different current densities in the LNA stage with  ${P_{\mathrm{LO}}}$ = 4 dBm,
 ${f_{\mathrm{IF}}}$ = 80 GHz and
 ${f_{\mathrm{LO}}}$ = 110 GHz (a) and the achieved CG at compression and OP1dB plotted versus the current density in the LNA stage with
 ${P_{\mathrm{LO}}}$ = 4 dBm,
 ${f_{\mathrm{IF}}}$ = 80 GHz and
 ${f_{\mathrm{LO}}}$ = 110 GHz (b).

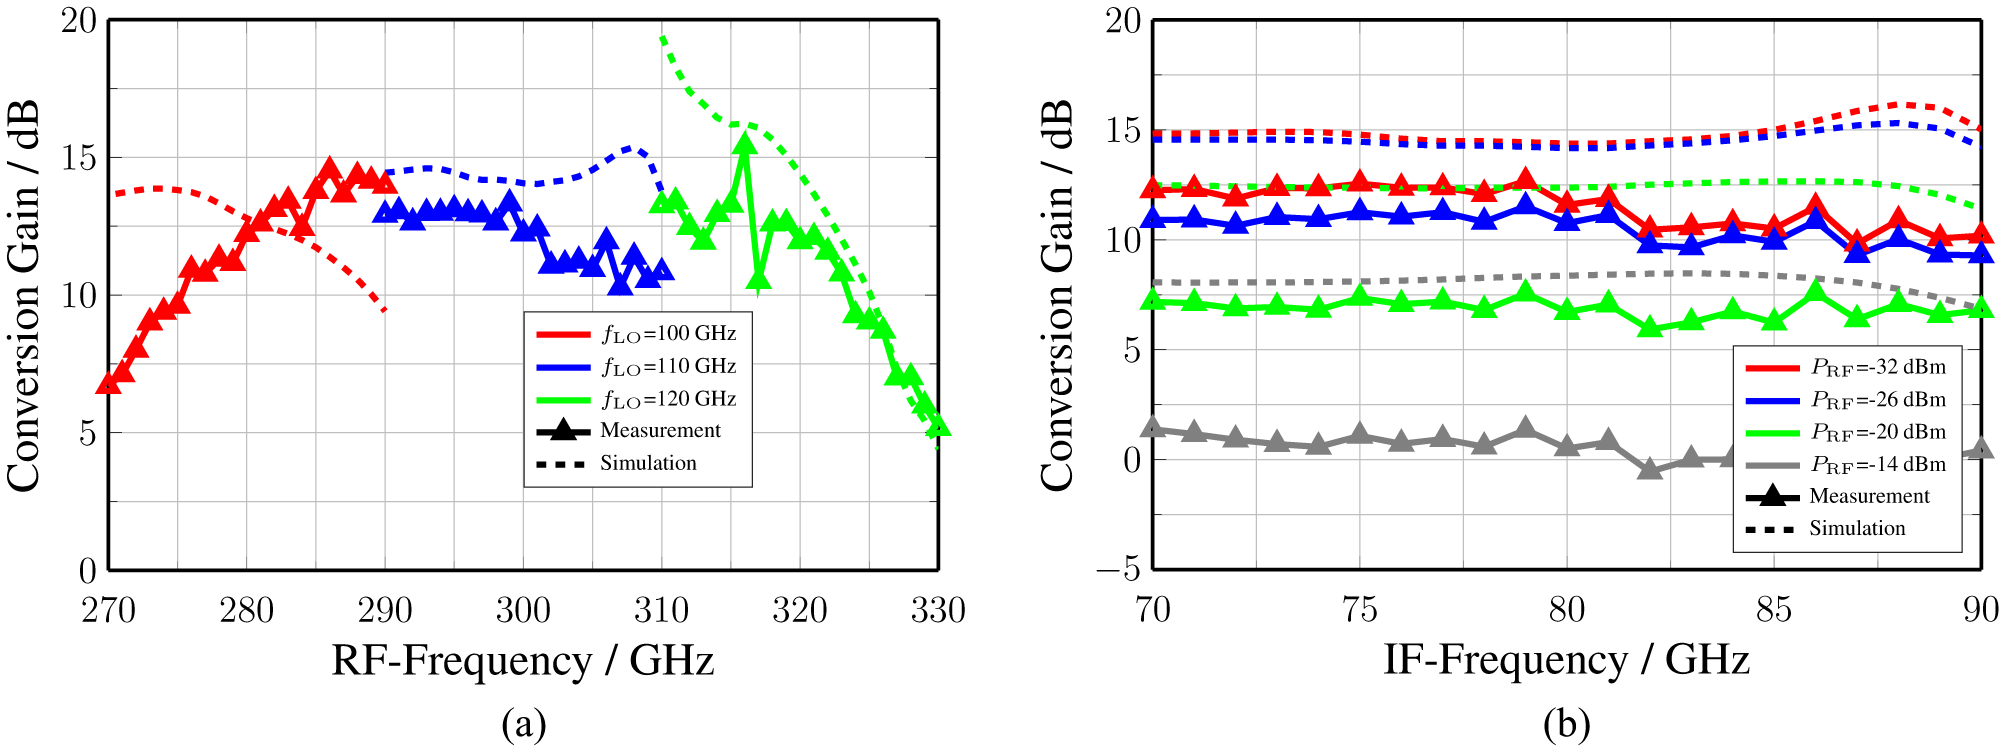
In Figure 10(a), the Rx CG versus RF frequency for different LO frequencies is shown. A median CG of 12 dB is achieved in the measurements. For the lower LO range, a larger deviation between simulation and measurements can be observed, which can again be explained by a frequency shift in the LO chain. The Rx achieves a higher bandwidth of roughly 45 GHz, from 278 to 323 GHz for the measurement. The peak at a frequency of 315 GHz is an artifact of the measurement setup. The linearity of the Rx is shown in Figure 10, where the Rx CG versus IF frequency is shown for different RF powers using an LO frequency of 110 GHz and an LO power of 4 dBm to drive the LO chain. As seen there, the Rx starts to compress for RF powers above  $-$26 dBm. The compression behavior of the Rx is most likely a combination of the linearity of the mixer and the amplifier, due to the fact that the amplifier has an OP1dB of 0 dBm, which corresponds to the input compression level of the mixer. Both the Tx and Rx have an LO power saturation at approximately
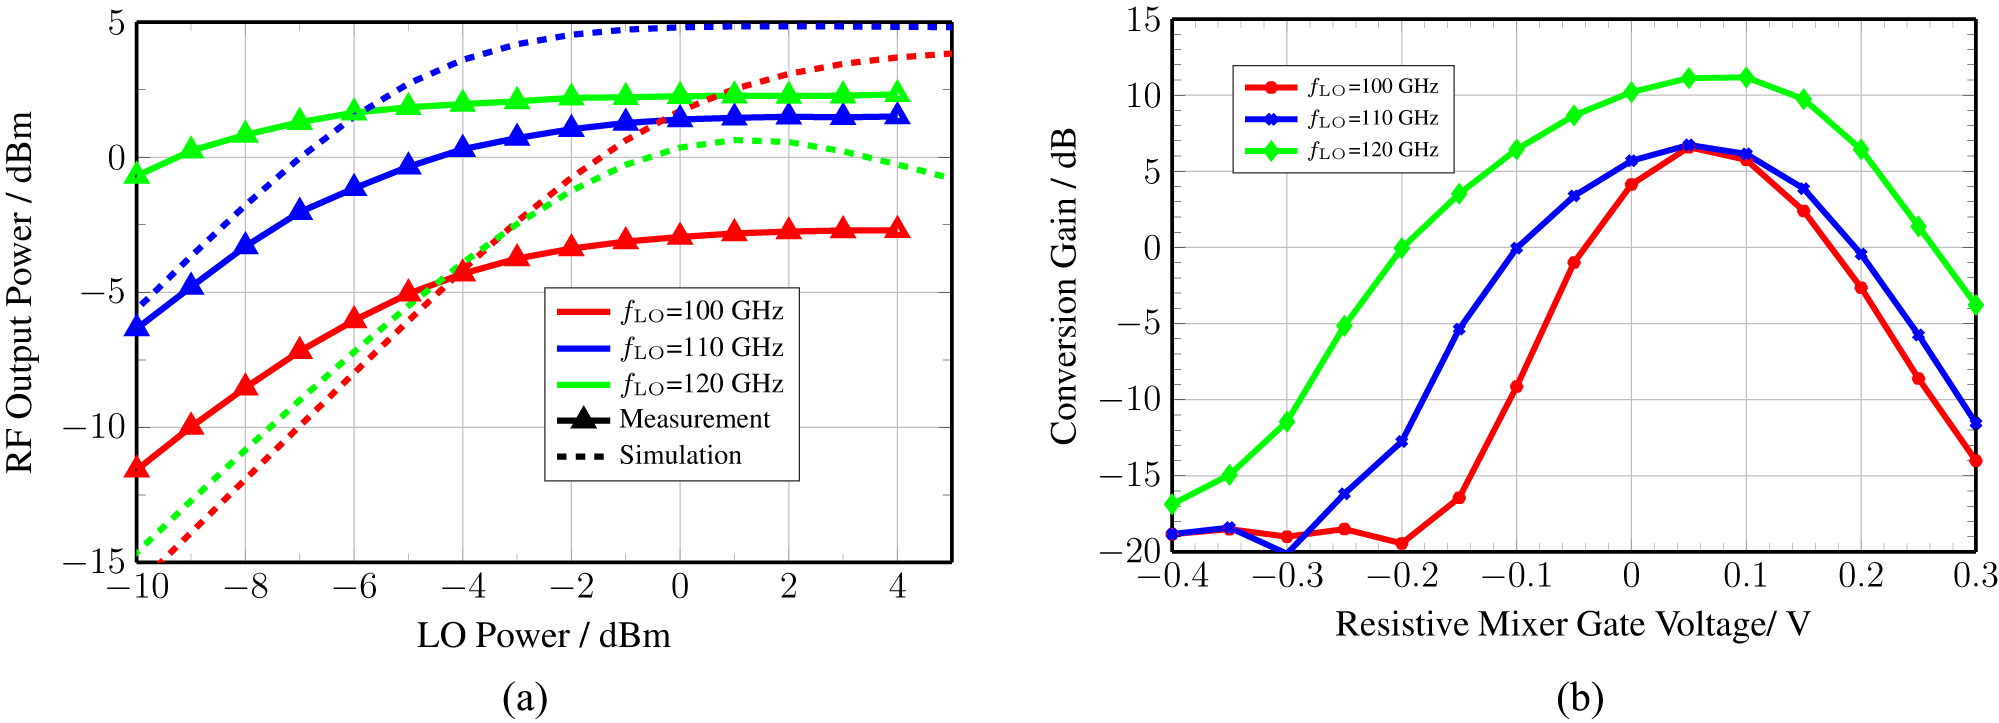
 $-$2 dBm, as shown in Figure 11(a). The previously shown measurements were performed using an LO power of 4 dBm in order to compensate for the power drop at lower LO frequencies, due to the frequency shift of the LO chain. In Figure 11(b), the Rx CG versus the resistive mixer gate voltage is shown for different LO frequencies. As seen there, the optimum OP of the mixer is independent of the LO frequency and insensitive over a voltage range of 0.1 V. Due to the symmetric design of the Tx and Rx, this result is also applicable for the Tx; vice versa, the LNA in the Rx can also be used as a VGA, even though this can impact the NF of the Rx. The simulated NF of the Rx is 7 dB. Rx noise measurements were performed using an Rx front-end split-block waveguide package; the measurements show an NF of 8 dB.
Simulated (dashed) and measured (solid) Rx CG plotted versus RF frequency for different LO frequencies with  ${P_{\mathrm{LO}}}$ = 4 dBm and
 ${P_{\mathrm{RF}}}$ =
 $-$35 dBm (a) and the CG plotted versus IF frequency for different RF powers with
 ${P_{\mathrm{LO}}}$ = 4 dBm and
 ${f_{\mathrm{LO}}}$ = 110 GHz (b).

Simulated (dashed) and measured (solid) Tx RF output power plotted versus LO power for different LO frequencies, an IF frequency of 80 GHz and an IF power of  $P_{\mathrm{IF}}$ =
 $-$10 dBm (a) and the Rx CG plotted versus the gate voltage of the resistive mixer for different LO frequencies with an LO power of
 ${P_{\mathrm{LO}}}$ =
 $-$5 dBm, an RF power of
 $P_{\mathrm{RF}}$ =
 $-$35 dBm and an If frequency of
 $f_{\mathrm{IF}}$ = 80 GHz (b).

Comparison to the state of the art
In Table 1, a comparison with the recently published results of THz front-end chip sets operating at RF frequencies within the WR 3.4 waveguide band is presented. For a meaningful state-of-the-art (SOTA) comparison, front-ends produced in four different semiconductor technologies are presented. CMOS technologies can hardly compete with today’s III–V-based technologies at THz frequencies. CMOS is still considered in the SOTA comparison in order to give a comprehensive comparison. In this section, only chip sets including Tx and Rx are considered. Due to the lack of publications covering superheterodyne chip sets operating at THz frequencies, Zero-IF systems are also included in the SOTA. For the comparison, several figure-of-merits (FoMs) are used. For both Tx and Rx, the RF and IF bandwidth, CG, as well as the overall DC power consumption are taken into account. A key FoM for the Tx is the OP1dB, while for the Rx the NF is one of the most important FoMs. As seen in Table 1, the here-presented chip set, operating at an RF frequency range from 285 to 325 GHz shows, in terms of absolute and relative bandwidth, over 40 GHz and > 14 %, one of the largest RF bandwidths in the SOTA comparison. For completeness, the IF bandwidth is also shown in Table 1, even though a fair comparison is difficult due to the differences in the system concept. It can be seen that, compared to other superheterodyne chip sets in [Reference Dan, Grötsch, John, Wagner, Tessmann and Kallfass10], the RF and IF bandwidths are increased. In terms of CG, InGaAs front-ends achieve values between 0 and 20 dB, which is also the case for the front-ends presented here. The Rx CG of the SiGe- and InP-based front-ends reaches values up to 30 dB, which is due to the use of baseband amplification and active mixers. With up to 22 dB of CG, the Tx presented here can compete with the InP-based designs. Due to the amplifier topology used, the CG of the Tx can be adjusted between 5 and 22 dB while providing the same OP1dB. For the Rx, the CG could be adjusted as well, which is not considered here due to the influence on the NF. In terms of Rx NF, the Si-based front-ends cannot compete with III–V-based chip sets due to technology limitations. The Rx presented here achieves a measured NF of 8 dB around 300 GHz. This is the lowest reported NF for an Rx operating at 300 GHz. In terms of linear output power represented by the OP1dB, the Tx presented here is in the same range as reported in other publications, even though there are InP designs, which reach values up to 8.9 dBm. Also, SiGe-based designs can already reach values over 0 dBm. The limited output power in this work is due to the focus on CG and efficiency. This can be seen especially in the DC power consumption of the chip sets. The front-end chip set presented here outperforms with a DC power consumption of 295 mW and an efficiency of 0.34 %, the other presented chip sets, which is due to the efficient high-gain amplifier and the single-ended design concept. For a fair comparison with Zero-IF systems, the needed baseband-to-IF conversion for superheterodyne systems has to be considered. Therefore, reported Si-based Zero-IF to E-band conversion circuits given in [Reference Sheinman, Carmon, Ben-Yishay, Katz, Mazor, Levinger, Elad, Golberg and Bruetbart25, Reference Sheinman, Carmon, Ben-Yishay, Katz, Mazor, Levinger, Elad, Golberg and Bruetbart26] are considered and added to Table 1 as a necessary component for the superheterodyne concepts. The Si-based frequency converters allow for Zero-IF operation, while consuming 80–110 mW of DC power. This shows that even with additional baseband circuitry, the here-presented chip set can compete with and even surpass the SOTA. An additional comparison can be done with the chip set presented in [Reference Dan, Grötsch, John, Wagner, Tessmann and Kallfass10], which is designed in the same technology and aims for identical use cases and frequency ranges. The most pronounced differences are the transmission line topology used, which is TFMSL in this work and coplanar waveguide (CPW) in [Reference Dan, Grötsch, John, Wagner, Tessmann and Kallfass10] and the LO-chain multiplication factor. As seen in Table 1, the here-presented chip set outperforms the one published in [Reference Dan, Grötsch, John, Wagner, Tessmann and Kallfass10] in all stated FoMs.
Comparison of published state-of-the-art THz front-ends

*Simulation results, **from graphs, ***necessary baseband conversion power consumption approximated to be 100 mW.
Considering the performance parameters of the front-end chip set presented here, it can allow for data transmission with data rates of several tens up to hundreds of Gbps. This is possible if the full IF bandwidth of > 20 GHz and higher-order modulation formats, like 64-QAM, are used, resulting in a data rate of 120 Gbps in a simplex system. For a 64-QAM signal the Tx should be operated at least 10 dB in back-off for linearity, resulting in an output power of  $-$10 dBm. For a bit error rate (BER) of <
 $10^{-3}$, a signal-to-noise ratio (SNR) of > 16 dB is required. Considering thermal noise and the NF of the Rx of 8 dB at 300 GHz and using horn antennas with antenna gain of > 20 dBi allows for a maximum distance of roughly 10 m. Considering highly directive antenna systems like these shown in [Reference Dan, Grötsch, John, Wagner, Tessmann and Kallfass10] with a gain of > 50 dBi allows for a maximum distance of 2 km. Using an FDD system and polarization multiplexing could further increase the data rate of the wireless communication system.
Conclusion
In this paper, a superheterodyne WR 3.4-band front-end chip set produced in a 35 nm mHEMT technology is shown. Using harmonic load-pull simulations, the design of a frequency multiplier can be improved by 2 dB of CG for the second harmonic while simultaneously improving the suppression of unwanted harmonics. For the amplification, a multi-purpose amplifier is used, which allows the same amplifier to be used for both the Tx and Rx. This way, an RF bandwidth of over 40 GHz with an OP1dB of 0 dBm and an adjustable CG between 5 and 20 dB for the Tx, and a CG of over 12 dB over 40 GHz and an NF of 8 dB for the Rx are achieved. With these values, the here-presented superheterodyne front-end chip set can compete with the SOTA and even set new benchmarks in terms of NF and efficiency.
Funding statement
This work was supported by the European Union under the project TIMES under grant number 101096307. Further, this research was supported in part by the German Federal Ministry of Research, Technology and Space (BMFTR) within the project Open6GHub under grant number 16KISK019.
Competing interests
The author(s) declare none.

Lukas Julian Gebert received his M.Sc. degree in Electrical Engineering and Information Technology from the University of Stuttgart, Germany, in 2022. Since 2022, he has been a research and teaching assistant at the Institute of Robust Power Semiconductor Systems, University of Stuttgart, Germany, in the area of millimeter and sub-millimeter wave monolithic integrated circuits for broadband communication, with the main focus on ultra-broadband transceiver design in InGaAs. As well as the packaging of transceiver front-ends.

Benjamin Schoch received his M.Sc. degree in power and microelectronics in 2016 from Reutlingen University, Germany. Since 2016, he has been a research and teaching assistant at the Institute of Robust Power Semiconductor Systems, University of Stuttgart, Germany, in the area of millimeter and sub-millimeter wave monolithic integrated circuits for broadband communication and radar imaging, with a main research focus on power amplifiers.

Thomas Ufschlag received his M.Sc. degree in Electrical Engineering and Information Technology from the University of Stuttgart, Germany, in 2022. Since 2022, he has been a research and teaching assistant at the Institute of Robust Power Semiconductor Systems, University of Stuttgart, Germany. He is involved in the development of power amplifiers and analog linearization techniques in InGaAs and GaN.

Dominik Wrana received his M.Sc. degree in Electrical Engineering from Reutlingen University, Germany, in 2019. Since 2019, he has been with the Institute of Robust Power Semiconductor Systems (ILH), University of Stuttgart, Germany, as a research and teaching assistant. He is involved in the design and characterization of monolithic integrated circuits as well as system-level performance analysis and optimization.

Simon Haussmann received his M.Sc. degree in Electrical Engineering from Reutlingen University, Germany, in 2019.Since 2020, he has been with the Institute of Robust Power Semiconductor Systems (ILH), University of Stuttgart, Germany, as a research and teaching assistant. He is involved in the development and installation of millimeter and sub-millimeter wireless communication systems as well as the operation and measurements.

Sebastien Chartier received the master’s degree in microwave engineering from the University of Lille, Lille, France, in 2003, and the Dr.-Ing. degree in electrical engineering from the University of Ulm, Germany, in 2009. He began his career in 2004 at the Institute of Electron Devices and Circuits, University of Ulm. In 2007, he joined the Fraunhofer Institute for Applied Solid-State Physics (IAF), Freiburg, Germany. From 2009 to 2017, he worked at Airbus Defence and Space GmbH in Ulm, Germany. In 2017, he joined NXP Semiconductors Germany GmbH, Hamburg, Germany, as Sub-System Design Leader. He moved to the Institute of Robust Power Semiconductor Systems (ILH), University of Stuttgart, Germany, in 2019. He returned to the IAF in 2020.

Sandrine Wagner received a B.Sc. in Electronics and Informatics from the University of Mulhouse, France, in 1989. She joined Micronas GmbH in Freiburg, Germany, in 1989, where she was responsible for layout and physical verification of large-scale integrated semi-conductor devices. In 2010, she joined the measurement technology group at Fraunhofer Institute for Applied Solid State Physics (IAF), Freiburg, Germany.

Ingmar Kallfass received the Dipl.-Ing. degree in electrical engineering from the University of Stuttgart, Stuttgart, Germany, in 2000, and the Dr.-Ing. degree in electrical engineering from the University of Ulm, Ulm, Germany, in 2005. In 2001, he worked as a Visiting Researcher with the National University of Ireland, Dublin, Ireland. In 2002, he joined the Department of Electron Devices and Circuits at the University of Ulm as a Teaching and Research Assistant. In 2005, he joined the Fraunhofer Institute for Applied Solid-State Physics. From 2009 to 2012, he was a Professor at the Karlsruhe Institute of Technology, Karlsruhe, Germany. Since 2013, he has held the Chair for Robust Power Semiconductor Systems at the University of Stuttgart.












 Open access

