




No CrossRef data available.
Article contents
Modelling macroparasite aggregation using a nematode-sheep system: the Weibull distribution as an alternative to the Negative Binomial distribution?
Published online by Cambridge University Press: 25 April 2005
Abstract
Macroparasites are almost always aggregated across their host populations, hence the Negative Binomial Distribution (NBD) with its exponent parameter k is widely used for modelling, quantifying or analysing parasite distributions. However, many studies have pointed out some drawbacks in the use of the NBD, with respect to the sensitivity of k to the mean number of parasites per host or the under-representation of the heavily infected hosts in the estimate of k. In this study, we compare the fit of the NBD with 4 other widely used distributions on observed parasitic gastrointestinal nematode distributions in their sheep host populations (11 datasets). Distributions were fitted to observed data using maximum likelihood estimator and the best fits were selected using the Akaike's Information Criterion (AIC). A simulation study was also conducted in order to assess the possible bias in parameter estimations especially in the case of small sample sizes. We found that the NBD is seldom the best fit for gastrointestinal nematode distributions. The Weibull distribution was clearly more appropriate over a very wide range of degrees of aggregation, mainly because it was more flexible in fitting the heavily infected hosts. Moreover, the Weibull distribution estimates are less sensitive to sample size. Thus, when possible, we suggest to carefully check on observed data if the NBD is appropriate before conducting any further analysis on parasite distributions.
Keywords
Information
- Type
- Research Article
- Information
- Copyright
- © 2005 Cambridge University Press
INTRODUCTION
Macroparasites are almost always aggregated across their host population, with a large number of hosts harbouring few parasites and few heavily infected hosts (Pacala & Dobson, 1988; Shaw & Dobson, 1995). The heterogeneity in parasite burdens is a consequence of biological processes and of their interactions: parasites may become aggregated on or in their host due to aggregated spatial distribution of free-living stages (Keymer & Anderson, 1979), differences in susceptibility of hosts or differences in host selection by parasite (Wilson et al. 2002) and environmental and demographic stochasticity (Anderson & Gordon, 1982). In trichostrongylid nematodes, the aggregated distribution among domestic ruminants (Barger, 1985) is usually thought to mainly reflect individual variability of ruminants in the acquisition and expression of the immune response against nematodes (Hoste, Chartier & Le Frileux, 2002). One consequence of aggregated distributions is that the small proportion of hosts in the tail of the parasite distribution is responsible for most parasite transmission and plays an important role in the persistence of the parasite (Anderson & May, 1985; Woolhouse et al. 1997). Moreover, as in macroparasites, host mortality and morbidity tend to be dose-dependent (Poulin, 1998), parasite infections are more harmful for heavily infected individuals and, in sheep, the extent of nematode-induced production loss is roughly proportional to worm burden (Steel, Symons & Jones, 1980). Because production loss and worm burden are positively correlated, the aggregative property of the parasite distribution has been widely used in genetic selection of sheep resistant to nematode infection (Gruner et al. 2004). The statistical distribution of worm burdens may also have implications for chemotherapy of nematode infections in domestic ruminants. Selective drenching of the most infected hosts has been suggested to slow down the rapid spread of treatment resistance in parasite populations (e.g. anthelmintic resistance in livestock (Hoste et al. 2002; Cornell et al. 2003). A suitable measurement of parasite aggregation and an adequate quantification of heavily infected individuals are thus necessary to set up targets for treatment. Knowing the distribution of parasites is also important in data analysis, mostly because most of the generally used statistical tests assumed that parasite distribution follows a normal distribution (Wilson & Grenfell, 1997).
Aggregation can be quantified by the variance to mean ratio. If this ratio is equal to one, the parasites are randomly distributed in their hosts (i.e. Poisson distribution), whereas if it is greater than one, the parasites are aggregated. The most widely used distribution is the Negative Binomial distribution (NBD) with its parameter k inversely correlated to aggregation. When k tends to infinity, the NBD converges to the Poisson distribution (Elliot, 1977) and the parasites are randomly distributed. When k tends to 0, the parasites are aggregated. The NBD is also widely used in analysing parasite data (Wilson & Grenfell, 1997) and almost all observed distributions are fitted with the NBD. However, to our knowledge, few studies check whether the NDB is the best fit for their data. Moreover, the use of k to quantify aggregation has been criticized (e.g. Taylor, Woiwod & Perry, 1979; Smith, 1984; Poulin 1993). Taylor et al. (1979) have demonstrated that k is a parameter whose relationship with aggregation is complex, mostly because over a wide range of densities the aggregation parameter k can vary with density in a non-linear way. The estimation of parameter k also varies as a function of host sample size (Gregory & Woolhouse, 1993) and is positively correlated with prevalence of infection and mean burden (Shaw, Grenfell & Dobson, 1998). In addition, k is not sensitive to the heavily infected hosts represented by the tail of distribution (Scott, 1987) although these hosts drive much of the disease dynamics. In this study, we use the ovine-trichostrongyle system to compare different theoretical distributions on observed parasite distributions. Five distributions have been chosen for their tail property: NBD, lognormal, exponential, normal and Weibull distributions. The normal, the lognormal and the Weibull distributions are exponential-bounded distributions (Tufto, Engen & Hindar, 1997; Clark, 1998). The normal distribution decreases faster than any exponential function, whereas the tails of the Weibull and of the log normal decrease much slower than any exponential function when the number of parasites tends towards infinity. The normal distribution is thus called a thin-tailed distribution whereas the Weibull and the lognormal are fat-tailed distributions. To our knowledge, the Weibull distribution has not yet been exploited to describe parasite distributions but it has been used to describe plant disease expansion in phytopathology (e.g. Xiao, Subbarao & Zeng, 1996) or to measure survivorship in epidemiology (e.g. Ebert, Lipsitch & Mangin, 2000).
This paper is organized as follows. First, we briefly describe the datasets and the 5 distributions. Then, we introduce the statistical methods used in this paper to (i) select the best distribution for observed parasite distributions, (ii) compare the fit of heavily infected hosts by the distributions and (iii) study the properties of the distribution parameters. Finally the results of the 3 evaluations of distributions are presented and discussed.
MATERIALS AND METHODS
Data sets
We focus on the interaction between the sheep and the directly transmitted gastro-intestinal parasite Teladorsagia circumcincta (for more details on the life-cycle see Denham, 1969), which have been widely studied at INRA in Tours (France), among others, during the last decade. We had access to individual worm counts for sheep infested under similar experimental conditions (weather, strains …) and necropsied with the same technique (1/5 to 1/10 of the aliquot of washings were examined) and by the same technicians in order to minimize technical error. For each dataset, we used an abbreviated name, which is given in italics between parentheses in the experiment descriptions (e.g. group1: Experimental).
First experiment
In the experiment of Gruner et al. (2004), 4 groups of 20 naive sheep (INRA 401 breed, 6 months old) were contaminated either experimentally (group 1: Experimental) or naturally on benzimidazole-susceptible T. circumcincta contaminated pasture (group 2: Natural, 3: Natural2 and 4: Natural3).
Second experiment
Gruner et al. (1994) infected 3 groups of 30 naive lambs with the same dose of infective larvae of benzimidazole-susceptible T. circumcincta but the frequency of exposure differed from 4 weeks for the lambs in group 1 (Single4) to 8 weeks for the lambs in group 2 (Single8) and in group 3 the infection was spread over 8 weeks (Trickle8).
Third experiment
In 1998 and 1999, four groups of 10 lambs grazed 4 separated contaminated pastures (Leignel, 2000). Each pasture was contaminated with an isolate harbouring 25% benzimidazole-resistant homozygotes infective larvae, 25% BZ susceptible homozygotes and 50% heterozygotes. On pasture 1 (NT), the lambs were untreated, on pasture 2 (LVT), 3 (BoT) and 4 (BZT), they were treated respectively with levamisole, fenbendazole and with both alternatively. Data of 1998 and 1999 were joined for the 4 groups to obtain a larger sample size.
In the first experiment (except for the group 1) and in the third experiment, lambs are constantly subjected to infection with T. circumcincta since they grazed from April to November, which is a common duration of grazing season in the region. We had 4 datasets for the first experiment, 3 for the second experiment and 4 for the third experiment. Table 1 summarizes the 11 datasets.
Table 1. Dataset descriptions (Abbreviated names are used in the text. L3 means infective larvae. The minimal and maximal numbers of parasites per sheep in a sample are presented.)

Distributions
The NBD, the normal distribution, the lognormal distribution, the exponential distribution and the Weibull distribution are presented in Table 2. Aggregation is defined by the variance to mean ratio: aggregation increases when this ratio increases and inversely. For each distribution, we studied the relationship between the distribution parameters and the variance to mean ratio by drawing this relationship. Parameter value ranges were chosen to be biologically realistic. Except for the exponential, all distributions have two parameters.
Table 2. Formulae, properties and parameters of the five distributions used to fit the observed distribution of a trichostrongylid nematode in sheep (For more details, see Kotz, Johnson and Read, 1982.)

The variances of the normal and the lognormal distributions, the mean of the NBD distribution and the scale parameter, bw, of the Weibull distribution are linearly related to aggregation. The other parameters (k, aw, means of normal and log normal, and b) have a decreasing exponential relationship with the variance to mean ratio (see Table 2). Although, the relationship between k and aggregation is modulated by the mean value, aggregation increases when k tends to 0. The two parameters of the Weibull distribution behave similarly to the two parameters of the NBD. As for the parameter k, the relationship between aw and aggregation is modulated by the average number of parasites per host: a higher parameter value is needed to get the same ratio value when the mean increases.
Statistical methods
Model selection: Maximum likelihood estimation of the parameters of each distribution
All parameters were estimated by maximizing likelihood (MLE). MLE of parameters were obtained by solving the equations or were computed using algorithms. All calculations were made with the statistical software R™ 1.8.1. The MLE of the NBD parameter k was calculated with the R™ function ‘theta.ml’ in the library MASS. The first author computed other MLE algorithms.
Model selection: Akaike's Information Criterion (AIC)
To select the best model among the set of candidate models, we used the Akaike's Information Criterion (AIC). The AIC of a model is equal to:

with p the number of parameters of the model.
The best model has the minimum AIC. We then computed the AIC differences, Δi, by subtracting the minimum AIC of the 5 values from each AIC value. Δi values help to determine the level of empirical support of a model given the best one (Δi between 0 to 2: substantial level; between 4 to 7: considerably less and >10: essentially none) (Burnham & Anderson, 2002). With these differences, the AIC weights (wi) are computed; they can be interpreted as the probability that a model is the best one among the set of candidate models for the observed data (Burnham & Anderson, 2002).

with Δi=AICi−AICmin and R, the number of candidate models in the set.
Identification of the differences between fits
To identify which hosts were best represented by the candidate distributions, we arbitrarily cut out the distributions in 3 parts: the first (A), represents uninfected or lightly infected hosts (0 to 20% of the parasite population), the second (B), the average infected hosts (20 to 80%) and the third (C) the heavily infected individuals (80 to 100%). For each part, the residual sums of squares were computed for each dataset and for each distribution. In order to compare the two distributions, the differences between the residual sums of squares were compared with a two-sided Wilcoxon Signed-ranks test within each of the three parts.
The behaviour of the tail of the theoretical distributions was then studied by examining the relationship between parameter values and the form of the theoretical distributions in sensu Scott (1987, see fig. 8 in her paper). The theoretical distributions of the NBD and of the candidates were drawn for similar mean values and for 3 different parameter values. For NBD, k values chosen by Scott (1987) were conserved.
Bias and variance in estimating the parameters
Bias and variance in estimating parameters for a particular distribution and for an average parasite load were studied using a series of random generated datasets for different sample sizes (Monte-Carlo method). For each sample, an estimate of the parameter values is obtained by MLE. The bias of the estimate is the expectation of the difference between the estimated values of the parameter and its true value. The variance of the estimate is the expectation of the squared difference between the estimated values and the mean of the estimated values. The sample size range was fixed between 5 and 2000 individuals and 1000 samples were generated for the same variance to mean ratio in order to compare the estimator statistical properties for the same aggregation level. The bias and the variance of both estimated values of the Weibull and the NBD parameters for each sample size were compared with a Wilcoxon Signed-Ranks test.
RESULTS
Model selection: comparison of the observed distributions and the five theoretical distributions
The variance to mean ratio was computed for each dataset (Table 3). This ratio is always larger than 1, ranging from 108 to 7222, indicating an aggregated distribution of the parasite nematode in all the datasets. Mean burdens are high, ranging from 1800 to 29000, which is not uncommon in T. circumcincta infections in sheep.

The 5 distributions were fitted to the 11 observed datasets. The exponential, the log normal and the normal distributions distribution provided worse fits compared to the NBD and the Weibull, as some of AIC differences exceeded 10, the level for no empirical support (see Table 4).
Table 4. Akaike's information criterion and AIC differences of the 5 distributions for each of the 11 datasets (An AIC difference of less than 2 indicates that we cannot distinguish between the two models, whereas a difference of more than 10 suggests that the distribution with the highest AIC of the pairs is providing a worse fit compared to the distribution with lower AIC.)

The Weibull distribution clearly heads the list, having no AIC difference greater than 1, and being one of the most probable models of the candidate models for all datasets. AIC differences for the NBD distribution over the Weibull are smaller than 1 for 4 datasets only (NT, Experimental, Natural1 and BZT) and between 1 and 6 for the others. The normal distribution is the best model for one dataset (BoT) and for 5 others, the normal distribution is a better model than the NBD (Single4, Single8, Trickle8, Natural3 and BoT). The relationship between AIC weights and the variance to mean ratio (Fig. 1) reveals that the Weibull distribution is appropriate whatever the degree of aggregation. The same cannot be said for the NBD distribution which only seems to adequately fit distributions (compared to the Weibull) with variance to mean ratios greater than 800 (except for the last point: dataset Natural3), whereas the normal distribution would fit distribution with ratios smaller than 800. For dataset Natural3, sheep grazed on previously infected pasture and the average load per sheep is very high. The large amount of parasites per sheep is probably the main reason for explaining the better fit of the normal distribution than the NBD. Even in this particular case the Weibull distribution gives the best fit for the observed distribution of T. circumcincta in the sheep population.

Fig. 1. Relationship between AIC weights of 3 of the 5 candidate distributions and the variance to mean ratio for trichostrongyle nematodes. The Weibull distribution (line) always shows a good probability of being the best distribution. The normal distribution (dotted line) remains acceptable when the variance to mean ratio is smaller than 800. The NBD (dashed line) displays probabilities close to the Weibull distribution for variance to mean ratios greater than 800 (except for the last point).
Identification of the differences in the fits
The normal, the lognormal and the exponential distributions are not selected because some of their AIC differences compared to the Weibull or NBD distributions exceeded 10. Identification of the differences in the fits is only studied for the Weibull distribution and the NBD. The residual sum of squares (RSS) of the Weibull distribution is smaller from those of the NBD for 7 datasets for the 3 parts of the distribution (Table 5). The RSS of the NBD is smaller for the 3 parts of the distributions of the parasites for the NT dataset only. This result is logically in agreement with the results from the AIC weights. For the other 10 datasets, the RSS of the Weibull distribution is always smaller than RSS of the NBD for part C (the tail) of the distribution. Hence, the Weibull distribution significantly better represents the heavily infected hosts (Wilcoxon Signed Rank test: P-value=0·0186). Differences are not significant for parts A (P-value=0·1016) and B (P-value=0·1230).
Table 5. Differences between the residual sum of squares of the Weibull distribution and of the NBD for 3 parts of the observed distributions (Part A: hosts harbouring 0 to 20% of the parasite population, Part B: hosts harbouring 20 to 80% of the parasite population and Part C: hosts harbouring 80 to 100% of the parasite population. A positive difference indicates that the Weibull residual sum of squares is greater than those of the NBD and conversely.)

Displaying the NBD and the Weibull theoretical distributions (Fig. 2) for different parameter values (k=1, k=2 and k=3, and aw=1, aw=2 and aw=3) confirms that the Weibull distribution has a more ‘flexible’ tail than the NBD. Changing the Weibull shape parameter aw, which is inversely proportional with aggregation, modifies the shape of the distribution and the tail of the distribution. When aw decreases, the tail decreases slower and the degree of aggregation increases; whereas the tail decreases faster when aw increases and the degree of aggregation decreases. In contrast, the tail of the NBD is similar whatever the value of k.

Fig. 2. (A) Negative binomial distribution for a mean burden of 1000 trichostrongyle nematodes and values of k of 1 (line), 2 (dashed line) and 3 (dotted line). (B) Weibull distribution for a mean of 1000 nematodes and values of aw of 1 (line), 2 (dashed line) and 3 (dotted line).
Bias in parameter estimation: influence of the parameter to sample size
The results of the simulation study are presented in Fig. 3. An accurate estimation of the Weibull parameter aw requires a sample size greater than 30 individuals (Fig. 3B) whereas an accurate estimation of the NBD parameter k requires more than 100 individuals (Fig. 3A). The 95% confidence interval (CI) of Weibull shape parameter aw, is always smaller than the 95% CI of k. This discrepancy is higher when the sample size is smaller than 500. The parameter aw is less sensitive to the sample size than the parameter k. The bias and the variance of the shape parameter aw are always smaller than the bias and the variance of the NBD exponent k. For a similar variance to mean ratio, the shape parameter aw of the Weibull distribution is thus less sensitive to sample size than k. The estimation bias and the estimation variance of the Weibull shape parameter are always significantly smaller than those of k (Wilcoxon Signed Rank tests: bias: P-value <0·0001 and variance: P-value <0·0001).

Fig. 3. Simulation of the effect of host sample size on k (A) and aw (B) estimates for a mean burden of 1000 trichostrongyle nematodes and a variance to mean ratio of 500. The solid circles represent the estimates and the solid lines the 95% confidence intervals. The dashed line represents the true value of k and of aw.
DISCUSSION
In all datasets, the distribution of T. circumcincta among lambs is aggregated, although the degree of aggregation is highly variable. Degrees of aggregation are the smallest in the 3 datasets of the second experiment (Single4, Single8 and Trickle8). In these experiments, lambs were infected with the same dose of infective larvae and were necropsied between the age of 4 and 8 months. In the two other experiments, the degree of aggregation is higher and sheep were older when they were necropsied. The increase in the degree of aggregation with host age in our datasets seems to confirm that aggregation reflects individual variability in the acquisition and the expression of the immune response against T. circumcincta (Hoste et al. 2002). Despite a wide range in the degree of aggregation, the Weibull distribution always gave a relatively good fit, whereas the NBD seems more appropriate for intermediate aggregation degrees only. Moreover, the AIC analysis shows that even the normal distribution is often a better model than the NBD for our data, especially for low degrees of aggregation. In our trichostrongyle nematode infections, it turns up that statistical tests based on the normal distribution would be more appropriate for 5 datasets. This raises the question of the systematic use of Negative Binomial distribution for analysing parasite data, in particular when performing Generalized Linear Modelling (GLM). This is despite, as for the NBD, regression tools exist for the Weibull (e.g. in the R software function ‘weibreg’ in the library ‘eha’).
Analysis of residuals (i.e. differences between observed and fitted values) shows that the Weibull distribution gives significantly better fits for the heavily infected hosts. This result is closely related to the theoretical distribution patterns. The Weibull shape parameter aw appears to behave as the NBD parameter k, being smaller when the degree of aggregation increases. But Scott (1987) showed that changing the value of k does not substantially change the tail of the theoretical distribution. Fig. 2 illustrates this result and shows that, conversely, changing the value of the Weibull parameter aw does substantially change the tail of the distribution. The Weibull distribution is thus a more flexible model to represent the heavily infected hosts. These animals are particularly interesting in farm management for two main reasons. First, major gains in reduction of the pasture contamination and prevention of parasitic diseases could be obtained by treating the most infected animals within a flock (Hoste et al. 2002). Second, targeted treatment is a practical approach to reduce selection pressure for anthelmintic resistance (Githigia, Thamsborg & Larsen, 2001).
The simulation study of the statistical properties of the parameter k confirms the results of Gregory and Woolhouse (1993) who previously showed that estimation of k varies with sample size. Weibull shape parameter aw also varies with sample size but an accurate value can be obtained with 30 hosts compared to 200 for k. Accurate estimations of k are obtained for mean parasite burden larger than 30 parasites per host, whereas estimation of aw does not vary with the mean parasite burden. Hence, in many biological situations where sample sizes are small (around 30 individuals) and/or where the number of parasites per host is small, estimation of aggregation degree with the Weibull shape parameter aw will be more precise than with NBD parameter k. Furthermore, in terms of experimental infections because of experimental costs in sheep infections (necropsy duration, animal costs …), getting an appropriate estimation of the parameter related with aggregation with a small sample size is a major gain.
This paper presents analyses of the fits of aggregated distribution of trichostrongyle nematodes from 11 different datasets. Variance to mean ratios confirm that T. circumcincta parasites are aggregated among the sheep. The degree of aggregation seems related to age and could reflect individual variability in the acquisition and expression of the immunity response in our datasets. In our lamb populations, the Weibull distribution gives much better fits than the commonly used NBD and the normal distribution is even more appropriate than the NBD (for 5 out of our 11 datasets) especially for variance to mean ratios smaller than 800. The heavily infected hosts, that drive much of the parasite infection, are significantly better represented by the Weibull distribution.
The Weibull shape parameter aw is inversely proportional to aggregation and appears to be a good descriptor of aggregation, whose estimate is less sensitive to sample size and to small mean parasite burden than the parameter k of the NBD. The Weibull distribution turns up to be a good alternative to the NBD to study parasite aggregation amongst their hosts, especially in host parasite systems with small sample size.
A drawback of the Weibull distribution is that it does not give much insight into how underlying biologically important mechanisms may influence the distribution of parasites amongst their host. In comparison, the NBD can arise in at least five different ways (Southwood, 1978) such as compounding of Poisson processes or true contagion. From a biological point of view, this property may be important to understand processes underlying aggregation (see e.g. Brown et al. 2002). However, in epidemiology, a model, which gives a good representation of heavily infected hosts, is essential, and even more when it is used to predict parasite transmission. Previous theoretical works have pointed out that targeted treatment of the most heavily infected-hosts (8% of the population) would result in a decrease of 50% of the population mean worm burdens, assuming a NBD distribution with a high aggregation (k=0·05; Anderson & May, 1982). As the Weibull distribution tends to better estimate most heavily infected-hosts in our datasets, introducing this distribution and its shape parameter aw in such models should give predictions closer to reality for targeted treatments in sheep nematode systems.
In conclusion, the Weibull distribution seems to provide a good alternative to the NBD to study trichostrongyle nematode distribution among their hosts, being more flexible for modelling the tail of the distribution and covering a wider range of aggregation degrees. Similar evaluations should be conducted on other host–parasite systems in order to confirm these results. However, we would strongly suggest that more emphasis is put on checking both the goodness of fit of the theoretical model used and whether other models might be more appropriate when analysing and modelling parasite data.
S. Gaba is a grateful recipient of PhD grant within the frame of INRA Modelling Epidemiology Program. We thank L. Gruner for providing individual necropsy data of recently published experiments. S. Gourbière and E. Klein are thanked for valuable comments. We are grateful to two anonymous referees for suggestions, which significantly improved this paper.
References
REFERENCES
Anderson, R. M. and
Gordon, D. M. (
1982).
Processes influencing the distribution of parasite numbers within host populations with special emphasis on parasite-induced host mortalities.
Parasitology
85,
373–398.CrossRefGoogle Scholar
Anderson, R. M. and
May, R. M. (
1982).
Population dynamics of human helminth infections: control by chemotherapy.
Nature, London
297,
557–563.CrossRefGoogle Scholar
Anderson, R. M. and
May, R. M. (
1985).
Age related changes in the rate of disease transmission: implications for the design of vaccination programmes.
Journal of Hygiene
94,
365–436.CrossRefGoogle Scholar
Barger, I. A. (
1985).
The statistical distribution of Trichostrongylid nematodes in grazing lambs.
International Journal for Parasitology
15,
645–649.CrossRefGoogle Scholar
Brown, S. P.,
Loot, G.,
Teriokhin, A.,
Brunel, A.,
Brunel, C. and
Guegan, J. F. (
2002).
Host manipulation by Ligula intestinalis: a cause or consequence of parasite aggregation?
International Journal for Parasitology
32,
817–824.Google Scholar
Burnham, K. P. and
Anderson, D. R. (
2002).
Model Selection and Multimodel Inference: A Practical Information-Theoretic Approach.
Springer-Verlag,
New York.
Clark, J. S. (
1998).
Why trees migrate so fast: confronting theory with dispersal biology and the paleorecord.
American Naturalist
152,
204–224.CrossRefGoogle Scholar
Cornell, S. J.,
Isham, V. S.,
Smith, G. and
Grenfell, B. T. (
2003).
Spatial parasite transmission, drug resistance and the spread of rare genes.
Proceedings of the National Academy of Science, USA
100,
7401–7405.CrossRefGoogle Scholar
Denham, D. A. (
1969).
The development of Ostertagia circumcincta in lambs.
Journal of Helminthology
43,
299–310.CrossRefGoogle Scholar
Ebert, D.,
Lipsitch, M. and
Mangin, K. (
2000).
The effect of parasites on host population density and extinction: experimental epidemiology with Daphnia and six microparasites.
The American Naturalist
156,
459–477.CrossRefGoogle Scholar
Elliot, J. M. (
1977).
Statistical Analysis of Samples of Benthic Invertebrates.
Freshwater Biological Association,
Ambleside,
UK.
Githigia, S. M.,
Thamsborg, S. M. and
Larsen, M. (
2001).
Effectiveness of grazing management in controlling gastrointestinal nematodes in weaner lambs on pasture in Denmark.
Veterinary Parasitology
99,
115–121.CrossRefGoogle Scholar
Gregory, R. D. and
Woolhouse, M. E. J. (
1993).
Quantification of parasite aggregation – a simulation study.
Acta Tropica
54,
131–139.CrossRefGoogle Scholar
Gruner, L.,
Mandonnet, N.,
Bouix, J.,
Vu Tien Khang, J.,
Cabaret, J.,
Hoste, H.,
Kerboeuf, D. and
Barnouin, J. (
1994).
Worm population characteristics and pathological changes in lambs after a single or trickle infection with Teladorsagia circumcincta.
International Journal for Parasitology
24,
347–356.CrossRefGoogle Scholar
Gruner, L.,
Bouix, J.,
Khang, J. V. T.,
Mandonnet, N.,
Eychenne, F.,
Cortet, J.,
Sauve, C. and
Limouzin, C. (
2004).
A short-term divergent selection for resistance to Teladorsagia circumcincta in Romanov sheep using natural or experimental challenge.
Genetics Selection Evolution
36,
217–242.CrossRefGoogle Scholar
Hoste, H.,
Chartier, C. and
Le Frileux, Y. (
2002).
Control of gastrointestinal parasitism with nematodes in dairy goats by treating the host category at risk.
Veterinary Research
33,
531–545.CrossRefGoogle Scholar
Keymer, A. E. and
Anderson, R. M. (
1979).
The dynamics of infection of Tribolium confusum by Hymenolepis diminuta: influence of infective-stage density and spatial distribution.
Parasitology
79,
195–207.CrossRefGoogle Scholar
Kotz, S.,
Johnson, N. L. and
Read, R. C. B. (
1982).
Encyclopaedia of Statistical Sciences, in 9 volumes, pp
583–587.
Wiley
New York,
USA.
Leignel, V. (
2000).
Diversité génétique et résistance aux anthelminthiques chez Teladorsagia circumcincta (nematoda, Trichostrongyloidea) parasite de petits ruminants. Ph.D. thesis. University of Montpellier.
Pacala, S. W. and
Dobson, A. P. (
1988).
The relation between the number of parasites host and host age per host and host age: population dynamic causes and maximum likelihood estimation.
Parasitology
96,
197–210.CrossRefGoogle Scholar
Poulin, R. (
1993).
The disparity between observed and uniform distributions – a new look at parasite aggregation.
International Journal for Parasitology
23,
937–944.CrossRefGoogle Scholar
Poulin, R. (
1998).
Evolutionary Ecology of Parasites: From Individuals to Communities.
Chapman and Hall,
London.
Scott, M. E. (
1987).
Temporal changes in aggregation: a laboratory study.
Parasitology
94,
583–595.CrossRefGoogle Scholar
Shaw, D. J.,
Grenfell, B. T. and
Dobson, A. P. (
1998).
Patterns of macroparasite aggregation in wildlife host populations.
Parasitology
117,
597–610.CrossRefGoogle Scholar
Shaw, D. J. and
Dobson, A. P. (
1995).
Patterns of macroparasites abundance and aggregation in wildlife populations: a quantitative review.
Parasitology
111 (Suppl.),
S111–S133.CrossRefGoogle Scholar
Smith, G. (
1984).
Density-dependent mechanisms in the regulation of Fasciola hepatica populations in sheep.
Parasitology
88,
449–461.CrossRefGoogle Scholar
Southwood, T. R. E. (
1978).
Ecological Methods with Particular Reference to the Study of Insect Populations, 2nd Edn.
Chapman and Hall,
London and New York.
Steel, J. W.,
Symons, L. E. A. and
Jones, W. O. (
1980).
Effects of level of larval intake on the productivity and physiological and metabolic responses of lambs infected with Trichostrongylus colubriformis.
Australian Journal of Agricultural Research
31,
821–838.CrossRefGoogle Scholar
Taylor, L. R.,
Woiwood, I. P. and
Perry, J. N. (
1979).
The negative binomial as a dynamic ecological model and the density dependence of k.
Journal of Animal Ecology
47,
383–406.CrossRefGoogle Scholar
Tufto, J.,
Engen, S. and
Hindar, K. (
1997).
Stochastic dispersal processes in plant populations.
Theoretical Population Biology
52,
16–26.CrossRefGoogle Scholar
Wilson, K. and
Grenfell, B. T. (
1997).
Generalized linear modelling for parasitologists.
Parasitology Today
13,
33–38.CrossRefGoogle Scholar
Wilson, K.,
Bjornstad, O. N.,
Dobson, A. P.,
Merler, S.,
Poglaven, G.,
Randolph, S. E.,
Read, A. F. and
Skorping, A. (
2002).
Heterogeneities in macroparasites infections: patterns and processes. In
Ecology of Wildlife Diseases
(ed. Hudson, P. J., Rizzoli, A., Grenfell, B. T., Heesterbeek, H. & Dobson, A. P.), pp.
6–44.
Cambridge University Press,
Cambridge.
Woolhouse, M. J. E.,
Dye, C.,
Etard, J. F.,
Smith, T.,
Charlwood, J. D.,
Garnett, G. P.,
Hagan, P.,
Hii, J. L. K.,
Ndhlovu, P. D.,
Quinnell, R. J,
Watts, C. H.,
Chandiwana, S. K. and
Anderson, R. M. (
1997).
Heterogeneities in transmission of infectious agents: implications for the design of control programs.
Proceedings of the National Academy of Sciences, USA
94,
338–342.CrossRefGoogle Scholar
Xiao, C. L.,
Subbarao, K. V. and
Zeng, S. M. (
1996).
Incorporating an asymptotic parameter into the Weibull model to describe plant disease progress.
Journal of Phytopathology
1144,
375–382.CrossRefGoogle Scholar

Table 1. Dataset descriptions

Table 2. Formulae, properties and parameters of the five distributions used to fit the observed distribution of a trichostrongylid nematode in sheep
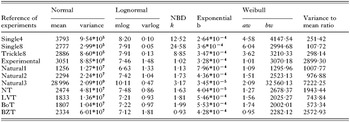
Table 3. Values of the maximum likelihood expectation (MLE) of the parameters of the five distributions
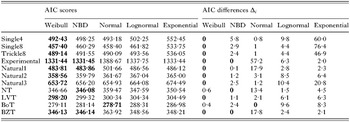
Table 4. Akaike's information criterion and AIC differences of the 5 distributions for each of the 11 datasets

Fig. 1. Relationship between AIC weights of 3 of the 5 candidate distributions and the variance to mean ratio for trichostrongyle nematodes. The Weibull distribution (line) always shows a good probability of being the best distribution. The normal distribution (dotted line) remains acceptable when the variance to mean ratio is smaller than 800. The NBD (dashed line) displays probabilities close to the Weibull distribution for variance to mean ratios greater than 800 (except for the last point).

Table 5. Differences between the residual sum of squares of the Weibull distribution and of the NBD for 3 parts of the observed distributions

Fig. 2. (A) Negative binomial distribution for a mean burden of 1000 trichostrongyle nematodes and values of k of 1 (line), 2 (dashed line) and 3 (dotted line). (B) Weibull distribution for a mean of 1000 nematodes and values of aw of 1 (line), 2 (dashed line) and 3 (dotted line).

Fig. 3. Simulation of the effect of host sample size on k (A) and aw (B) estimates for a mean burden of 1000 trichostrongyle nematodes and a variance to mean ratio of 500. The solid circles represent the estimates and the solid lines the 95% confidence intervals. The dashed line represents the true value of k and of aw.
 You have
Access
- 37
- Cited by