

Introduction
Age-related disparities in treatment decisions could well reflect systematic differences in likelihood of benefit to those treated. In this article, we provide evidence of age differences in the treatment of Ontario hospital in-patients admitted with acute myocardial infarction (AMI), commonly known as a heart attack.Footnote 1 We found disparities in treatment rates that would seem to put elderly patients at a disadvantage, as compared to younger ones.
We chose to study the age pattern of treatment for AMI for three reasons. First, cardiology is the biggest diagnostic category for admission to hospital and AMI accounts for much of that, with 17,000 new admissions in Ontario in both 1999 and 2000 (Enhanced Feedback For Effective Cardiac Treatment [EFFECT], 2005); furthermore, it occurs mainly among those aged 50 and older. (The next most frequent category is “pregnancy”, a diagnostic restricted to women, almost all of whom are under 50.) Second, AMI is a major cause of death (in Ontario the mortality rate was 12% at 30 days and 21% at one year; EFFECT), and the choice of treatment is likely to affect survivors’ quality of life in later years. Last, a number of alternative treatments are available for patients admitted with AMI, and the chosen treatments can be identified in the administrative records at our disposal.
In the study we conducted on the Ontario hospital in-patients records and which we present here, we were concerned with how the treatment chosen for patients varied with patient age, after controlling for other factors.
Treatment of AMI
Virtually all patients admitted to hospitals for AMI receive therapeutic (thrombolytic) treatment to remove the obstruction in the vessels and restore the blood flow (the drugs of choice are streptokinase and urokinase). Treatment may end there, other diagnostic tests may be used, or more invasive procedures might be invoked with or without further diagnostic tests.
The invasive procedure of longest standing is coronary artery bypass grafting (CABG), which has been in use since the mid-1960s. With this technique, the obstructed area is bypassed by grafting veins or arteries from the aorta to the coronary artery. CABG has been found to produce the best long-term outcomes in cases of severe chronic obstruction, and medical guidelines identify it as the treatment of choice for such cases (Moise & Jacobzone, Reference Moise and Jacobzone2003). Technical improvements in the procedure itself have resulted over time in fewer post-operative complications and hence have meant that more patients could benefit from CABG with each passing year. However, as we will show, the rates of CABG have remained stable.
Percutaneous transluminary coronary angioplasty (PTCA) is an alternative and much less invasive treatment that has been demonstrated to be just as effective as CABG in treating an episode of AMI if the blockage is not too severe. It has been available since the late 1970s or the early 1980s, depending on the country. With PTCA, a catheter (a small hollow plastic tube) is threaded through the arterial system until it reaches the obstructed coronary artery, at which point a balloon is inflated to clear the obstructed area (Moise & Jacobzone, Reference Moise and Jacobzone2003). Since it is not only much less invasive but also much cheaper than CABG (Naglie, Tansey, Krahn, O’Rourke, Detsky, & Bolley, Reference Naglie, Tansey, Krahn, O’Rourke, Detsky and Bolley1999), its use has grown rapidly. It has been estimated that by 1999 there were 3 million PTCA treatments worldwide, and only 700,000 CABG treatments (Moise & Jacobzone). Pilote, Lavoie, Ho, & Eisenberg (Reference Pilote, Lavoie, Ho and Eisenberg2000) observed similar trends in Québec, and Spencer, Wang, Donovan, and Tu (Reference Spencer, Wang, Donovan and Tu2008) documented an increase in the rate of PTCA in Ontario.
Cardiac catheterization with angiography (AGG) is sometimes used as a diagnostic procedure to detect artery narrowing before deciding whether to proceed with either CABG or PTCA. In this procedure, catheters are advanced under x-ray guidance to the openings of the arteries through which a dye is injected while an x-ray video is recorded. If the narrowing warrants treatment, a PTCA can be performed immediately.Footnote 2
Previous research has shown systematic differences in the treatment provided for AMI along such dimensions as gender (Pilote et al., Reference Pilote, Lavoie, Ho and Eisenberg2000, Rathore, Wang, Radford, Ordin, & Krumholz, Reference Rathore, Wang, Radford, Ordin and Krumholz2002), race (Chen, Rathore, Radford, Wang, & Krumholz, Reference Chen, Rathore, Radford, Wang and Krumholz2001), socio-economic status (Pilote, Joseph, Bélisle, & Penrod, Reference Pilote, Joseph, Bélisle and Penrod2003), and region of residence (Ko, Krumholz, Wang, Foody, Masoudi, Havranek et al., Reference Ko, Krumholz, Wang, Foody, Masoudi and Havranek2007). These differences have been widely documented in relation to various health care systems, including the one in Canada. Age disparities in the type of intervention for patients admitted with AMI have also been documented in univariate analyses (Moise & Jacobzone, Reference Moise and Jacobzone2003; Gusmano, Rodwin, Weisz, & Das, Reference Gusmano, Rodwin, Weisz and Das2007), but the latter study, based on data from Manhattan (New York) and Paris (France) for those aged 45 and older, has shown that this apparent disparity disappears after controlling for co-morbidity.Footnote 3 Austin, Tu, Ko, and Alter (Reference Austin, Tu, Ko and Alter2008) also documented a spurious age discrepancy in post-discharge treatment (including beta-blockers, angiotensin modifying agents, or statins) for Ontario patients aged 65 and older with AMI: the univariate age difference (between those 80 and over and 65 to 69) is not significant once co-morbidities have been taken into account (see Note 3 for the measurement of co-morbidities).
Our focus here is precisely on the relationship between age and the treatment provided to AMI patients in Ontario, to assess whether age itself plays a role in the choice of treatment that is made. Our study was the first to be based on patients of all ages in Ontario and that controlled for co-morbidities and hospital effects, as well as for age. It is important to control for co-morbidities and to identify a specific relationship between treatment and patient age, since unequal access to more aggressive treatment, such as CABG, AGG, and PTCA can affect the outcome in terms of survival and the quality of life.Footnote 4
Comparisons between Ontario and the U.S. (Ko et al., Reference Ko, Krumholz, Wang, Foody, Masoudi and Havranek2007) have shown that, at the end of the 1990s, AMI patients admitted in Ontario were much less likely to be in a hospital with invasive surgical facilities than similar patients in the United States: in Ontario, 84 per cent of patients were hospitalized in settings with no surgical facilities, compared to 27 per cent in the U.S. (and 39% in the northeastern region of the U.S.). Not surprisingly, then, Ontario patients were much less likely to receive an invasive surgical procedure than those in the U.S.: 17 per cent received cardiac catheterization (compared to 37% in the U.S.), 6.5 per cent received PTCA (versus 17% in the U.S.), and 4 per cent had CABG (versus 6% in the U.S.). The same study indicated that hospital stays for AMI treatment were significantly longer in Canada (8.3 nights versus 6.7), and patients were equally likely to receive therapeutic treatment as in the U.S.
Less use of aggressive treatment did not seem to result in any difference in 30-day or one-year mortality rates between Ontario patients and those in the U.S. However, this lack of difference might stem from the fact that U.S. patients were significantly more likely to suffer from co-morbidities (especially diabetes and hypertension) (Ko et al., Reference Ko, Krumholz, Wang, Foody, Masoudi and Havranek2007). It must also be kept in mind that very old patients seemed less likely to be hospitalized at all in Ontario: 41 per cent of all Ontario patients admitted for an AMI were aged 65 to 74, and only 16 per cent were 85 or older, as compared to 37 per cent and 21 per cent in the U.S. (Ko et al., Reference Ko, Krumholz, Wang, Foody, Masoudi and Havranek2007). Finally, we note that at the end of the 1990s, AMI patients in Ontario had not fared well compared to those elsewhere in Canada (Tu, Austin, Filate, Johansen, Brien, Pilote et al., Reference Pilote, Joseph, Bélisle and Penrod2003). Ontario had one of the highest in-hospital mortality rates in Canada for AMI admissions (although the difference was not significant between Ontario and the rest of Canada in the overall mortality rate standardized for age and sex), and the one year re-admission rates for AMI, congestive heart failure, or angina were among the highest in the country, significantly greater than the average.
Research questions
We formulated three research questions to analyze our study data:
• Is there an age pattern among those who receive AGG, PTCA, and CABG (and hence, the complement, those who receive only therapeutic treatment)?
• If yes, is the age pattern explained by the presence of more co-morbidities among older patients?
• Does the age pattern of treatments differ across hospitals?
Our key results follow. First, there was a strong age gradient for AGG and PTCA; older patients were less likely to have those procedures and more likely to be discharged with only therapeutic treatment. The age pattern was less clear for CABG. Second, after controlling for AMI severity and co-morbidity, the age gradient for AGG and PTCA was somewhat less steep, but remained strong and significant. Finally, the hospitals to which AMI patients were admitted explained more of the age pattern of treatment than did clinical factors (severity and co-morbidity) but the age gradient was still significant (albeit flatter) once the hospital-specific effect was controlled for.
Data
Our results were based on analysis of administrative data from in-patient stays. These data were complex, and, to the best of our knowledge, no systematic statistical analysis of the age pattern of procedures for AMI had been attempted before. More specifically, we used the Discharge Abstract Database (DAD) of the Ontario Ministry of Health and Long-Term Care for five fiscal years: 1994–1995, 1999–2000, 2000–2001, 2001–2002, and 2004–2005. (Hereinafter, we refer to the fiscal years as 1995, 2000, 2001, 2002, and 2005, the calendar year in which they ended.) The DAD is an exhaustive file of all acute care hospital stays, and includes all hospitals covered by the Ontario Health Insurance Plan (OHIP), the provincial health plan in the province of Ontario.
We were not able to link stays for one patient: if a patient was re-admitted (e.g., three months after being discharged), we would observe two stays without knowing that they belonged to the same individual. Similarly, it would count as two separate stays in the DAD if a patient was transferred from one hospital to another. However, we could identify any stay that started as a transfer from another hospital or ended as a transfer to another hospital. The treatment of transfers in our analyses is detailed later.
The number of discharges for AMI patients increased from 28,753 in 1995 to 41,590 in 2001 and then decreased to 31,011 in 2005, for an overall total of 180,766 over the five fiscal years. Of those, 108,061 were males and 72,705 females. The recent decrease is consistent with that observed between 2000 and 2006 for Canada as a whole according to the Organization for Economic Cooperation and Economic Development (OECD, 2009) health database (the number of discharges in 2006 was 89% of the level in 2000). Less than 10 per cent of discharged patients were younger than 50 (at the time of admission), 16 per cent were between 50 and 59, 22 per cent between 60 and 69, 29 per cent between 70 and 79, and 23 per cent over 80.
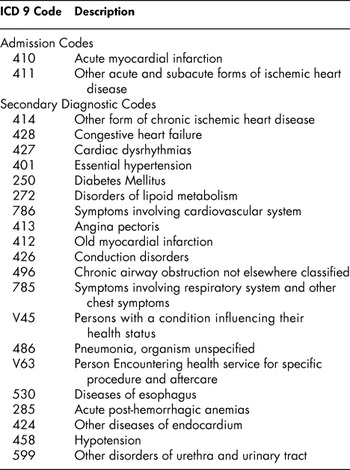
In addition to the date of admission and age and sex of the patient, the DAD reports the following: (a) the admission diagnostic code; (b) up to 20 secondary diagnostics, some of which may be related to the admission diagnostic or to co-morbidities (e.g., a patient admitted with AMI may also have been diagnosed with diabetes); (c) the hospital where the patient was treated; (d) all procedures performed; and (e) the date of discharge. No information is available on the outcome of the treatment (such as length of survival after discharge, quality of life, etc.), except that the patient was alive when discharged from hospital. The list of the 20 most frequent secondary diagnostics for AMI admissions is provided in Table 1.
AMI ICD9 Admission Codes and the 20 Most Common Secondary Codes for AMI Admissions

Note
The secondary diagnoses are listed in order of frequency of observation.
Our analysis was limited to those admitted to hospital for in-patient (as distinct from day procedure) care, with either of two International Classification of Diseases (ICD9) admission diagnostic codes related to AMI (410: acute myocardial infarction, and 411: Other acute and sub-acute forms of ischemic heart disease). The date of discharge determined the fiscal year in which they were observed. We excluded all discharges that involved a transfer to another hospital; 15 per cent of all discharges were thereby excluded. In such cases, the patient received no treatment before being transferred to another facility. However, we included discharges that involved a transfer from another hospital for further diagnosis and possible treatment. (Transfers of patients after the main treatment for postoperative rehabilitation would not be observed in our sample since rehabilitation hospitals are not included in DAD).
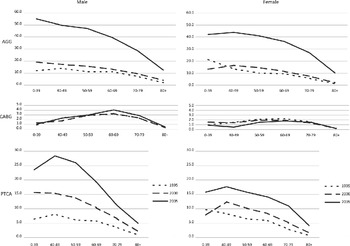
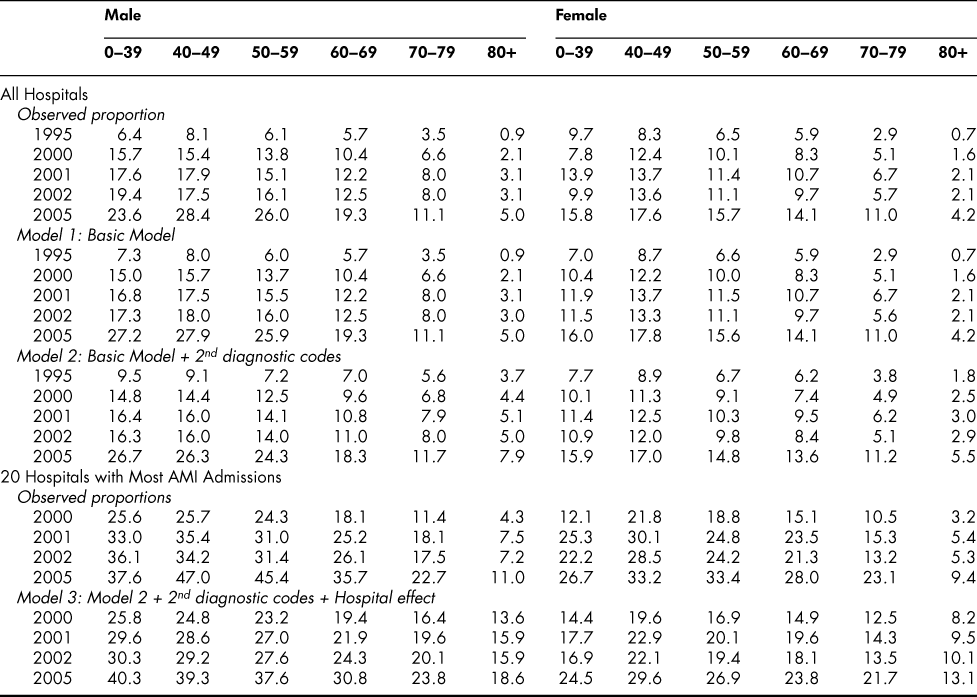
Figure 1 shows the proportions of AMI patients receiving each of AGG, CABG, and PTCA in three fiscal years, separately for males and females. The proportions for all five data years are shown in panels 1 and 4 of Tables 2 through 4. The plots confirm the results found by Spencer et al. (Reference Spencer, Wang, Donovan and Tu2008) regarding the growth of AGG and PTCA and the relative stability of CABG, but the plots add information relating to how the three treatments are distributed across age groups.
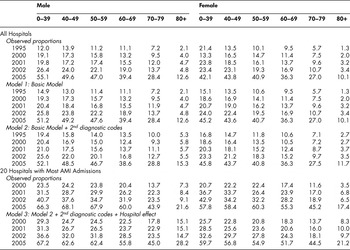
Observed Percentages of AMI Admissions Receiving Specified Treatments, by Age and Sex, All Hospitals, Ontario, 1995–2000.

Observed and Predicted Percentages of AMI Admissions Receiving AGG, by Age and Sex, Ontario, 1995–2005

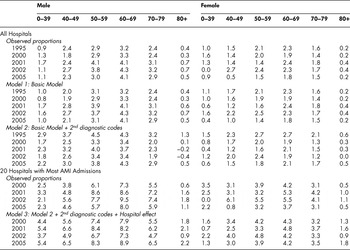
Observed and Predicted Percentages of AMI Admissions Receiving CABG, by Age and Sex, Ontario, 1995–2005

Observed and Predicted Percentages of AMI Admissions Receiving PTCA, by Age and Sex, Ontario, 1995–2005
We see that the proportion of patients receiving AGG increased substantially between 1995 and 2005 (approximately fivefold among males in all age categories and fourfold among females). The plots suggest also that the age pattern changed little between 1995 and 2005.
The age pattern is much less clear for CABG. We note that the proportions remained very low for all age categories, generally between one per cent and four per cent, and changed relatively little over the data period. By contrast, the rates for PTCA for males in all age groups increased more than threefold between 1995 and 2005; among females the relative increase was somewhat less, but still substantial. In sum, we see strong increases in the AGG and PTCA treatment rates, but the pronounced age patterns that were evident in 1995 persisted.
Methods
To address our research questions, we specified three models, which we estimated as linear probability functions using ordinary least squares.Footnote 5 Model 1, our basic model, was designed to test for any significant change in the age pattern of treatment over time (from 1995 to 2005). It included only age, year, and their interaction as explanatory variables. We specify a linear model:

where T is a dummy variable taking a value of 1 if the treatment was received (T = AGG, CABG, and PTCA); AGE is the age category of the patient at admission (less than 40, 40 to 49, 50 to 59, 60 to 69, 70 to 79, and 80 and over); YEAR is the year of discharge; and u is a random error term. The index “i” indicates the individual discharge observed. The equations were estimated using all five years of data, separately for males and females.
We then added controls. Model 2 tested whether the age pattern could be explained by differences across ages in AMI severity and co-morbidity. It added variables to Model 1 to indicate whether a patient had each of the 20 most common secondary diagnostics (for patients admitted with AMI, as observed in the records over five years): each dummy variable takes value 1 if the patient was diagnosed with the condition and 0 if not. To test for severity and co-morbidities, Model 2 also included two additional variables. The first was the total number of diagnostic codes recorded, aside from the AMI codes themselves; and the second was the total number of secondary diagnostic codes recorded that were not in the top 20. Again, separate equations were estimated for each treatment (AGG, CABG, PCTA), separately for each sex. The implicit reference category here was a patient admitted with none of the most common 20 secondary diagnostics.
Model 3 added dummy variables to indicate the hospital of admission. Since that information was not available in the file for 1995, estimation started with the 2000 fiscal year, and included four years of data. We also restricted the sample to in-patient stays observed in the 20 hospitals with the most AMI admissions over these four years (2000, 2001, 2002, and 2005) in order to avoid adding too many dummy variables and introducing noise in the analysis.Footnote 6
Results
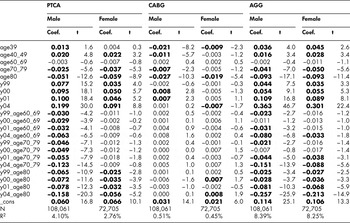
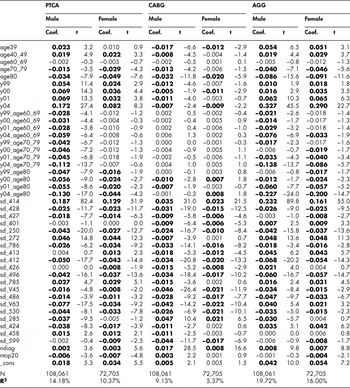
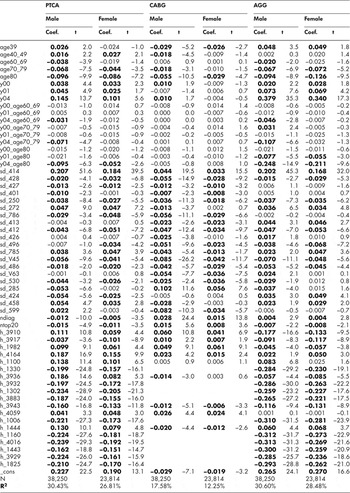
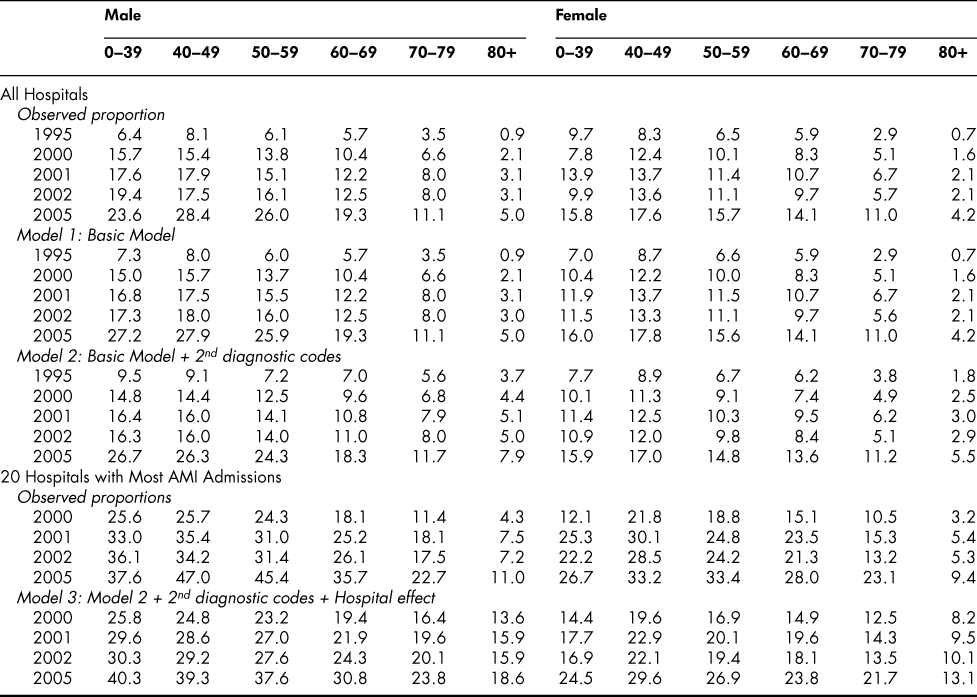
We used the estimated coefficients from Models 1 through 3 to generate predicted probabilities of receiving each of the three treatments. That was done separately for each age group in each year, and separately also for males and females. (Tables 2 through 4, panels 2, 3, and 5, list the predicted values; Tables 5 through 7 list the estimated equations on which they were based— bold characters indicate 5% level of significance.)
Model 1, Estimated Coefficients

Note
Equations estimated by ordinary least squares.
Model 2, Estimated Coefficients

Note
Equations estimated by ordinary least squares.
“sd” indicates secondary diagnostic codes; descriptions of the codes is provided in Table 4.
“ndiag” is the number of secondary diagnostics included in the 20 most frequently associated with AMI admissions.
“ntop20” is the number of secondary diagnostics not included in the 20.
Model 3, Estimated Coefficients

Note
See note to Table 6.
“h_xxxx” is the hospital number; included here are the 20 hospitals with the most AMI admissions.
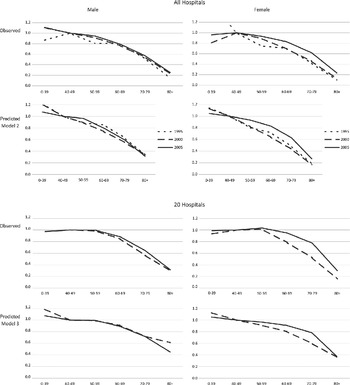
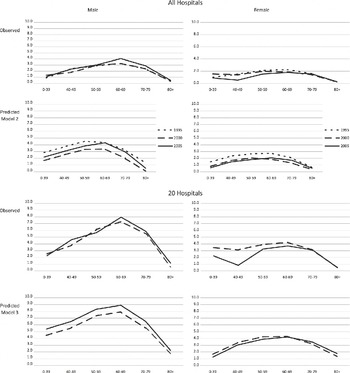
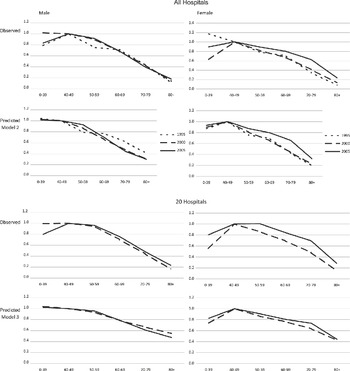
The key results are presented in Figure 2 (for AGG), Figure 3 (CABG), and Figure 4 (PTCA). In each figure, the upper panel relates to AMI-patient discharges from all acute care hospitals in Ontario (of which there are 288), and the lower panel to the 20 hospitals that had the largest number of AMI patient discharges in the past four years for which we have data. The upper panel (“All Hospitals”) shows two sets of age patterns of admission: those that were observed and those that were predicted based on Model 2 after controlling for co-morbidities. The lower panel (“20 Hospitals”) shows the age profiles that were observed and predicted after controlling for both co-morbidity and hospital effects. To focus attention on the shapes of the profiles themselves, and how they have changed over time, all age profiles are shown relative to the group aged 40 to 49. Comparisons of the observed and predicted age profiles illustrate the effect of controlling for clinical indicators (Model 2) or both clinical indicators and hospital effects (Model 3).
Observed and Predicted Proportions of AMI Admissions Receiving AGG, All Hospitals and 20 Hospitals with most AMI Admissions, Ontario, 1995–2005.
Note: Proportions are relative to age group 40–49.

Observed and Predicted Proportions of AMI Admissions Receiving CABG, All Hospitals and 20 Hospitals with most AMI Admissions, Ontario, 1995–2005.
Note: Proportions are relative to age group 40–49.

Observed and Predicted Proportions of AMI Admissions Receiving PTCA, All Hospitals and 20 Hospitals with most AMI Admissions, Ontario, 1995–2005.
Note: Proportions are relative to age group 40–49.

Age pattern for AGG
Co-morbidities are more frequent among older patients, so it might be thought that they would explain why younger AMI patients were more likely to receive non-therapeutic treatment and older patients to receive only therapeutic treatment. The effect of controlling for secondary diagnostics is suggested in the lower part of the upper panel of Figure 2; it flattens the gradient somewhat without suppressing it altogether. We can infer that if all patients had the same secondary diagnostics, younger male patients (those under 40) would still be three times more likely than older ones (those 80 and over) to receive AGG; among females, they would be four times more likely.Footnote 7 Limiting the analysis to Ontario’s 20 main hospitals and introducing a hospital fixed effect, as we did in Model 3, flattens the age profile still further (see the lower panel), but we continued to find that otherwise similar AMI patients, with a given set of secondary diagnoses, were less likely to receive AGG the older they were.
Age pattern for CABG
As Figure 3 shows, including controls for secondary diagnostics in the treatment of AMI (Model 2) tended to flatten somewhat the predicted probability of having CABG treatment, and to yield predicted values a little higher than the observed values, especially for those 80 and over (compared to the observed proportions). However, including controls for secondary diagnostics had relatively little impact on the overall age pattern. When the analysis was restricted to the 20 hospitals in Ontario with the most AMI procedures and controls were added for hospital effects (Model 3), the age profile again flattened somewhat, although (especially for males) sharply lower rates continued to apply to those over age 70 as compared to those aged 60 to 69.
Age pattern for PTCA
Figure 4 shows that the age gradient is notably flatter after controlling for secondary diagnostics (upper panel, all hospitals). For example, in 2005, the youngest age group (0 to 39) of males was 3.4 times more likely to receive PTCA than the oldest (80 and over) after taking secondary diagnostics into account, but 5.4 times more likely if they were ignored. Among females, the corresponding ratios were reduced from 3.8 to 2.9. Even so, a steep gradient remains, indicating that co-morbidities explained only a small portion of the age differences in those receiving PTCA. Put differently, among males hospitalized for AMI in 2005, 8 per cent of those 80 and over would have received PTCA as compared to 27 per cent of those 0 to 39 years old with the same co-morbidities. Among female patients, the equivalent proportions were 6 per cent and 16 per cent.
The lower panel shows the same relationships when both secondary diagnostics and hospital of admission were entered into the model and the estimation was restricted to 20 hospitals. The age gradients of the predicted probabilities, after controlling for secondary diagnostics and hospital effects, are flatter than in the upper panel, from 3.4 to 2.2 for males and 2.8 to 1.9 for females. This indicates that older patients were more likely to be admitted to hospitals less well-equipped to perform PTCA. However, the age profiles for the 20 hospitals are still far from flat, suggesting that even within that more select group of hospitals, age influenced access to PTCA.
The estimated coefficients of Model 3 (shown in Table 7) indicate that hospital effects are very strong, even stronger than the effect of the secondary diagnostics. It seems clear that some hospitals are well-equipped to perform PTCA whereas others are not.
Concluding Remarks
Our results are generally consistent with the OECD-led study of age-related diseases (Moise & Jacobzone, Reference Moise and Jacobzone2003), which shows that the proportion of patients receiving angioplasty (PTCA) decreases with age in most jurisdictions (including Ontario). However, that study was based on a much more limited set of hospital internal statistics. Here, the results were based on a comprehensive and systematic collection of discharge information at the provincial level, including much richer information on diagnostics (including co-morbidity codes beyond the admission diagnostic) and a comprehensive set of treatment alternatives.
Overall, we found strong and persistent age patterns in the application of medical technology in the treatment of AMI. Most importantly, our results suggested that older patients were more likely to have only therapeutic treatment and hence less likely to have had more invasive treatments. That was true even after controlling for clinical criteria such as secondary diagnostics: the predicted age profiles for AGG and PTCA flattened somewhat with the controls, but remained very steep.
Among the few analyses of the impact of age on the treatment choice for AMI, this has been the first to find a statistically significant age gradient: older patients in Ontario were less likely to receive either AGG or PTCA, even after controlling for co-morbidity. Why would that be so? Greater “frailty” is usually assumed to be the main reason that older patients received invasive procedures less often than their younger counterparts (Gusmano et al., Reference Gusmano, Rodwin, Weisz and Das2007), and it is indeed possible that surgeons or attending physicians are able to detect a general state of frailty that does not receive a secondary diagnostic code and which therefore escaped our attempt to control for age-related clinical differences. However, such an explanation is unlikely to apply only in Ontario, and it is inconsistent with Gusmano et al. who found no age differences in their study of hospitals in Manhattan and Paris once secondary diagnostics were controlled for. Moreover, if frailty were the only reason that older patients in Ontario are less likely to receive PTCA and AGG, we should expect to have observed an even steeper age gradient for bypass surgery (CABG). Since we did not – age differences for CABG were not significant and no clear age pattern was discernable – frailty would seem not to be the main source of the observed age gradient for AGG and PTCA.
Two other plausible explanations for the age gradient come to mind. First, older patients (and their families) might be less likely than their younger counterparts to agree to an invasive procedure (for instance, as suggested in Busschbach, Hessing, & De Charro, 1993, age could be related to lower willingness to stand the pain and risks involved in invasive procedures or to a reduced value of life for a given health state). Second, physicians can use age as a tool to ration care (a phenomenon sometimes described as bedside ageism; Strech, Synofsik, & Marckmann, Reference Strech, Synofsik and Marckmann2008). With limited resources, age could be used to restrict access either on grounds of efficiency (a life saved at age 30 is likely to generate more years of life than one saved at 80) or of equity (younger patients can be seen as more deserving of additional years of life than older ones). If the age of patients is used as a way to ration care, it would show as a decreasing age gradient, consistent with our findings.
While it is not entirely clear why older patients received AGG and PTCA treatments less often than their younger counterparts, we show that part of the explanation lies in the fact that older patients were more likely to be admitted to hospitals that did not have the facilities to provide those procedures. That is consistent with Pilote, Granger, Armstrong, Mark, and Hlatky (Reference Pilote, Granger, Armstrong, Mark and Hlatky1995), who found that the treatment recommended by Canadian physicians depended on the procedures available in the hospital where they worked.
It remains a puzzle why older patients were more likely than their younger counterparts to be hospitalized in settings without intensive surgical facilities. With the data at hand, we have been unable to determine why that would be, but one plausible explanation is that older patients were more likely to be sent home from the emergency room of a hospital that had an invasive surgical facility than from one without, and prescribed only a therapeutic treatment. That is consistent with the lower probability in Ontario than in the U.S. of being admitted after age 85 (Ko et al., Reference Ko, Krumholz, Wang, Foody, Masoudi and Havranek2007), and it suggests that the same process of decision making that explains the age gradient of procedures within hospitals would explain the hospital-specific effect. An alternative explanation would be that paramedics made the decision to assign older patients to hospitals without facilities; another would be that attending physicians preferred to keep older AMI patients at home rather than sending them to the ER. In any event, further investigation is needed to understand the sources of that age pattern of hospitalization for AMI.
While we observed a steep age gradient in the application of these procedures in the treatment of AMI even within hospitals, we were unable to tell whether these disparities were due to age-biased medical decision making by doctors and hospitals or whether they stemmed from patients themselves who might be less inclined to undergo invasive procedures as they get older. However, based on the finding that older patients in both Manhattan and Paris were just as likely as their younger counterparts to receive invasive procedures (after controlling for co-morbidity), our tentative conclusion is that the age pattern in Ontario resulted at least partly from age-based rationing. However, more research is warranted before a firm conclusion on the source of the age gradient can be reached.
It is not clear whether such rationing, if it exists, raises the issue of inequity in terms of outcomes. For patients who would benefit from appropriate therapeutic treatment, there are numerous studies that show that there are only marginal benefits, at best, of invasive procedures, and it could very well be that younger patients receive more invasive procedures than are warranted rather than that older patients receive too few. But the fact remains that age, not just capacity to benefit, seems to be used systematically as a rationing tool. The clinical recommendation is that patients should receive invasive treatment if that would improve their vital prognostic. Since age itself does not affect that prognostic (once co-morbidity and severity are controlled for), the presence of age-based rationing suggests that a non-need criterion is being used. Considerations relating to expected years of life that remain might come into play, or perhaps a “fair innings” perspective is taken, according to which younger patients “deserve” more care than older ones who have already received “their share” of quality-adjusted life years (Williams, Reference Williams1997). If they are used, such rationing criteria should at least be made explicit and discussed. They would seem not to be consistent with the general principles on which the Canadian health care system is built. In any event, we cannot know with certainty that the observed age-pattern of procedures for AMI in Ontario was the result of age-based rationing although that is suggested by the differences in treatment rates between Ontario and other jurisdictions.