INTRODUCTION
In varietal and clonal selection programmes, there has to be a balance between the number of entries that can be tested and the amount of replication of each entry. For a given number of plots available for the trial, we can either test a large number of entries with low replication and therefore low accuracy or fewer entries with more replication and therefore greater accuracy. Choice of the number of replicates by arguments based on the probability of achieving statistically significant differences is inappropriate because it takes no account of the need to test as many entries as possible and, hence, increases the available choice of new entries and the selection intensity.
The more relevant measure of the success of a selection programme is the expected performance of the entries selected at the end of the programme. These issues have been discussed by Finney (Reference Finney1958a, Reference Finney1958b), Curnow (Reference Curnow1961) and Gauch and Zobel (Reference Gauch and Zobel1996) for crops grown on plots harvested in a single year. They considered sequential series of selections in which the varieties were reduced in number each year. The number of initial entries, the number of replicates at each stage and the optimal rate of reduction of the number of entries in the successive years were chosen to maximise the expected value of the varieties chosen at the end of the programme. There were assumed to be no varieties × years interactions.
In this paper, we discuss the planning of single stage clonal selection trials of perennial crops and therefore with harvests from the same plots in successive years. Account is taken of clones × years interactions and a first-order autoregressive model was used to allow for the correlation between the yields from the same plot in different years. The model assumes that the correlations between the results in different years on the same plot are generated entirely by the correlations between results in successive years and that the variances of the plot errors are the same in different years. With the autoregressive model simulation is not needed because a formula can be derived for the expected selection gain in terms of the number of clones tested, the number of replicates of each clone and the number of years of harvest. A comparison of the results from simulation and from the autoregressive model for three cocoa (Theobroma cacao) clonal trials (Owusu-Ansah et al., Reference Owusu-Ansah, Curnow and Adu-Ampomah2013, Reference Owusu-Ansah, Curnow and Adu-Ampomah2017) is discussed; a program in R made available for general use, and some general results presented about the optimal number of entries, replicates and years of harvest in relation to likely values of the relevant components of variation.
MATERIALS AND METHODS
In the paper by Owusu-Ansah et al. (Reference Owusu-Ansah, Curnow and Adu-Ampomah2013), repeated measures analyses were used to estimate the variance components and between years covariances from four years of data on cocoa yields from three clonal selection trials (labelled M2, N4 and D8) in Ghana. The experiments were randomised complete block designs. The unstructured model used in the repeated measures analyses allowed the variances of the plot errors to vary between years and the covariances to be different for all possible pairs of years (MacCulloch et al., Reference MacCulloch, Searle and Neuhaus2008; Maxwell and Delaney, Reference Maxwell and Delaney1990; Richter and Kroschewski, Reference Richter and Kroschewski2006). Using the estimated variances and covariances, simulation of each of the three trials provided information about the best future choices for the number of clones to be tested, given the number of plots used and the effects of differing numbers of years of harvest. The number of clones to be selected at the end of the trial was assumed to be n = 3. Unfortunately, a programming error in the simulations affected the results presented in Figures 1–3 and Table 4 of Owusu-Ansah et al. (Reference Owusu-Ansah, Curnow and Adu-Ampomah2013), and Owusu-Ansah et al. (Reference Owusu-Ansah, Curnow and Adu-Ampomah2017) gave the correct results.
Herein, a formula is developed for calculating the expected gain in the mean performance of selected clones over years when a more restricted first-order autoregressive model for the dependencies between the plot errors in different years is assumed. The data from one of the three clonal trials is analysed using the first-order model and the results are compared with those obtained from simulation using the unstructured model. The selection gains predicted by the two models when the best three clones are chosen at the end of the trial are then compared for varying numbers of clones, blocks and years of harvest. Using the first-order model, optimal values are derived for the number of clones to test, the number of replications and the number of years of testing for a range of values of the relevant variance and covariance components.
RESULTS
Calculating the selection gain
We shall assume that the design used is a randomised complete block design. The yield y of clone i on plot j in block k and year l will be written as
 $$\begin{equation}
{y_{ijkl}} = {c_i} + {(cb)_{ik}} + {(cy)_{il}} + {e_{ijkl}},
\end{equation}$$
where ci is the clone effect; (cb)ik is the clone × block effect; (cy)il is the clone × year effect; and eijkl is the plot error for clone i, block j and year l. The general mean and the main effects of blocks, years and the interactions of blocks and years can be ignored in calculating the expected gains from the selection programme since each variety occurs in each block and year, and selection is based on comparisons of the performances of the clones. The effects ci, (cb)ik and (cy)il are assumed to be independently normally distributed with zero means and variances σ2c, σ2cb and σ2cy, respectively. For tabulation purposes, we can standardise the scale of the yields so that σ2c = 1 and so the values of the other variance components are relative to the clone variance. The error eijkl will be assumed to be normally distributed with variance σ2e and subject to first-order autoregressive correlations (MacCulloch et al., Reference MacCulloch, Searle and Neuhaus2008; Richter and Kroschewski, Reference Richter and Kroschewski2006) so that the correlation between errors on a plot d years apart is ρd. The selection will be based on the total yields of the clones over the years of harvest.
Because of the first-order autoregressive model for the plot errors in different years, the variance of the total of the errors for a single plot, yijk, over t successive years is
 $$\begin{equation}
{\rm{\Sigma }} = \sigma _e^2\left( {2\sum\nolimits_{x = 0}^t {\left( {t - x} \right){\rho ^x} - t} } \right),
\end{equation}$$
 $$\begin{equation}
{\rm{\Sigma }} = \sigma _e^2\frac{{t\left( {1 - {\rho ^2}} \right) + 2\left( {{\rho ^{t + 1}} - \rho } \right)}}{{{{\left( {1 - \rho } \right)}^2}}}.
\end{equation}$$
In the extreme case of complete correlation of the plot errors in different years, ρ = 1 and Σ = σ2et 2. With no correlation between plot errors in different years, ρ = 0 and Σ = σ2et. Other patterns of correlations between plot errors in different years can be investigated by calculation of the variance of the total of the errors, Σ, as the sum of all the elements in the variance-covariance matrix of the yields of a plot in the different years of harvest. The expected average yields of the best n of the N clones tested will be
 $$\begin{equation}
\sqrt {{\rm{Var}}({y_{i \ldots }})} k\left( {n;N} \right) = \sqrt {\sigma _c^2 + \frac{{\sigma _{cb}^2}}{b} + \frac{{\sigma _{cy}^2}}{t} + \frac{{\rm{\Sigma }}}{{b{t^2}}}} k\left( {n;N} \right),
\end{equation}$$
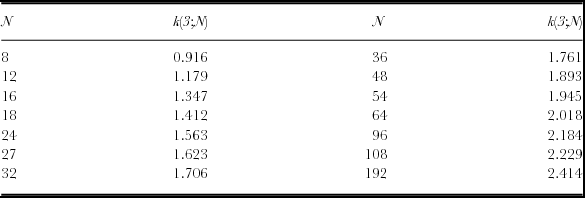
where yi. . . is the average yield of a clone, b and t are the number of blocks and years, respectively, and k(n;N) is the average of the expected values of the highest n values in a sample of size N drawn from a standard normal distribution (Pearson and Hartley, Reference Pearson and Hartley1972). Table 1 shows the values of k(3;N) that will be used later in this paper.
Expected value of the average of the three highest values k(3;N) in a sample of size N from a standard normal distribution.

By a regression argument, the expected gain in the average value of ci for the best n of N clones selected on the basis of the yields over t successive years, yi. . ., will be
 $$\begin{equation}
E\left( {{\rm{Gain}}} \right) = \left[ {\frac{{{\rm{Cov}}\left( {{c_i},{y_{i \ldots }}} \right)}}{{{\rm{Var}}\left( {{y_{i \ldots }}} \right)}}} \right].\sqrt {{\rm{Var}}\left( {{y_{i \ldots }}} \right)} k\left( {n;N} \right).
\end{equation}$$
Hence,
 $$\begin{equation}
E\left( {{\rm{Gain}}} \right) = \frac{{\sigma _c^2}}{{\sqrt {\sigma _c^2 + \frac{{\sigma _{cb}^2}}{b} + \frac{{\sigma _{cy}^2}}{t} + \frac{{\rm{\Sigma }}}{{b{t^2}}}} }}k\left( {n;N} \right),
\end{equation}$$
where σck(n; N) provides the upper bound to the selection gains when the variance components, i.e. σ2cb, σ2cy and Σ, are all zero.
The available R program requires input of the variance components σ2c, σ2cb, σ2cy, σ2e; the plot correlation coefficient ρ; the total number of plots Nb (≤192), the value of n and the number of clones to be selected. The output gives the values of the standardised upper bounds, k(n;N), and the values of E(Gain) for specified values of the number of blocks, b, and the number of years harvested, t. The output shows the dependence of the expected gains on the values of b and N and, hence, provides the values of b and N that maximise the expected gain. The effects of increasing the number of years harvested, t, can also be studied.
Variance and covariance parameter estimates for the unstructured and first-order autoregressive models applied to trial M2
Yield was defined as the total number of pods and, to more nearly satisfy the assumptions of the analyses, is measured on a square root scale. The estimate from the unstructured repeated measures analysis of the clones × years variance component relative to a unit variance for the clone variation was 0.28. The average plot error variance plus the blocks × clones variation between successive years was 0.87 and the average correlation of the plot errors plus the clones × blocks variation between successive years was 0.55. An analysis based on the first-order autoregressive model provided estimates of the variances and correlation, again relative to a unit variance for the clonal variation, of 0.28 for clones × years; 0 for clones × blocks; 0.82 for plot errors and a correlation of plot errors between successive years of 0.54. These are close to the average values from the unstructured analysis.
Estimates of the expected selection gains for the unstructured and the first-order autoregressive models
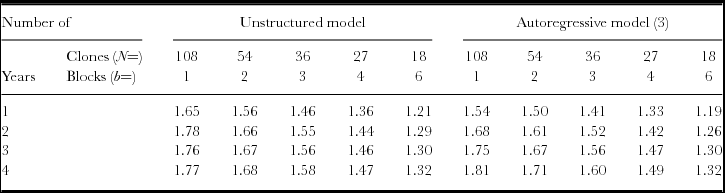
Expected gains on the square root scale for the two models using 10,000 simulations for each case of the unstructured model and equation (6) for the first-order model are shown in Table 2. We assumed that the best three clones are selected at the end of the trial and we choose n = 3 rather than n = 1 because more than one clone is very likely to be forwarded to the next stage of observation and selection. The expected gains are shown for the actual number of clones tested in the trial, 18, and for all possible numbers of more clones with fewer replicates and for up to four years of harvest. The expected gains are generally slightly higher for the unstructured model. As expected the gains generally increase with the number of years of harvest. The very marginal exception is that because the error variances – assumed constant in the autoregressive model – increase over the four years in the unstructured model, the highest expected gains when all the clones are tested with the unstructured model occur with just two years of harvest. As shown in Table 2, the highest expected gains are always achieved with both models when all the clones are tested with a single replicate. However, the gains are such that the need for replication to estimate the variance components and the possibility of missing values making the testing of all the clones impossible would suggest that testing half the clones with two replicates each would be advisable. The two methods of analysis provided similar conclusions concerning the optimal programmes for the other trials, N4 and D8. Hence, in these cases, the equation based on the first-order model can safely be used to derive optimal programmes.
Estimates of the gains in clonal standard deviation units for square root yields in trial M2, Nb = 108 for varying numbers of clones tested N including the actual design (N = 18, b = 6) derived by using simulations of the unstructured repeated measures model and from the first-order autoregressive model – equation (6).

Relation of optimal values of N and b to the values of the variance components and the between year plot correlations with Nb fixed at 96
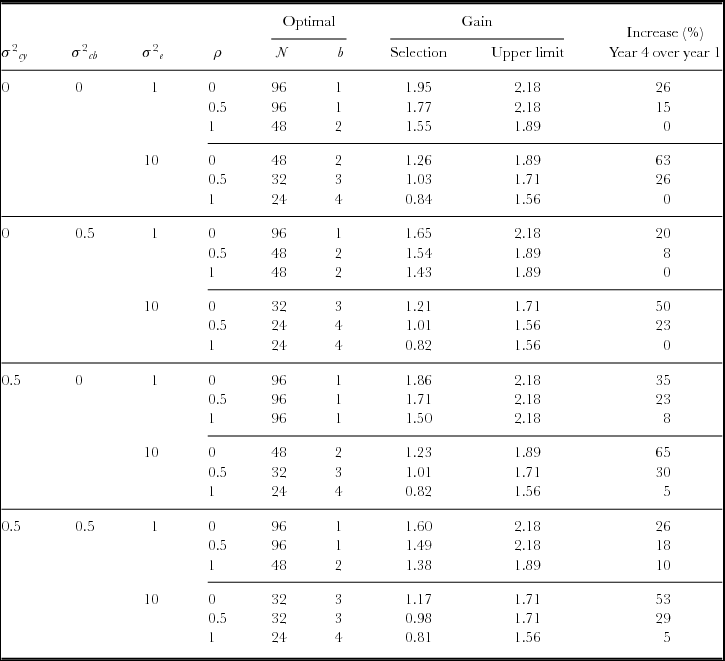
As an example, the equation for the first-order model is now used to derive optimal designs for a fixed number of plots (Nb = 96 plots) and for some chosen values for the components of variation (σ2c = 1, σ2cb, σ2cy, σ2e, ρ). Table 3 shows the optimal values of N and b and the expected average gains of the three best performing clones, n = 3, if the selection is based on the average performance over four years. The optimal values of N and b are unlikely to be much affected by the choice of the number of clones selected, n. All possible values for the number of blocks were studied. The expected gains will always increase with the number of years of harvest in the trial except in the unlikely situation that there are no clones × years interactions and there is perfect correlation, ρ = 1, of the plot errors in successive years. The three values chosen for each of the variance components for clones × years, clones × blocks, plot errors and the correlation of plot errors were chosen to span a wide range and should allow reasonably accurate interpolation for likely intermediate values.
Optimal values of the number (N) of clones to be tested when the best n = 3 clones are selected based on four years of harvest; the corresponding selection gains and upper limits of gains both in clonal standard deviation units; and the increase (%) of gains from four years compared to one year of harvest.

Number of plots Nb = 96 and σ2c = 1.
In addition to the optimal values of N and b and the corresponding selection gains, the upper limit of selection gains corresponding to no errors in assessment and the percentage increase in selection gain from four years of harvest compared with one year are shown in Table 3. The optimal values of N for four years of harvest generally decrease as ρ increases because the additional information from the plots in the different years reduces as ρ increases. The optimal values of N decrease as σ2e or σ2cb increases because more blocks are needed to achieve the same level of accuracy in estimating the clone yields. The optimal values of N are little affected by the existence of the clones × years variance component of 0.5.
The increases in the gains from having four years of harvest using the appropriate optimal number of clones, N, compared to a single year decrease with increasing ρ or increasing σ2e; decrease with increasing σ2cb; and increase slightly with increasing σ2cy. For obvious reasons, there is no advantage from the extra years if there are no clones × years interactions and the plot errors in successive years are perfectly correlated. When there are no clones × years interactions and the plot errors in successive years are uncorrelated, the extra years are equivalent to extra blocks.
An example of expected selection gains for varying values of N, b and t with Nbt fixed at 192
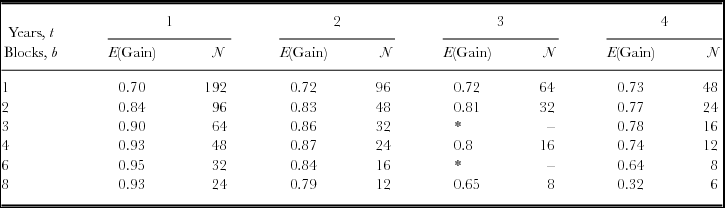
The constraints on resources may be more closely related to the number of plots times the number of years, Nbt, rather than Nb. These will be particularly true if parallel trials are being run with each year having one trial in each of the possible t years. As an example of the results that can be obtained, the expected gains for combinations of numbers of years and numbers of blocks with Nbt = 192 and σ2c = 1, σ2cb = 0.5, σ2cy = 0.5, σ2e = 10, ρ = 0.5 are shown in Table 4. For these relatively high plot residual and clones × years variances, the optimal choice is N = 32, b = 6 and t = 1. However, more than one year of harvest may be advisable to estimate and study the stability of the clonal differences over years and as the clones grow. The speed of further testing and consequent introduction into commercial practice of the new clones will be another factor in choosing the number of years that the trial should last.
Expected gains when Nbt = 192 for varying numbers of blocks, b, and years, t.

σ2c = 1, σ2cb = 0.5, σ2cy = 0.5, σ2e = 10, ρ = 0.5. *Non-integral N.
DISCUSSION
Two assumptions have been made in the calculation of the expected gains. The first assumption is that increasing the number of clones to be tested does not reduce the quality of the clones. Second, that there is insufficient information to choose the clones for testing from those available on the basis of their likely superior performance. In the early screening stages of clonal selection, these assumptions are likely to be reasonable approximations. If the optimal number of clones that should be tested exceeds the number available, then the cost of producing more clones for testing needs to be considered. The third assumption is that increasing the number of clones tested does not increase the plot error variances despite the larger block sizes. In practice, the designs are likely to be incomplete block or lattice designs (Mead et al., Reference Mead, Gilmour and Mead2012) and adjustments based on models for the spatial variation are used to reduce the effects of larger blocks (Gilmour et al., Reference Gilmour, Cullis and Verbyla1997; Stroup et al., Reference Stroup, Baenziger and Mulitze1994). The expected gains near the optimal will often not be strongly related to the number of clones tested and, hence, there is flexibility in choosing the number of clones to help in the choice of the best design.
The value of the clones × blocks interaction variance component will depend greatly on whether the clones are being tested at one site to evaluate their likely performance at only that site or at dispersed sites so that the selection can be in terms of average performance across dispersed sites. The optimal planning of future trials clearly depends on having available appropriate estimates of the likely variance components, increasing the importance of thorough analysis of all trials that may be relevant. Trials in which the optimal number of blocks is b = 1 should perhaps be avoided and two blocks run so that the data can be analysed and variance components estimated. Trials with just one year of harvest should perhaps be avoided for the same reason and also to provide some evidence about the stability of the relative performance of the clones over years, addressing aging.
The number of clones to be selected at the end of the trial will often, and certainly in the later stages of the breeding programme, be based on comparisons with the performance of standard clones included in the trial. The effects of the selection on correlated characteristics of the clones and the use of selection indices can be studied by simulating with the unstructured model (Owusu-Ansah et al., Reference Owusu-Ansah, Curnow and Adu-Ampomah2013) and by modifying the regression equations with the first-order model.
Despite the assumptions that have had to be made and the need to have available estimates of the likely sizes of the various variance components, we believe that the use of the predicted selection gains can lead to more efficient selection programmes in terms of number of clones tested, number of replicates and number of years of harvest.
Acknowledgements
This paper (CRIG/03/2015/047/002) is published with the permission of the Executive Director of the Cocoa Research Institute of Ghana. F. Owusu-Ansah acknowledges the financial support of the Rothamsted International African Fellowship Programme, Dr G. Lockwood for providing the data and answering queries, and the Department of Mathematics and Statistics of the University of Reading for providing office and computing facilities. We are grateful for helpful comments from the editor and referees.