I. INTRODUCTION
The observation of large piezoelectric responses near the Morphotropic Phase Boundaries (MPBs) of [Pb(Zn1/3Nb2/3)O3]1−x –[PbTiO3] x , lead zinc niobate–lead titanate (PZN–PT), [Pb(Mg1/3Nb2/3)O3]1−x–[PbTiO3] x , lead magnesium niobate–lead titanate (PMN–PT), and Pb(Zr1−x Ti x )O3,lead zirconate titanate (PZT) systems has drawn significant research attention to understand their physical origins. Reference Park and Shrout1–Reference Davis, Damjanvoic and Setter3 Investigations on (1 − x)PZN–xPT, (1 − x)PMN–xPT, and (1 − x)PSN–xPT revealed that the MPB compositions exist as multiphase systems. Reference Park and Shrout1–Reference Bormanis, Burkhanov, Shil'nikov, Sternberg, Satarov and Kalvane9 Neutron and high-resolution synchrotron x-ray diffraction studies of Haumont et al. Reference Haumont, Al-Barakaty, Dkhil, Kiat and Bellaiche4 revealed the existence of an additional monoclinic (M) phase in addition to the known rhombohedral (R) and tetragonal (T) at the MPB composition range of (1 − x)PSN–xPT (x = 0.41–0.55). Reference Haumont, Al-Barakaty, Dkhil, Kiat and Bellaiche4 The influence of coexistence of R, M, and T phases on spontaneous polarization has also been discussed by the authors. Reference Haumont, Al-Barakaty, Dkhil, Kiat and Bellaiche4 Similar studies on PZN–xPT and PMN–xPT crystals revealed coexistence of rhombohedral and tetragonal domains at room temperature (RT). Reference Uesu, Yamada, Fujishiro, Tazawa, Enokido, Kiat and Dikhil10–Reference Ye and Dong12 However, later studies on these systems indicated the presence of a third ferroelectric [monoclinic (M) or orthorhombic (O)] phase which acts as a ‘bridge’ between ferroelectric R and T phases. Reference Xu, Luo, Xu and Yin5,Reference Cox, Noheda, Shirane, Uesu, Fujishiro and Yamada6
The stabilities of different phases in such MPB systems depend on the electrical, mechanical, and thermal conditions. Changes of temperature, electric field, and stress lead to polarization switching as well as phase transition in these crystals and hence dramatically alter their electromechanical property. The electric field-induced R–M–T phase transition has been reported in PZN–PT and PMN–PT systems. Reference Liu, Park, Shrout and Cross13–Reference Chien, Schmidt, Tu, Hung and Luo15 The temperature-dependent polarized light microscopic investigations on PMN–xPT revealed that the R–T phase transition occurs by rotation of polarization through M phases. Reference Schmidt, Chien, Shih and Tu16,Reference Tu, Chien, Wang, Schmidt and Han17 Han and Cao Reference Han and Cao18 reported that the application of electric field along <001> decreases the R–T phase transition temperature of PMN–PT. Structural studies of Haumont et al. Reference Haumont, Al-Barakaty, Dkhil, Kiat and Bellaiche4 indicated that the monoclinic phase of MPB compositions of lead scandium niobate–lead titanate (PSN–PT) transforms to cubic phase around 272 °C, which is well above its ferroelectric transition temperature. The variable temperature Raman spectroscopic studies on the PSN–42PT single crystal show appearance of several weak modes below 27 °C while no significant change in modes even above ferroelectric transition temperature. Reference Rajasekaran, Sivasubramanian and Jayavel19 These observations suggest the transition may be related to the reorientation of polar domains at MPB composition. Moreover, the phase transitions with reorientation switching of domains induce structural heterogeneity in the crystals and the nature and orientation of the polar ferroelectric domains control their properties. Reference Tu, Chien, Wang, Schmidt and Han17,Reference Han and Cao18,Reference Zeng, Yu, Hui, Li, Luo and Yin20,Reference Bai, Li and Viehland21 Thus the understandings of domain structure and their behavior are essential to achieve a material with desired properties. Reference Park and Shrout1 However, studies on the nature and orientation of domains and their relations to phase transitions are still obscure for PSN–42PT. Piezoresponse Force Microscope (PFM) and polarized light microscopy (PLM) being suitable techniques to explore domains and their variations at the transition temperature, they have been used to explore micro- to nanoscale domains in ferroelectric materials. Reference Zeng, Yu, Hui, Li, Luo and Yin20 The analyses of the contrast between domains and extinction conditions provide important information on the symmetry and orientation of polar domains. The procedure and scope of PFM and PLM have been explained while explaining the results of the present study.
In the present study, in situ variable temperature PLM has been used to investigate the growth of microdomains in PSN–42PT single crystal. The structural transitions have also been investigated by in situ high-temperature powder XRD. The transition from monoclinic to cubic lattice through an intermediate tetragonal lattice has been concluded. The phase transition behavior is correlated to its dielectric properties. The details of the results are explained in the text of this article.
II. EXPERIMENTAL
Single crystals of PSN–42PT were grown by high-temperature flux growth method as reported earlier in literature. Reference Rajasekaran, Singh and Jayavel22 Lead monoxide (PbO), titanium dioxide (TiO2), niobium pentoxide (Nb2O5), scandium oxide (Sc2O3), and boron trioxide (B2O3) (all from Aldrich, 99% purity) were used as starting materials for the crystal growth. A homogeneous mixture of 75 mol% PbO and 25 mol% of B2O3 was used as flux for crystal growth. About 70 g of homogenous mixture of appropriate amounts reactants for the composition 25 mol% of PSN–42PT and 75 mol% of flux was loaded in a 40 cc platinum crucible. The platinum crucible was covered with a lid and placed inside an alumina crucible. The platinum crucible was covered with alumina powder and covered with an alumina lid. The alumina crucible and lid were sealed by using alumina cement. This sample assembly was heated to 1180 °C at a rate of 5 °C/min and soaked for 5 h placed in a muffle furnace. The furnace temperature was then decreased at a rate of 1 °C/h up to 1030 °C and then at a rate of 100 °C/h up to room temperature. The crystals were separated from the molten mass by mechanical fragmentation and then cleaned by boiling in dilute acetic acid. Cube and platelike crystals having length between 1 and 4 mm and well developed flat surfaces were selected for further studies.
The powder XRD data of the sample were recorded on Panalytical X-Pert pro diffractometer equipped with Anton Par HTK attachment using Cu Kα (Kα1 = 1.5406 and Kα2 = 1.5444 Å) radiation. Finely powdered sample of PSN–42PT was smeared on the platinum heater and heated to the desired temperature and held for 5 min before data collection. Data at ambient and 400 °C were collected in step scan mode with step width and time as 0.02°, 3 s. Selected characteristic reflections were scanned in a series of temperatures to observe phase transformation systematically. The diffraction data were analyzed using Fullprof-2000 software package. Reference Rodriguez-Carvajal23
Thin platelike crystal with thickness of 100 μm was prepared by polishing a well shaped crystal of (001) PSN–42PT crystal. One of the flat surfaces of the crystal was electroded by silver paste and glued to the scanning force microscope (SFM; Model-SOLVER PRO-P47, NT-MDT Co., Zelenograd, Russia) sample holder. The uncoated surface of the crystal was subjected to SFM tip scanning. SFM images were observed in the piezoresponse mode using commercially available equipment (Topometrix Corporation, Santa Clara, CA). The scan was performed at room temperature with a SFM tip. The dielectric measurements at different temperatures and frequencies were carried out using an automated HP4194A impedance analyzer (Agilent Technology, Santa Clara, CA). The measurements were carried out during heating at the rate of 1 °C/min. Optical polarizing microphotographs were recorded by using Olympus BX50 polarizing microscope and C7070 digital camera (Olympus Corporation, Tokyo, Japan). A Linkam THMS heating stage with TMS 94 temperature programmer was used as a sample holder.
III. RESULT AND DISCUSSION
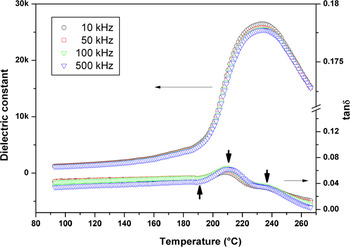
The typical temperature-dependent dielectric constant and loss factor of the PSN–42PT single crystal measured across the (001) plane is shown in Fig. 1. The paraelectric to ferroelectric phase transition is visualized as a peak around 234 °C in temperature-dependent dielectric constant. The variation of loss tangents show multiple peaks around 190, 210, and 235 °C (shown by up-and-down arrows in Fig. 1). These are in agreement with the results reported in Ref. 22. These multiple peaks suggest multiple relaxation process in PSN–42PT single crystal sample. The origin of such multiple relaxations can be attributed to the possible existence of compositional or structural heterogeneity in the single crystal.
Variation of dielectric constant and loss factor of PSN–42PT single crystal with temperature. The up and down arrows indicate positions of peak relaxations.

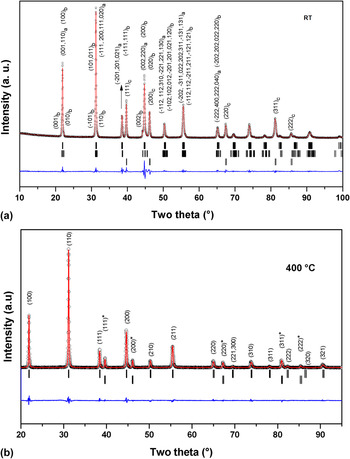
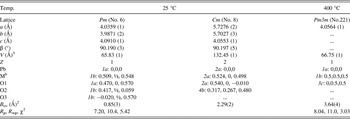
The powder XRD data of PSN–42PT recorded at ambient temperature (RT) shows a closely similar pattern as that of a typical perovskite lattice. However, the (200), (220), and (311) peaks of perovskite lattice are appreciably broader in PSN–42PT. The broadening in (h00) and (hh0) pseudocubic reflections for analogous MPB systems have been attributed to the presence of a lower symmetry phases. Reference Singh and Pandey24 Such anomalous broadening observed in the XRD data of PZT has been attributed to the presence of nanosize domains. Reference Corker, Glazer, Whatmore, Stallard and Fauth25 Small displacement of cation or anion can lead to these structural changes. These features are often difficult to investigate. In particular, in a system with heavy atoms, like lead and highly disordered octahedral cations as in the present case, the structural studies on feeble and distorted perovskites are extremely complex. Thus the chemical and physical properties are often used as essential information to understand their structural properties. Further the system under study PSN–42PT being a relaxor ferroelectric, a feeble deviation in chemical composition as well as compositional and structural heterogeneity in microregion can exist. For accounting the peak profile of the observed XRD data of PSN–42PT, the refinement of the XRD pattern was carried out by considering different symmetries, like tetragonal (P4mm), rhombohedral (R3m), and monoclinic (Pm and Cm). The structural details reported by Singh and Pandey for Pm and Cm phases of PMN–xPT Reference Singh and Pandey24 were used as an initial model for the analyses of the XRD data. The profile of the XRD data could be satisfactorily modeled by using two monoclinic lattice (Pm and Cm) together and appreciably good fit between the observed and calculated profiles confirms the coexistence these two phases. Fig. 2(a) depicts the observed, calculated and the difference of profiles of the XRD data for PSN–42PT at RT. In a similar manner, the profile of XRD patterns recorded at higher temperatures was also analyzed. The powder XRD data recorded at 400 °C shows cubic (Pm3m) lattice, with unit cell parameter: a = 4.0564(1) Å. This suggests that at higher temperature, the ambient temperature monoclinic lattices transform to the primitive type cubic lattice. The final Rietveld refinement patterns of the XRD data recorded at 400 °C are shown in Fig. 2(b). The details of structural parameters of ambient and HT phases are given in Table I.
(a) Powder XRD results of the PSN–42PT recorded at ambient temperature on platinum stage. The vertical lines from the top to bottom are: Monoclinic (Cm), monoclinic (Pm), and platinum (Pm3m) base metal of the heater (hkl's are marked for prominent peaks). (i). Monoclinic (Cm): a = 5.7276 (2), b = 5.7027 (3), c = 4.0553 (1) Å, β = 90.197 (5)°.(ii). Monoclinic (Pm): a = 4.0359 (1), b = 3.9871 (2), c = 4.0910 (1) Å, β = 90.190 (3)°.(iii). Cubic (Fm3m): a = 3.9269 Å (platinum base metal). (b) Powder XRD results of the PSN–42PT recorded at 400 C on platinum stage. The vertical lines from the top to bottom are: Cubic (Pm3m) phase and platinum (Fm3m) base metal of the heater (hkl's are marked). Cubic (Pm3m), a = 4.0564(1) Å. (*Platinum, Cubic:Fm3m, a = 3.9375(1) Å).

Typical structural parameters of PSN–0.42PT. a

a Position coordinates are taken from Ref. 24.
b M: Sc:Ti:Nb, occ. 0.25:0.25:50.
All the above mentioned structures of perovskite phases have resulted from the feeble distortion or tilting of the octahedral units of the undistorted parent cubic (Pm3m) perovskite structure. Thus the distorted structures are closely related to the parent aristotype (nonpolar, Pm3m) perovskite structure. Often the deviations of the unit cell parameters from the parent (Pm3m) structure are too small but they can exhibit drastically altered physical properties. The lattice distortions in the tetragonal (P4mm), rhombohedral (R3m), monoclinic (Pm and Cm) polar perovskite are due to the stretching of the parent nonpolar cubic lattice along different directions, viz. stretching the Pm3m lattice, along <001> direction leads to P4mm (a t = b t ≠ c t, α = β = γ = 90); along the <111> direction leads to R3m (a r = b r = c r, α = β = γ ≠ 90). The monoclinic (Pm and Cm) structures can be related to the tetragonal P4mm structure in a similar manner. Feeble deviations of the <100>, <010>, and <001> directions of the tetragonal structure lead to monoclinic Pm structure, which is a pseudoorthorhombic structure. The Cm structure is related to the tetragonal structure as by an alternate unit cell selection with a- and b-axes oriented along the <110> direction of the latter structure. Thus, the Pm, Cm, and P4mm structures are related as: a pm ∼ b pm ∼ c pm ∼ a t ; c cm ∼ c t ; a cm ∼ b cm ∼ a t √2, c cm ∼ c t , where subscripts pm, cm, and t indicate the monoclinic and tetragonal unit cell. Such structural distortions are reflected in the rotation of polarization axis. The polarization direction in the P4mm and R3m are oriented along the <001> and <111> directions. As the structure transforms from tetragonal to monoclinic Pm or Cm, the polarization directions points along the <011> direction or <110> directions. The polarization directions of the various unit cells are explained later in this section.
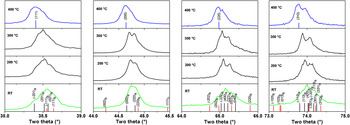
The analysis of the XRD patterns recorded in between ambient and 400 °C suggests a sequential structural evolution in PSN–42PT. Figure 3 shows the temperature evolution of some characteristic reflections. When the temperature reached 200 °C, the profile of (200), (220), and (311) reflections composed of multiple peaks turns narrower but still remain asymmetric. We could not detect the Pm3m phase in our x-ray profile recorded at 300 °C, i.e., beyond the T c (234 °C). The powder XRD pattern observed at 300 °C was analyzed by considering different structural models as in the case of the ambient temperature XRD studies. The observed XRD pattern could be modeled by considering monoclinic (Pm) and tetragonal (P4mm) phases together. The refined unit cell parameters of tetragonal (P4mm) phase are: a = 4.0407(3), c = 4.0461(3) Å, V = 66.06(1) Å3 and those of monoclinic (Pm) phase are: a = 4.0441(2), b = 4.0212(3), c = 4.0731(6) Å, β = 90.02(1)°, V = 66.24(1) Å3. The refined powder XRD pattern recorded at 300 °C is shown as a supplementary data (S-I) to this article. The XRD results indicate that the tetragonal phase is formed due to the destabilization of monoclinic phases. Thus the monoclinic to cubic transition of PSN–42PT proceeds though an intermediate adaptive tetragonal phase. The broadened peaks observed at 200 and 300 °C (Fig. 3) are due to the mixed state of Pm phase and tetragonal nanotwins. The structural phase transition from Pm to P4mm phase is really a transition from a small (nano)domain tetragonal phase to a large (macro) domain tetragonal phase. Reference Jin, Wang, Khachaturyan, Li and Viehland26 The large domains correspond to a sharp and well-resolved peak profile, which allows diffraction measurement to discern the tetragonal lattice. Reference Noheda, Cox and Shirane27 Earlier, Raman spectroscopic measurements on PSN–42PT have also revealed an intermediate phase beyond T c, which has been attributed to the structural and/or chemical inhomogeneities in the crystal. Reference Rajasekaran, Sivasubramanian and Jayavel19 From the present XRD studies it can be suggested that the monoclinic phase of PSN–42PT transforms to a cubic phase through a tetragonal intermediate phase. Thus polar to nonpolar structural transition in PSN–42PT is sequential as: Cm + Pm → Pm/T → Pm3m. Further to correlate the structural transitions the PFM and PLM studies on the single crystal samples were carried out and they are explained below.
Temperature evolution of the powder XRD profiles of (111), (200), (220), and (311) pseudocubic reflections of PSN–42PT (hkl's are marked in upper and lower panel, subscripts a and b are for Cm and Pm phases, respectively).

The scope of the PFM to study the nanodomains of the ferroelectric materials has been reported earlier in several reports. Reference Shvartsman and Kholin28,Reference Balke, Bdikin, Kalinin and Kholkin29 The electromechanical coupling of the ferroelectric domain due to the applied alternating electric field between sample and counter electrode is sensed by the vibration of the tip of PFM probe. The intensity and phase of the vibrations are related to the strength of piezoelectric coefficient and orientation of polarization in the domains. Thus, the contrast in the PFM images represents the polarization distribution of the sample.
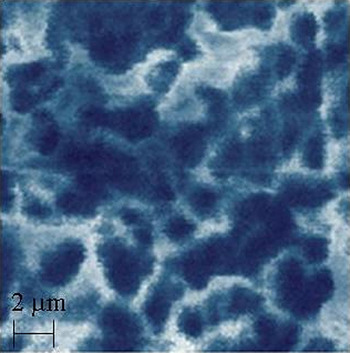
The PFM topograph of the PSN–42PT crystal (shown in Fig. 4) indicates irregular shaped polar nanodomains (PND). The observed contrasts in the PFM topograph (Fig. 4) are black due to the out-of-plane component of polarization (P┴) and white due to the component of polarization along the same directions (P║). The irregular PNDs as observed in the PFM micrograph are due to the existence of short-range ordered structures of relaxor states, which are manifested in the formation of nanoscale polar region (polar clusters). Further the nanodomains observed in the present case are different from those reported for tetragonal or rhombohedral domains, Reference Bai, Li and Viehland21 where spindle or wavelike domains have been observed in longer length scale. Thus, it can be suggested that the observed domain patterns are different from the tetragonal or rhombohedral phases.
PFM image for (001)-oriented PSN–42PT crystal.

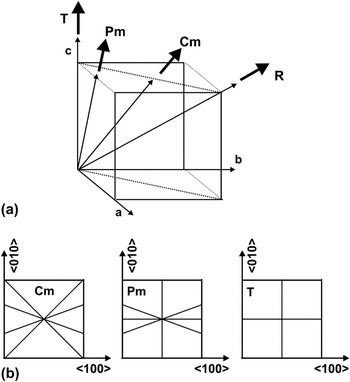
Similar to the PFM, the PLM also provides information on the existence of polar domains and the orientation of polarization in the domains. In the polar materials, the vibration of the domains due to the electric field of light can produce interference pattern and extinction under the crossed polars (vibration of polarizer (P) and analyzer (A) are mutually perpendicular) of the microscope. In general the extinction pattern and angle of rotation of the polars are used for studying the crystal symmetries. The domains show extinct (dark) when the vibration directions of the domains are similar to that of the crossed polars of the microscope. Thus, the information on the extinction pattern provide the information on symmetry of the optical indicatrix axis and hence on the direction of polarization. The extinction pattern expected for different symmetries of the perovskite structure materials have been explained earlier in several literature. Reference Haumont, Al-Barakaty, Dkhil, Kiat and Bellaiche4,Reference Chien, Schmidt, Tu, Hung and Luo15,Reference Noheda, Cox and Shirane27,Reference Chien, Tu, Schmidt and Wang30–Reference Bokov, Long and Ye32 As mentioned earlier, the polarization direction hence their optical indicatrix axes of the uniaxial P4mm and R3m structures are oriented along the <001> and <111>, while those of the biaxial Cm and Pm structures are oriented along <110> and <011> directions. The directions of polarization in various symmetries are shown in Fig. 5(a). The typical extinction positions for the symmetries relevant for the present studied system under a crossed polar (P/A = 90°) are shown in Fig. 5(b). As shown in Fig. 5(b), the tetragonal and rhombohedral systems will show extinction when polars are at 90 and 45°. Similarly the extinction positions for Cm and Pm are at the rotations of 90 + θ, where θ ≠ 0 or 45° [Fig. 5(b)]. Reference Chien, Tu, Schmidt and Wang30
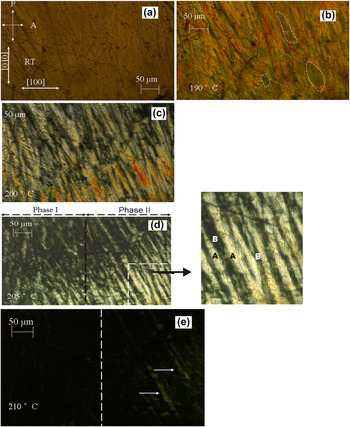
Figure 6(a)–6(e) show the domain micrographs of PSN–42PT system recorded at various temperatures with P/A angle = 90°. The presence of complex domain structure with domain sizes much smaller than the thickness of the crystal can be seen from the RT domain micrographs [Fig. 6(a)]. The observed brightness of the crystal under a condition when polars are at an angle 90° and 45° suggests the absence of domains of T and R phases but the presence of low symmetry structures at RT. As shown in Fig. 5(b), the monoclinic phases may not show extinction as the angle between projections of the optical indicatrix can have any value. In the present case, the existence of distributed optical indicatrixes as in the case of monoclinic Pm or Cm phase can be concluded from the observed larger numbers of extinction angles.
Polarization rotation path for the various symmetry of perovskite phases of the PSN–xPT system (a), possible extinction positions in (001) crystal plate (b).

Domain pattern of (001) PSN–42PT single crystal at various temperatures while heating under crossed polarizer at δ = 90°: (a) RT, (b) 190°C, (c) 200°C, (d) 205°C, (e) 210°C. (Different types of polar nanodomains (PNDs) are indicated by dotted area in Fig. 6(b), Enlarged portion of Fig. 6(d) show a typical Pm type domain).

Further as the temperature increases the domain matrix exhibits birefringence and they are clearly observed in the present PLM micrograph recorded at higher temperature [Fig. 6(b)]. Besides, different orientations of optical indicatrix are observed as distinct areas (shown as dotted area) in Fig. 6(b). With increasing temperature further (200 °C), we note that the strips are arranged in striation along <110> [Fig. 6(c)]). Though such domain patterns are persistent in the micrographs recorded at temperatures 200 and 205° [6(c) and 6(d)], an apparent change is observed at 205 °C compared with that at 200 °C. Further the contrast is clearly seen in Fig. 6(d), where slightly varying compositions of PSN–42PT crystal are reflected as two phases. This change coincides with the dielectric loss anomalies shown in Fig. 1. Jin et al. Reference Jin, Wang, Khachaturyan, Li and Viehland26 have indicated that the M phase is a mixed state of miniaturized domains and is inhomogeneous on the nanoscale while being homogeneous on the macroscale. Further, the observed domains of the crystal at the corner [enlarged portion of Fig. 6(d)] are similar to those reported for Pm phase in PMN–PT Reference Bokov and Ye31 and PZT. Reference Bokov, Long and Ye32 Thus, they can be assigned to monoclinic Pm phase of PSN–42PT. The observed change in the domain can be interpreted as a result of Cm → Pm phase transition of PSN–42PT. This difference is more clearly reflected in Fig. 6(e) (marked by vertical dotted line to distinguish the regions, left hand side of the vertical line is phase-I and right hand side of the vertical line is phase-II). In Fig. 6(e) (at 210 °C), the phase-I appear as completely extinct (tetragonal) and while phase-II has some weak birefringent domains (Pm) (pointed by arrows).
From the optical micrographs, it is suggested that the polar domains observed below 200 °C are due to polar monoclinic phase while those observed at higher temperature are due to predominantly transformed tetragonal and feeble amounts of Pm phase. This observation is consistent with the tetragonal and monoclinic phase concluded from the high temperature XRD studies at 300 °C. Thus the phase transitions in PSN–42PT follow the Cm + Pm → Pm/T → Pm3m transition sequence in.
IV. CONCLUSION
In conclusion the temperature-induced monoclinic to cubic transition through a tetragonal phase is observed in unpoled (001) PSN–42PT single crystal. Temperature-dependent peak splitting and profile shape of the reflections of the powder XRD pattern suggested the transformation proceeds sequentially through an intermediate phase. The irregular shaped polar nanodomains observed by PFM supports the relaxor nature of PSN–42PT. The transformation of Cm + Pm phases to Pm + T has been observed around 200 °C in PLM and XRD studies. The monoclinic phase Pm might be an intermediate state between the Cm and T phase.