Introduction
Corn traces its origins back 9000 years to Mexico, evolving through a human selection of teosinte traits (Smith et al., Reference Smith, Trevisan, McCunn and Huffman2022). Over time, the ancestor evolved into modern corn (Zea mays L.), spreading to cultivable regions in all continents and ultimately becoming one of the world’s most important crops, present in more than 145 countries and producing over one billion tonnes. Corn today serves a variety of functions, as food ranging from direct and processed human consumption to industry (13 %), feeding animals such as poultry, pigs and cattle (61 %), as a source of ethanol (17 %), and other uses (9 %) resulting in its global importance (OECD/FAO 2019; Grote et al., Reference Grote, Fasse, Nguyen and Erenstein2021; Matsuzaki et al., Reference Matsuzaki, Pinto, Jobim, Uhdre, Eisele and Scapim2023; Mora-Poblete et al., Reference Mora-Poblete, Maldonado, Henrique, Uhdre, Scapim and Mangolim2023).
Global corn yield showed in the last decade a 1.6 % annual increase, which is less than the 2.4 % required to meet projected food demand by 2050 (Ray et al., Reference Ray, Mueller, West and Foley2013; Sakschewski et al., Reference Sakschewski, von Bloh, Huber, Müller and Bondeau2014; Di Salvo et al., Reference Di Salvo, Chad and Montse2021). China, the United States and Brazil are the primary growth regions for corn, collectively accounting for more than half of cultivation (FAO, 2022a,b; USDA, 2022). Nevertheless, this concentration and the high demand for corn give rise to legitimate concerns regarding food security and market dynamics. Placing heavy reliance on a limited number of regions leaves the supply vulnerable to potential disruptions, such as extreme weather events and disease outbreaks.
While some regions face obstacles and delays, others have a greater potential to sustainably support production due to the favourable climate, soil quality and irrigation availability (Van Ittersum et al., Reference Van Ittersum, Cassman, Grassini, Wolf, Tittonell and Hochman2013; Jiao et al., Reference Jiao, Hao-Dong, He and Chang2022). The accurate projection of area and production is a crucial task for any country seeking to ensure food security and efficient agricultural management. Adequate area projections are essential for organizing food reserve funds, determining storage volumes and making informed decisions in the agricultural sector (FAO, 2022b). As a variable of study, the harvested area is certainly more controllable and predictable than production due to the impact of weather conditions on crop growth and productivity. By contrast, decisions regarding the area can be more readily managed and planned in response to demands and resources. In addition, past area and production data in time series are utilized to derive long-term projections by modelling with appropriate techniques (Boken, Reference Boken2000). Reliable projections are vital for guiding field activities and making strategic decisions. The projected data not only aid in long-term planning but also determine the direction of commodity flows within and between countries.
Among stochastic time series models, the autoregressive integrated moving average (ARIMA) is a flexible, robust and popular tool for projecting, as future movements are determined using their present and past values (Box and Jenkins, Reference Box and Jenkins1970; Boken, Reference Boken2000). The ARIMA models are used to characterize the behaviour of stationary and non-stationary time series, offering flexibility to situational variances and minimizing the difference between projected and observed values as close to zero as possible (Box and Jenkins, Reference Box and Jenkins1970; Zhou, Reference Zhou2021).
This ensures that decisions based on these projections are robust and adaptable to the dynamic nature of the global agricultural landscape. The utilization of ARIMA models in projecting agricultural features can serve as a powerful tool (Zhou, Reference Zhou2021; Atamanyuk, et al., Reference Atamanyuk, Havrysh, Nitsenko, Diachenko, Tepliuk, Chebakova and Trofimova2023) and has been highlighted among the various utilities in predicting the amount of area and production with recent emphasis on corn (Ilić et al., Reference Ilić, Sonja and Vesna2016; Verma, Reference Verma2018; Zhou, Reference Zhou2021). However, in all the research carried out so far, no study has compiled information from all corn-producing countries, making the present study unprecedented and significant.
By analysing the area in corn-producing countries from 1960 to 2030, this study fills a critical gap in providing researchers and decision-makers from universities, governments, companies and non-governmental organizations with comprehensive and forward-looking information. The availability of such consolidated data offers a common ground, aiding in making well-informed policies, research and development strategies and investment decisions.
This study’s contribution is also expected to enhance stakeholder collaboration and foster a more coordinated approach to global corn production and management.
Material and methods
This study uses corn harvested area data from 1960 to 2024, acquired from the USDA open-access official dataset. The data cover 145 countries and include a subset consisting of the top 25 producing nations, the remaining countries, and the global total. These data are used for evaluation and future projections. The per-year rate was calculated by dividing the time series’ inclination degree by the period’s average, which is both simple and replicable in other studies.
The pattern thresholds were delineated as follows: a growth pattern was defined for values exceeding 1.0 %, indicating a positive increase. Conversely, a decline pattern was established for values below −1.0 %, indicating a negative decrease. Values falling within the range of −1.0 to 1.0 % were categorized as neutral, indicating no significant change. These thresholds were employed to systematically classify the data into distinct categories of growth, decline or neutrality based on the observed values. The study used 1000 ARIMA models (Box and Jenkins, Reference Box and Jenkins1970; Boken, Reference Boken2000) to assess and project the potential to be harvested for each country, ranging from p, d and q parameters from 0 to 9. Six periods were set, representing 2025 through 2030. The script, written in R (R Core Team, 2022), is now available on https://github.com/rafaelaugvieira/Global-corn-area-from-1960-to-2030-patterns-trends-and-implications. The 100 ARIMA models with the lowest Akaike information criterion (Akaike, Reference Akaike1974) in each country were selected, and their projections were analysed using the k-mean algorithm to construct three independent groups representing country scenarios. This approach was adopted to bypass the ARIMA models’ sensitivity to potential outliers and data noise, thereby avoiding convergence issues and excessive sensitivity to minor errors in input data, especially under extreme agricultural conditions.
The likelihood of each scenario was evaluated based on three independent k-means groups. After forming these groups according to the similarity of their projections, the largest k-means group represented the most probable scenario. The second-largest group represented the secondary scenario, and the third-largest represented the tertiary scenario. This approach ensured robustness and provided probabilistic information. Additionally, a 95 % confidence interval was computed within each scenario based on the projections.
Results
During the 1960s, the world witnessed a steady growth rate of 1.0 % in corn harvested area, indicating a period of expansion in production (Table 1). This positive momentum continued into the 1970s, with the growth rate accelerating to 1.5 %, indicating a more significant increase in global corn output. However, the 1980s saw a slight setback, as the rate turned slightly negative at −0.1 %. The 1990s marked a recovery, with the growth rate rebounding to 0.7 %. This recovery continued into the early 2000s, with the growth rate surging to 2.1 %, indicating a substantial expansion in the corn harvested area during that period. Throughout the 2010s, the world maintained growth in corn area, albeit at a slightly slower pace, as indicated by a growth rate of 1.4 %. In the most recent years, from 2020 to 2024, the global growth rate declined to 0.0 %, suggesting a potential shift towards a more stable or slower growth phase in corn production. For the year 2024, the global corn harvested area is reported to be approximately 201.66 million hectares (ha).
Calculated per-year rate and patterna of corn harvested area from 1960 to 2024

a Greater than 1.0 % was considered as growth, lower than −1.0 % as decline and between them as neutral.
b Million hectares.
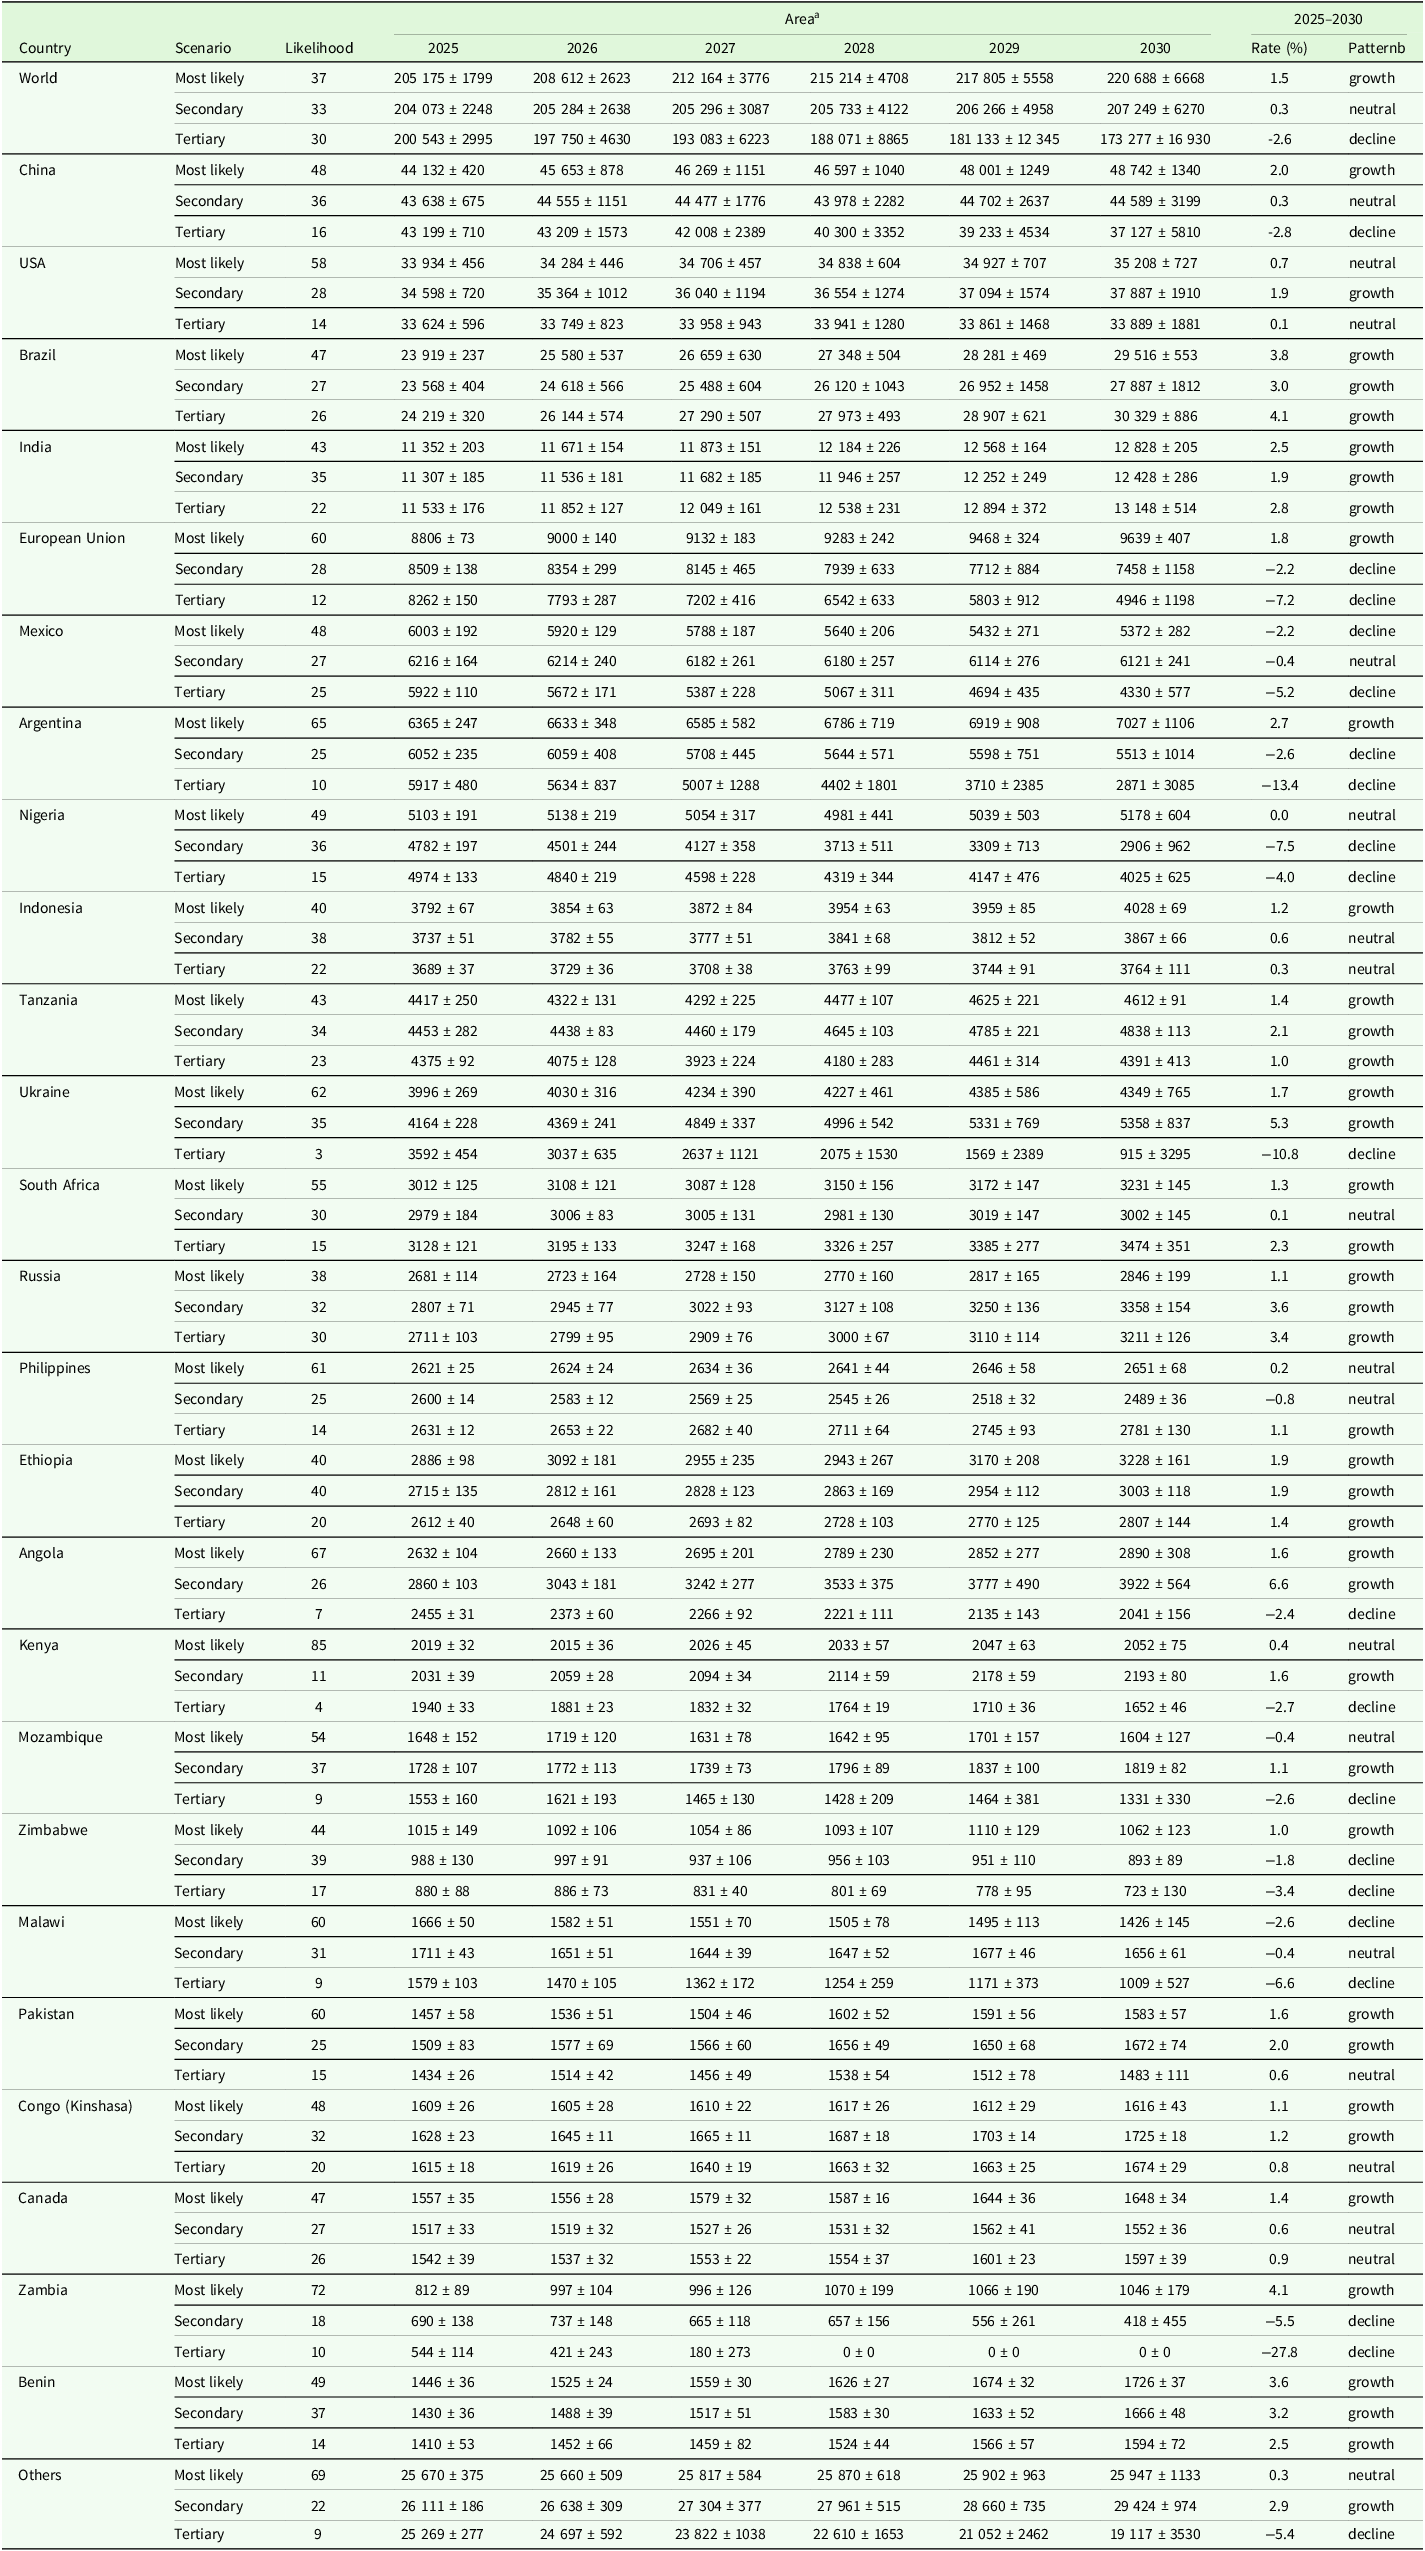
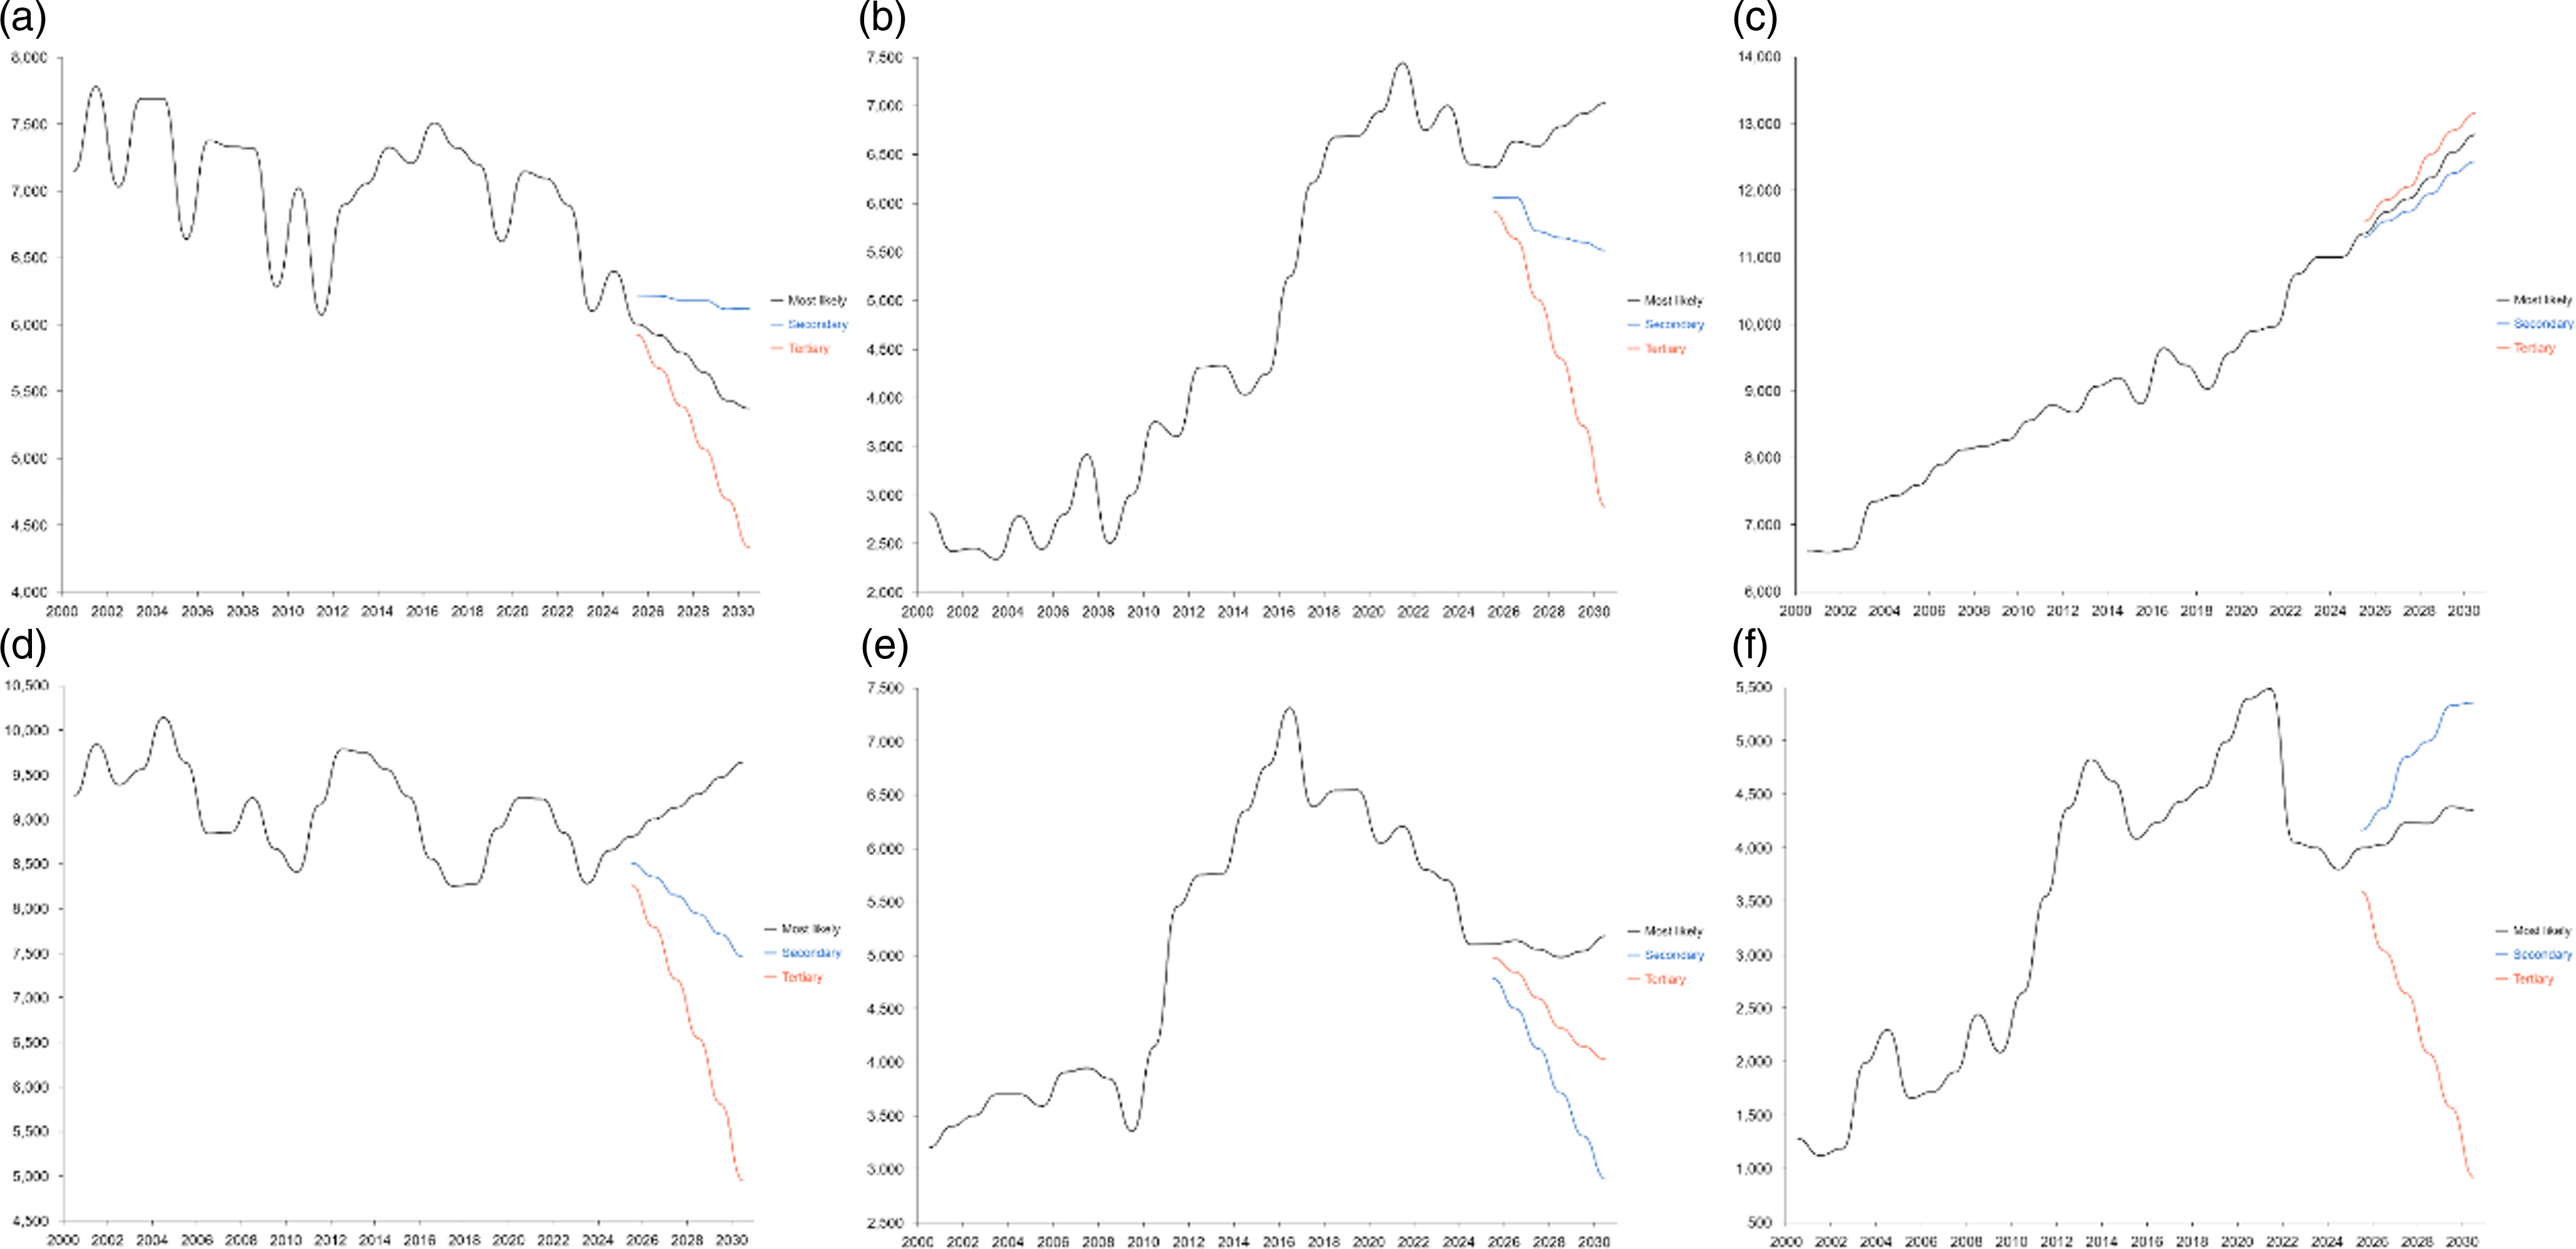
Table 2 and Figure 1 present projected scenarios for the global corn area spanning the period from 2025 to 2030. Three different scenarios, each with varying likelihoods, have been considered for future corn cultivation. In the world, the most likely scenario suggests an optimistic outlook for the global corn area over the next six years. With a 37 % likelihood, it is projected to experience steady growth. Starting at 205.2 million ha in 2025, the cultivated area is expected to increase by 1.5 % annually. By the year 2030, it is estimated to reach 220.7 million ha (Figure 1a). The uncertainties surrounding these projections, represented by the confidence interval of 95 % probability, are within the range of ± 1.8 to ± 6.7 million ha. The secondary scenario also presents a steady outlook for the global corn area but with a lower likelihood of 33 %. It predicts a slight growth pattern, beginning at 204.1 million ha in 2025; the cultivated area is projected to increase by 0.3 % annually. By 2030, it is estimated to reach 207.2 million ha. These projections’ uncertainties range from ± 2.2 to ± 6.3 million ha.
Projected scenarios: potential corn area to be harvested from 2025 to 2030

a Million hectares ± standard deviation.
b Greater than 1% was considered as growth, lower than −1% as decline and between them as neutral.
Three different scenarios projected for corn harvested area (2025–2030). (a) Global corn harvested area projections. (b) Corn harvested area projections for China. (c) Corn harvested area projections for the United States. (d) Corn harvested area projections for Brazil. The x-axis represents the years, and the y-axis represents the area in million hectares.

China, as a significant player in the global corn market, has witnessed consistent growth in its corn harvested area (Table 1). During the 1960s, China experienced a steady growth rate of 1.6 % in its corn harvested area. The 1970s witnessed a significant acceleration in the corn area, with the growth rate soaring to 2.7 %. As the country entered the 1980s, the growth rate maintained a positive trajectory at 0.7 %. The 1990s saw a continuation of growth, with the rate increasing to 1.9 %. The early 2000s marked a period of robust growth in China’s corn harvested area, with the growth rate peaking at 4.2 %. Throughout the 2010s, China continued its upward trajectory in corn, albeit at a slightly slower pace. The growth rate for this period settled at 1.4 %, reflecting the country’s ongoing focus on maintaining a sustainable and steady expansion in the corn harvested area. The most recent data for 2024 indicate that China’s growth rate remains positive at 1.8 %, with the country’s corn harvested area reaching 44.7 million ha.
In China, the most likely scenario suggests a growth trend for corn area over the next 6 years (Table 2 and Figure 1b). With a 48 % likelihood, it is projected to experience gradual expansion. Starting at 44.1 million ha in 2025, the cultivated area is expected to increase by 2.0 % annually. By the year 2030, it is estimated to reach 48.7 million ha. The variations around these projections are within the range of ± 0.4 to ± 1.3 million ha. The secondary scenario indicates a relatively stable and neutral outlook for the corn area in China. With a 36 % likelihood, it predicts no significant growth or decline. Starting at 43.6 million ha in 2025, the cultivated area is projected to remain relatively unchanged. By 2030, it is estimated to reach 44.6 million ha.
The United States, a major player in the global corn industry, has experienced a series of fluctuations in its corn harvested area over the past six decades (Table 1). The 1960s marked a challenging period for the United States, as the corn harvested area witnessed a decline of −1.2 %. The 1970s brought about a notable recovery, with the growth rate surging to 2.4 %. However, the 1980s presented another hurdle, as the downturn rate declined to −1.3 %. In the 1990s, the United States rebounded with a growth rate of 0.7 %, indicating a neutral to moderate expansion. In the 2000s, the US corn harvested area continued to grow steadily, with the growth rate reaching 1.7 %. The 2010s witnessed a period of relative stability, with the rate hovering at −0.3 %, signifying a neutral pattern. The most recent data for 2020–2024 reveal a neutral rate of 0.2 %, with a reported area of 33.2 million ha. The corn area in the United States from 2025 to 2030 is projected under different scenarios (Table 2 and Figure 1c). The first and most likely scenario, with a 58 % likelihood, suggests a neutral trend, expecting an annual increase of 0.7 %. The cultivated area is estimated to start at 33.9 million ha in 2025 and reach 35.2 million ha by 2030. These projections’ uncertainties range from ± 0.45 to ± 0.73 million ha. The secondary scenario, with a 28 % likelihood, indicates a growth outlook with significant change in the cultivated area. It is projected to start at 34.6 million ha in 2025 and increase to 37.9 million ha by 2030.
Brazil, a prominent agricultural powerhouse, has witnessed impressive growth in its corn harvested area over the past six decades (Table 1). During the 1960s, Brazil experienced robust growth with a remarkable 3.8 % increase in its corn harvested area. In the 1970s, Brazil continued to expand its corn production, with the growth rate standing at 1.7 %. As Brazil entered the 1980s, the growth rate remained positive at 0.6 %, reflecting the country’s steady efforts to strengthen its position in the global corn market. However, the 1990s posed a challenge, as the rate experienced a slight decline of −1.0 %. The early 2000s witnessed a resurgence in Brazil’s corn, with the growth rate soaring to 1.3 %. Throughout the 2010s, Brazil continued its impressive trajectory, with the growth rate reaching 2.9 %. The most recent data for 2020–2024 reveal a remarkable growth rate of 2.1 %, indicating Brazil’s continued commitment to enhancing corn production. This year, the country reported a corn harvested area of 22.3 million ha.
In Brazil, the projected scenarios for corn area from 2025 to 2030 present the following potential outcomes (Table 2 and Figure 1d). The most likely scenario, with a 47 % likelihood, indicates a promising and positive outlook, with the cultivated area experiencing substantial growth at 3.8 % annually, certainly resulting from the growing areas of Safrinha. Starting at 23.9 million ha in 2025, it is expected to reach 29.5 million ha by 2030. This growth is indicative of a strong and optimistic trajectory for corn production in Brazil. The uncertainties surrounding these projections are relatively narrow, ranging from ± 0.23 to ± 0.63 million ha, further bolstering the confidence in this scenario’s positive outlook. On the other hand, the secondary scenario, though less probable with a 27 % likelihood, still presents an encouraging and positive trend for Brazil’s corn cultivation. The cultivated area is projected to increase from 23.5 million ha in 2025 to 27.9 million ha by 2030, at a moderate growth rate of 3.0 % annually. Brazil’s corn industry faces potential opportunities and advancements in cultivation in the coming years.
Mexico, with its rich agricultural heritage, has experienced a mix of growth and challenges in its corn harvested area over the decades (Table 1). The 1960s marked a period of substantial growth in Mexico’s corn harvested area, with a remarkable 2.8 % increase. The 1970s saw a period of stability, with the growth rate remaining neutral at 0.0 %. The 1980s presented a challenging phase, with the rate declining by −2.5 %. In the 1990s, Mexico witnessed a neutral to modest growth rate of 0.5 %, indicating efforts to address previous challenges and boost corn production. The early 2000s brought another period of decline, with the rate slipping to −0.9 %, still categorized into a neutral trend. In the 2010s, the neutral trend was maintained, with the growth rate rebounding to 0.6 %. The recent data indicate a decline, with a rate of −3.7 % and 6.4 million ha.
In Mexico, two main projected scenarios for corn area from 2025 to 2030 are identified (Table 2 and Figure 2). The most likely scenario, with a 48 % likelihood, indicates a declining trend. The cultivated area is projected to start at 6.0 million ha in 2025 and reach 5.4 million ha by 2030, representing a −2.2 % rate per year (Figure 2a). The uncertainties surrounding these projections range from ± 0.13 to ± 0.29 million ha, indicating relatively narrow margins of uncertainty. Similarly, the secondary scenario, with a 27 % likelihood, still reflects a neutral trend. The cultivated area is projected to remain almost unchanged, starting at 6.2 million ha in 2025 and staying relatively constant at around 6.1 million ha through 2030, showing a −0.4 % growth rate. Mexico’s corn production outlook remains declining or stable, with considerable changes in cultivated areas over six years.
Three different scenarios projected for corn harvested area (2025–2030). (a) Corn harvested area projections for Mexico. (b) Corn harvested area projections for Argentina. (c) Corn harvested area projections for India. (d) Corn harvested area projections for the European Union. (e) Corn harvested area projections for Nigeria. (f) Corn harvested area projections for Ukraine. The x-axis represents the years, and the y-axis represents the area in million hectares.

Argentina, renowned for its agricultural prowess, has experienced a dynamic journey in its corn harvested area (Table 1). The 1960s marked a period of robust growth in Argentina’s corn harvested area, with an impressive 4.3 % increase. The 1970s presented a challenging phase, with the rate declining by −3.0 %. The 1980s brought further difficulties, as the growth rate experienced a significant decline of −6.3 %. In the 1990s, Argentina’s corn production rebounded with a growth rate of 3.4 %, indicating successful efforts to overcome previous challenges and strengthen the agricultural sector. The early 2000s saw continued growth, with the growth rate reaching 3.0 %. Throughout the 2010s, Argentina witnessed impressive growth in its corn harvested area, with the growth rate soaring to 7.2 %. The most recent data for 2020–2024 indicate a declining trend, with the rate standing at −2.2 % and 6.4 million ha.
In Argentina, three projected scenarios for corn area from 2025 to 2030 are identified, each indicating different potential outcomes (Table 2 and Figure 2b). The most likely scenario, with a 65 % likelihood, suggests an increase in corn cultivation. Starting at 6.4 million ha in 2025, the cultivated area is projected to increase to 7.0 million ha by 2030, representing a growth rate of 2.7 % annually. The uncertainties surrounding these projections range from ± 0.24 to ± 1.11 million ha, showing some variability in the anticipated growth. In contrast, the secondary scenario, with a 25 % likelihood, portrays a more negative picture, with corn cultivation experiencing a decline. In this scenario, the cultivated area is projected to decrease from 6.1 million ha in 2025 to 5.5 million ha by 2030, at an annual rate of −2.6 %. The tertiary scenario, although less likely with a 10 % likelihood, presents the most dramatic outlook for corn production in Argentina. The cultivated area is projected to witness a substantial decline, starting at 5.9 million ha in 2025 and reaching 2.9 million ha by 2030, representing an impressive rate of −13.4 % annually. Argentina’s corn projections reveal uncertainty and variability over 6 years, with contrasting trends across different scenarios.
During the 1960s, India witnessed impressive growth in its corn harvested area, with a significant 3.3 % increase (Table 1). The 1970s and 1980s displayed a period of stability, as the rate remained neutral at 0.0 and −0.1 %, respectively. The 1990s marked a positive turning point, with the growth rate rebounding to 1.1 %. In the early 2000s, India experienced accelerated growth, with the growth rate surging to 2.8 %. Throughout the 2010s, India continued its upward trajectory, with the growth rate stabilizing at 1.2 %. The most recent data for 2020–2024 indicate a notable growth rate of 3.1 %, and this year, the country reported a corn harvested area of 11.0 million ha. In India, the most likely scenario for corn area from 2025 to 2030 suggests a growth trend (Table 2, Figure 2c). With a 43 % likelihood, the cultivated area is projected to increase at an annual rate of 2.5 %. Starting at 11.4 million ha in 2025, it is expected to reach 12.8 million ha by 2030. Projections have standard deviations ranging from ± 0.15 to ± 0.22 million ha, indicating narrow uncertainty.
The European Union (EU), a major player in the landscape, has faced a series of challenges in its corn harvested area over the past decades (Table 1). The 2000s began with a decline in the rate, standing at −1.2 %. The 2010s continued to pose difficulties, with the declined rate remaining neutral at −0.5 %. However, the EU faced a significant setback in the 2020s, as the rate declined sharply to −2.4 %. In the EU, two scenarios for corn area from 2025 to 2030 are identified (Table 2 and Figure 2d). The most likely scenario, with a 60 % likelihood, suggests a growth pattern. The cultivated area is projected to experience an increase from 8.8 million ha in 2025 to 9.6 million ha by 2030, representing a significant 1.8 % growth rate. The uncertainties surrounding these projections range from ± 0.07 to ± 0.41 million ha, indicating relatively narrow margins. On the other hand, the secondary scenario, with a 28 % likelihood, shows a more pessimistic outlook with a declining pattern. The cultivated area is projected to reduce from 8.5 million ha in 2025 to 7.5 million ha by 2030, at an annual rate of −2.2 %.
Nigeria has experienced consistent growth in its corn harvested area (Table 1). During the 1960s, Nigeria witnessed a neutral growth rate of 0.9 % in its corn harvested area. The 1970s brought about a significant acceleration in corn production, with the growth rate surging to 4.1 %. As Nigeria entered the 1980s, the growth rate remained positive at 2.9 %. The 1990s displayed a neutral pattern, with the growth rate settling at 0.4 %. In the early 2000s, Nigeria experienced renewed growth momentum, with the growth rate reaching 1.6 %. Throughout the 2010s, Nigeria continued its upward trajectory, with the growth rate accelerating to 2.7 %. The most recent data in the 2020s indicate a sharp decline, with a rate standing at −4.2 %. This year, Nigeria reported a corn harvested area of 5.1 million ha. In Nigeria, two main scenarios for corn area from 2025 to 2030 are identified, each presenting distinct possibilities (Table 2 and Figure 2e). The most likely scenario, with a 49 % likelihood, indicates a relatively stable and neutral pattern. The cultivated area is projected to experience minimal changes, starting at 5.1 million ha in 2025 and maintaining a consistent trend, reaching 5.2 million ha by 2030, representing a 0.0 % growth rate. The uncertainties surrounding these projections range from ± 0.19 to ± 0.60 million ha. On the other hand, the secondary scenario, with a 36 % likelihood, shows a more declining pattern. The cultivated area is projected to decrease from 4.9 million ha in 2025 to 2.9 million ha by 2030, at an annual declining rate of −7.5 %.
Ukraine, a nation with vast agricultural potential, has experienced a series of transformative shifts in its corn harvested area (Table 1). In the early 1990s, Ukraine experienced a significant decline in its corn harvested area, with the rate plummeting to −3.0 %. However, the subsequent years brought a transformative turnaround, as Ukraine witnessed a remarkable growth rate of 6.7 % in the late 2000s. This period marked a crucial phase in Ukraine’s agricultural development, with the country actively harnessing its agricultural potential. The 2010s continued to showcase Ukraine’s progress, with the growth rate reaching 4.0 %. Despite significant strides in the early 2010s, Ukraine faced a considerable setback in 2020–2024, with the rate declining sharply to −10.3 %, mostly influenced by geopolitical uncertainties. In 2024, Ukraine reported a corn harvested area of 3.8 million ha.
In Ukraine, the projected scenarios for the corn area from 2025 to 2030 present contrasting outcomes (Table 2 and Figure 2f). The most likely scenario, with a 62 % likelihood, anticipates a growth pattern, starting at 4.0 million ha in 2025 and gradually increasing to 4.3 million ha by 2030, representing a significant annual growth rate of 1.3 %. On the other hand, the secondary scenario, with a 35 % likelihood, suggests a more notorious increase in corn cultivation. The projected area is expected to decrease from 4.2 to 5.6 million ha over the 7 years, reflecting a notable annual growth rate of 5.3 %. Lastly, the tertiary scenario, with a 3 % likelihood, portrays a significant decline in corn cultivation. The projected area is forecasted to decrease from 3.6 to a mere 0.9 million ha, resulting in a substantial annual decline of −10.8 %. These scenarios underscore the uncertainties and potential fluctuations in Ukraine’s corn cultivation.
Discussion
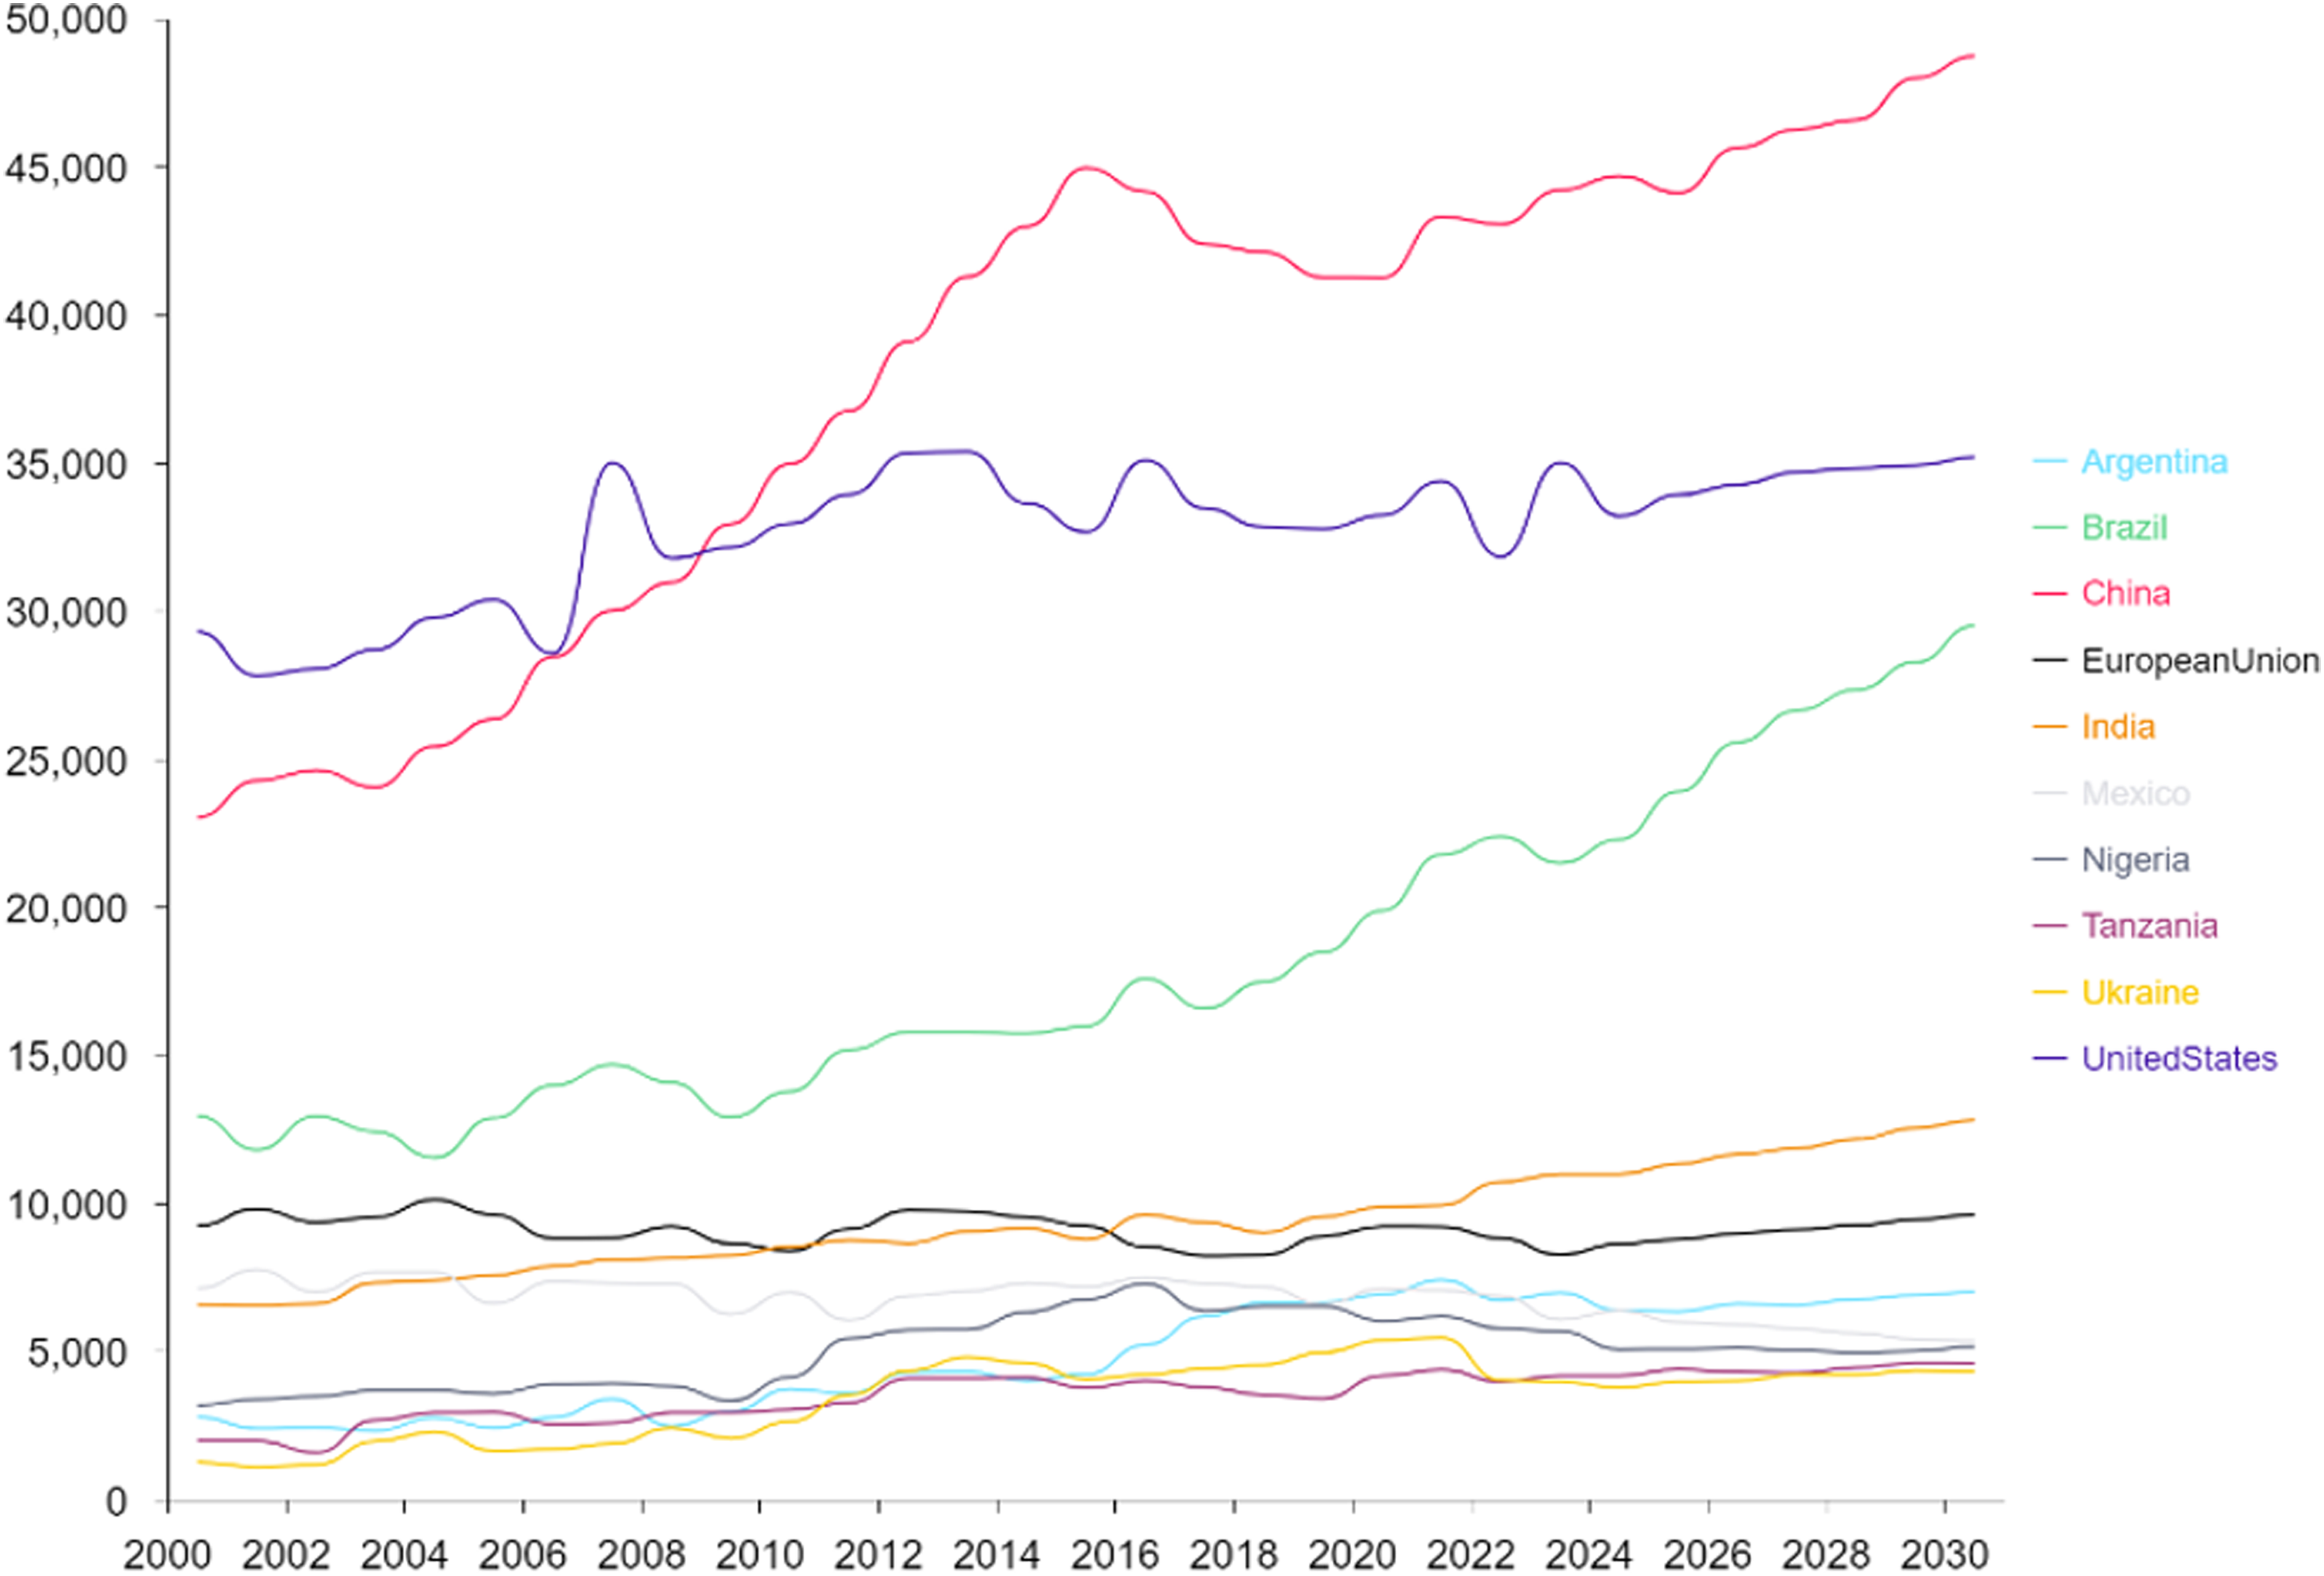
The significant expansion during the 1960s and 1970s in the world can be attributed to technological advancements and improved agricultural practices, which enhanced production and met the growing demand for corn-based products. The setback in the 1980s, with a negative growth rate, may have been influenced by changing market dynamics, trade policies or other factors. However, the recovery in the 1990s and the surge in the growth rate during the early 2000s suggest that corn’s significance as a staple feed crop and source of biofuel persisted despite past challenges. The slower growth rate observed in the 2010s may indicate a shift in the global corn market dynamics, possibly due to environmental concerns and changing dietary habits. The recent neutral rate from 2020 to 2024 raises questions about the future trajectory of corn production, as the current cultivated area may be adequately meeting existing demand, potentially approaching equilibrium or saturation (Figure 3). However, constraints on land availability, environmental sustainability concerns and shifts in agricultural priorities could limit the scope for significant expansion in corn production.
Historical and projected corn harvested areas in various countries (2000–2030). The x-axis represents the years, and the y-axis represents the area in million hectares.

Sakschewski et al. (Reference Sakschewski, von Bloh, Huber, Müller and Bondeau2014) highlight the challenge of producing enough food, particularly in low-agricultural countries. The world’s most likely scenario for corn harvested area is an optimistic outlook based on historical trends of expansion and recovery after setbacks. The growth rate aligns with the need to sustainably increase agricultural output to meet the growing population and food requirements. However, complementary technologies are required to enhance corn yields and productivity. By closely monitoring agricultural trends and embracing innovation and sustainability, the most likely scenario of steady growth in the global corn area can be transformed into a reality, supporting food security for a growing global population.
Despite the optimistic outlook for the next 6 years, it is essential to acknowledge that projections are subject to uncertainties. Unforeseen factors such as changes in government policies, economic conditions, climate events or breakthroughs in technologies may impact corn production in ways that are difficult to anticipate. In this context, policymakers, stakeholders and researchers must proactively monitor and analyse the global agricultural landscape to make informed decisions. Emphasizing sustainable practices, embracing technological innovations and ensuring food security will be crucial in securing a resilient future for corn production and meeting the evolving demands of the global population. Striking a balance between productivity, environmental stewardship and socio-economic considerations will be key in charting the course for the global corn industry in the coming years.
Individually, the largest corn producers present different forecasts. The steady expansion during the 1960s and the significant acceleration in the 1970s underscored China’s commitment to agricultural development. Even in the face of challenges, such as the slight setback in the 1980s, China managed to maintain growth rates, signalling its resilience in ensuring food security and supporting its thriving livestock and poultry industries.
The projected scenarios for China and the US countries offer valuable insights into potential future trends. For China, the most likely scenario suggests a gradual expansion with an annual growth rate of 2.0 %, which may reflect a commitment to food security and agricultural development. The United States is expected to experience a modest growth trend with an annual increase of 0.7 % in the corn production acreage. This reaffirms the country’s ability to adapt and rebound despite past fluctuations, maintaining its critical role in global corn production, mainly by increasing productivity. To ensure the realization of these scenarios, both countries must continue to prioritize investment in research, modern technologies and sustainable farming practices. Addressing challenges like climate change, resource management and market fluctuations will also be crucial for sustaining a resilient global corn industry (Erenstein et al., Reference Erenstein, Jaleta and Sonder2022). As key players in the market, China and the United States have the potential to shape the future of food security and meet the demands of a growing population.
The results highlight the remarkable growth trajectories of Brazil, Argentina and Mexico in their corn harvested areas, reflecting the still land availability in the continent and prompt response to high prices and strong demand (FAO, 2022b). Brazil’s consistent growth, marked by robust expansion and steady efforts to strengthen its position in the global corn market, demonstrates the country’s ability to enhance corn production, showing a remarkable growth rate over the decades. Argentina has also experienced dynamic growth patterns, marked by robust expansion in the 1960s and impressive growth in the 2010s, with fluctuations in rates underscoring the challenges faced by the nation, followed by successful efforts to overcome obstacles and establish itself as a significant corn-producing nation in the global market. Mexico’s corn harvested area also reflects a mix of growth and challenges, with fluctuations in different decades. The findings of our study are consistent with OECD-FAO (2019), which stated that there are strong growth opportunities in the region to produce high-value crops, which provide better opportunities for farmers and healthier diets for the population and where targeted policies could help farmers and consumers reap these opportunities while protecting the region’s natural resource base.
The projections reveal the dynamic nature of corn in Brazil, Argentina and Mexico (Figures 2 and 3). Mexico is expected to experience a stable or declining pattern, while Argentina presents a range of scenarios, including decline, steady growth and an optimistic outlook. Brazil, on the other hand, shows a promising outlook, with both most likely and secondary scenarios predicting substantial growth in corn cultivation. These findings emphasize the need for strategic planning, sustainable practices and adaptability to ensure sustainable growth in the corn industry. These projections guide policymakers and stakeholders in shaping the future of the corn industry, ensuring food security and meeting global demands. Address uncertainties, opportunities and challenges to ensure countries maintain a significant role in the global corn market and contribute to sustainable agricultural sector growth.
Nigeria’s consistent growth in corn production over the decades solidifies its position as a relevant player in the global market. However, the projected neutral or declining pattern in the corn area from 2025 to 2030 highlights the need for careful planning and targeted interventions to maintain this growth trend.
Atamanyuk et al. (Reference Atamanyuk, Havrysh, Nitsenko, Diachenko, Tepliuk, Chebakova and Trofimova2023) emphasize the importance of adequate production projections for countries to organize food reserve funds, storage volumes and agricultural management. The text presents historical growth and future scenarios for corn production in several African countries, providing valuable insights for policymakers, stakeholders and investors. Beyond historical trends, the projected scenarios for corn production acreage from 2025 to 2030 provide crucial insights for planning and decision-making in each country. These scenarios present a range of possibilities, highlighting the uncertainties that may lie ahead. Governments, policymakers and stakeholders must carefully analyse these projections to develop robust agricultural strategies and ensure food security in the region. As the African continent experiences rapid population growth and increased urbanization (OECD/SWAC, 2020), the demand for corn and other agricultural products will continue to rise. Therefore, harnessing agricultural potential and implementing sustainable practices are of paramount importance to meet future demands and boost economic development. In conclusion, the agricultural growth and projected scenarios for corn production in Nigeria, Ethiopia, Angola, Kenya and other African countries paint a dynamic picture of the region’s agricultural sector. Each country’s journey highlights the significance of adaptive strategies and long-term planning to navigate challenges and capitalize on opportunities. The success of Africa’s agricultural sector holds the key to unlocking economic growth, ensuring food security and elevating the region’s position in the market.
In Ukraine, the projected scenarios for corn area from 2025 to 2030 present divergent possibilities with different likelihoods, reflecting the uncertainties in Ukraine’s agricultural landscape. The most likely scenario anticipates a growth pattern, indicating that Ukraine may regain its growth momentum in corn production, but it also indicates the need for strategic planning to achieve sustained growth. Conversely, the secondary scenario suggests a strong rise in corn cultivation, measuring a potential most favourable condition. The tertiary scenario, though less likely with a 3 % likelihood, paints a more severe picture of substantial decline, highlighting the potential risks Ukraine might face if significant issues remain unaddressed.
While the model’s predictions rely on historical data, their applicability across diverse regions and growing seasons may vary due to regional agricultural practices and environmental factors. This variability emphasizes the importance of ongoing refinement and adaptation to enhance predictive accuracy and effectively capture unforeseen future changes.
Global corn yield has only increased by 1.6 % annually, below the 2.4 % needed to meet food demand by 2050 (Ray et al., Reference Ray, Mueller, West and Foley2013). Identifying areas with potential for increased production, optimal research and intervention priorities can positively impact future global corn production (Van Ittersum et al., Reference Van Ittersum, Cassman, Grassini, Wolf, Tittonell and Hochman2013). However, some regions face obstacles, while others have greater potential due to favourable climate, soil quality and irrigation availability. Ukraine’s agricultural journey in corn has faced challenges and opportunities, showcasing its resilience and adaptability in the face of changing circumstances. Ukraine’s growth rate of 6.7 % in the late 2000s and 4.0 % in the 2010s demonstrates its continued progress in the global corn market. However, the sharp decline of −10.3 % in the 2020–2024 area highlights the need for stable policies, risk management strategies and addressing external factors that can impact the agricultural sector. This projection is grounded in several factors: first, historical agricultural trends indicating a gradual increase in corn cultivation; second, advancements in agricultural technologies and practices that could enhance productivity; and third, potential shifts in market demands favouring corn production. However, the forecast acknowledges the inherent unpredictability stemming from factors such as geopolitical developments, infrastructure challenges and global climatic variations, which could influence these projections significantly. Thus, while the three-fold growth scenario appears probable, it remains contingent upon navigating and adapting to these complex uncertainties over the coming years.
There was a notable variation in the rate of growth in the corn area among different countries. However, the underlying causes of this differentiation were not examined in detail, adding further uncertainty to future projections. Possible factors contributing to this variation might include disparities in land availability and the prevalence of favourable growing seasons. Other considerations could involve the extent of technological adoption, access to agricultural inputs, government policies and economic conditions. These factors play a crucial role in shaping the agricultural landscape and can significantly impact projected trends in different countries.
In a general context, China projections indicate a gradual expansion of corn area. This trend highlights the country’s commitment to ensuring food security and supporting its livestock and poultry industries, which are essential to its economy. In the United States, the most likely scenario suggests a neutral trend, reflecting stability in the agricultural sector but also underscoring the importance of technological innovations and sustainable practices to maintain competitiveness in the global market. Brazil stands out with notable growth trajectories, driven by land availability, robust internal demand and booming export, all contributing to the rapid expansion of corn production. This growth reflects a robust response to global demand for agricultural products, strengthening Brazil’s position as one of the world’s leading corn producers. Argentina, despite having shown significant growth in the past, faces greater uncertainties, with scenarios ranging from expansion to substantial decline, highlighting the need for derivative agricultural policies and risk mitigation strategies. Mexico faces a trend of decline or stability, highlighting the importance of strategic strategies to revitalize its corn production. Nigeria, despite historical growth, is forecast to be stable or declining, reducing the need for improvements in agricultural management and infrastructure. Ukraine, with a more volatile scenario, reflects geopolitical uncertainties and the need for resilient agricultural policies to sustain growth.
These projected scenarios underscore the importance of proactive and well-informed decision-making to navigate the uncertainties in corn production. Overall, agricultural potential remains significant, and strategic efforts are necessary to maintain growth, improve resilience and ensure a stable and prosperous future for the nation’s corn production sector. By addressing challenges and leveraging opportunities, the crop can continue to play a vital role in the global market while contributing to food security and economic development both domestically and internationally.
Conclusions
Globally, the most likely scenario for corn area is optimistic, with a 37 % probability of steady growth, reflecting the continued importance of corn as a key food and feed crop. This positive outlook suggests that despite market and environmental challenges, corn production can continue to expand, meeting the needs of a growing global population.
Our findings point to the importance of a coordinated and collaborative approach between governments, sectors and international organizations to promote sustainable and balanced agricultural growth. This analysis provides a solid basis for the formulation of informed policies and development strategies in the global agricultural sector.
Supplementary material
The supplementary material for this article can be found at https://doi.org/10.1017/S002185962500019X
Author contributions
R.A.V. conceived and designed the study. R.A.V., C.A.S. and R.S.U. conducted data gathering. R.A.V. and R.S.U. performed statistical analyses and prepared graphics. R.A.V., R.S.U., C.A.S. and G.V.B. wrote the article. C.A.S. and G.V.B. supervised the work.
Funding statement
This research received no specific grant from any funding agency, commercial or not-for-profit sectors.
Competing interests
None.
Ethical standards
Not applicable.