


1. Introduction
In recent years, fluid-filled vesicles have been used in a wide array of technological applications ranging from food products to bioinspired microreactors, and reagent delivery applications in functional materials (Huang & MacDonald Reference Huang and MacDonald2004). Moreover, giant vesicles are widely regarded as a model membrane system in various biophysical and biochemical processes (Boal Reference Boal2002; Dimova & Marques Reference Dimova and Marques2019). In these applications, precise characterization of the membrane shape dynamics in response to a fluid flow is of fundamental importance. Despite the increasing prevalence of vesicles in biophysics and materials science, we lack a complete understanding of how time-dependent flows influence the membrane shape dynamics and overall rheological response of vesicle suspensions (Vlahovska, Podgorski & Misbah Reference Vlahovska, Podgorski and Misbah2009; Abreu et al. Reference Abreu, Levant, Steinberg and Seifert2014). Lipid vesicles consist of a small amount of fluid enclosed by a bilayer membrane of thickness  $\approx$5 nm. This molecularly thin membrane enables intriguing morphological dynamics for vesicles, including complex conformations in linear flows (Deschamps et al. Reference Deschamps, Kantsler, Segre and Steinberg2009; Dahl et al. Reference Dahl, Narsimhan, Gouveia, Kumar, Shaqfeh and Muller2016; Lin & Narsimhan Reference Lin and Narsimhan2019; Kumar, Richter & Schroeder Reference Kumar, Richter and Schroeder2020a), nonlinear stretching behaviour, and heterogeneous relaxation following deformation (Zhou et al. Reference Zhou, Gabilondo, Losert and van de Water2011; Yu et al. Reference Yu, Lira, Riske, Dimova and Lin2015; Kumar, Richter & Schroeder Reference Kumar, Richter and Schroeder2020b).
Recent advances in experiments, computations and theory have largely focused on vesicle dynamics in steady shear flows (Abreu et al. Reference Abreu, Levant, Steinberg and Seifert2014). These studies have revealed three dynamical regimes: tumbling, trembling and tank-treading. Relevant research in shear flow includes investigation of the hydrodynamic lift of a single vesicle near a wall (Callens et al. Reference Callens, Minetti, Coupier, Mader, Dubois, Misbah and Podgorski2008; Podgorski et al. Reference Podgorski, Callens, Minetti, Coupier, Dubois and Misbah2011; Zhao, Spann & Shaqfeh Reference Zhao, Spann and Shaqfeh2011), pair interactions between two vesicles (Kantsler, Segre & Steinberg Reference Kantsler, Segre and Steinberg2008; Vitkova et al. Reference Vitkova, Mader, Polack, Misbah and Podgorski2008), the amplification of thermal fluctuations in the transition regime between tumbling and tank-treading (Zabusky et al. Reference Zabusky, Segre, Deschamps, Kantsler and Steinberg2011; Levant et al. Reference Levant, Deschamps, Afik and Steinberg2012; Abreu & Seifert Reference Abreu and Seifert2013), and characterization of tank-treading, vacillating-breathing (trembling) and tumbling motion with increasing viscosity ratio between the interior and the exterior of the vesicle (Kantsler & Steinberg Reference Kantsler and Steinberg2005, Reference Kantsler and Steinberg2006; Misbah Reference Misbah2006; Mader et al. Reference Mader, Vitkova, Abkarian, Viallat and Podgorski2006; Vlahovska & Gracia Reference Vlahovska and Gracia2007; Deschamps et al. Reference Deschamps, Kantsler, Segre and Steinberg2009). The phase diagrams of the dynamical regimes in simple shear flow have been well analysed over a number of studies, and the theory agrees well with experiments and simulations (Danker et al. Reference Danker, Biben, Podgorski, Verdier and Misbah2007; Lebedev, Turitsyn & Vergeles Reference Lebedev, Turitsyn and Vergeles2007; Vlahovska & Gracia Reference Vlahovska and Gracia2007; Farutin, Biben & Misbah Reference Farutin, Biben and Misbah2010). Knowledge of single vesicle dynamics has been essential for interpreting the bulk rheological response for dilute vesicle suspensions. For instance, it is now known that the tank-treading to tumbling behaviour of vesicles directly affects the bulk viscosity of the suspension, where tumbling results in a higher bulk viscosity with the minimum bulk viscosity occurring at the tank-treading to tumbling transition (Vlahovska et al. Reference Vlahovska, Podgorski and Misbah2009).
Compared with the vast body of experiments in shear flows, vesicle dynamics in hyperbolic flows even for the canonical case of steady elongational flow are more challenging to understand. In extensional flow, fluid elements separate exponentially in time (Leal Reference Leal1992), and it is generally not possible to observe a single vesicle in flow for long periods of time in the absence of feedback controllers. Automation in flow control techniques using sophisticated feedback algorithms has recently enabled the precise characterization of vesicle dynamics in elongational flows (Shenoy, Tanyeri & Schroeder Reference Shenoy, Tanyeri and Schroeder2015; Shenoy, Rao & Schroeder Reference Shenoy, Rao and Schroeder2016; Shenoy et al. Reference Shenoy, Kumar, Hilgenfeldt and Schroeder2019; Kumar et al. Reference Kumar, Shenoy, Li and Schroeder2019, Reference Kumar, Shenoy, Deutsch and Schroeder2020c). In a steady extensional flow, it is known that highly deflated tubular vesicles undergo a conformation change to a symmetric dumbbell shape (Kantsler et al. Reference Kantsler, Segre and Steinberg2008; Narsimhan, Spann & Shaqfeh Reference Narsimhan, Spann and Shaqfeh2014, Reference Narsimhan, Spann and Shaqfeh2015; Kumar et al. Reference Kumar, Richter and Schroeder2020a) while moderately deflated vesicles transition to an asymmetric dumbbell shape (Dahl et al. Reference Dahl, Narsimhan, Gouveia, Kumar, Shaqfeh and Muller2016; Kumar et al. Reference Kumar, Richter and Schroeder2020a). Precise control over the centre-of-mass position of single vesicles led to detailed studies of the transient and steady-state stretching dynamics of membranes (Kumar et al. Reference Kumar, Richter and Schroeder2020a), and direct observation of the double-mode relaxation following high deformation (Kumar et al. Reference Kumar, Richter and Schroeder2020b). Prior work in unsteady flows has been limited to a one-time reversal of elongational flow and reported membrane wrinkling shapes for quasi-spherical vesicles (Kantsler, Segre & Steinberg Reference Kantsler, Segre and Steinberg2007).
Extensional flows are commonly encountered in microfluidic devices that utilize contractions or expansions, porous media and other complex channel geometries. Moreover, in vivo capillaries and complex microfluidic devices that have many bifurcations and sharp directional changes routinely encounter time-dependent pulsatile flows. The biomedical community has created several biomimetic capillary designs that contain several rows of bifurcations and contractions with small angle zigzags in-between, resulting in improved flow control and lower fluid flow resistance (Lim et al. Reference Lim, Kamotani, Cho, Mazumder and Takayama2003; Domachuk et al. Reference Domachuk, Tsioris, Omenetto and Kaplan2010). In general, elastic particles traversing through these fluidic systems experience spatially dependent external flows and will not reach a steady-state conformation. From this view, there is a need for comprehensive studies on how microscopic stretching and compression of vesicles in complex, time-dependent oscillatory flows will affect their shape and bulk rheology.
Recently, the shape dynamics of elastic capsules were studied numerically in large amplitude oscillatory extensional (LAOE) flow (Bryngelson & Freund Reference Bryngelson and Freund2019). However, the non-equilibrium stretching and compression dynamics of lipid vesicles in LAOE flows is largely unexplored. Vesicle dynamics are strongly governed by membrane bending elasticity; therefore, we anticipate that vesicles will exhibit qualitatively different behaviours than capsules in time-dependent extensional flow. In this paper, we study the dynamics of single vesicles in LAOE using a combination of microfluidic experiments and boundary integral (BI) simulations. The LAOE experiments are performed using the Stokes trap (Shenoy et al. Reference Shenoy, Rao and Schroeder2016, Reference Shenoy, Kumar, Hilgenfeldt and Schroeder2019; Kumar et al. Reference Kumar, Shenoy, Li and Schroeder2019, Reference Kumar, Shenoy, Deutsch and Schroeder2020c), which is a new method for controlling the centre-of-mass position, orientation and trajectories of freely suspended single and multiple vesicles using only fluid flow. We find that single vesicles experience periodic cycles of compression and extension in LAOE with membrane dynamics governed by the dimensionless flow strength capillary number ( $Ca$), reduced volume (measure of vesicle asphericity,
 $\nu$) and flow frequency Deborah number (
 $De$). Experimental results are compared with BI simulations without thermal fluctuations, and our results show that BI simulations accurately capture the dynamics of single quasi-spherical vesicles over a wide range of parameters. In addition, we identify three distinct dynamical regimes for vesicle dynamics, including the pulsating, reorienting and symmetrical regimes, based on the amount of deformation occurring in each half-cycle of the LAOE flow. The qualitatively different dynamics observed in each regime results due to a competition between the flow frequency, flow time scale and membrane deformation time scale. We further construct precise phase diagrams characterizing the transition of vesicle shapes between pulsating, reorienting and symmetrical regimes. We find that the relationship between average vesicle stress and strain rate is nonlinear, which is discussed in the context of bulk suspension rheology. Finally, we present results on the shape dynamics of long tubular vesicles in LAOE which exhibit markedly different behaviour in flow compared with their quasi-spherical analogues. Taken together, our results provide new insights into the direct observation of membrane dynamics during time-dependent oscillatory flows, which opens new avenues for understanding bulk suspension rheology in unsteady flows.
2. Methods
2.1. Vesicle preparation
A mixture of 1,2-dioleoyl-sn-glycero-3-phosphocholine (DOPC, Avanti Polar Lipids) and 0.12 mol% of 1,2-dioleoyl-sn-glycero-3-phosphoethanolamine-N-(lissamine rhodamine B sulfonyl) (DOPE-Rh, Avanti Polar Lipids) is used to generate giant unilamellar vesicles (GUVs) with the electroformation process described by Angelova et al. (Reference Angelova, Soléau, Méléard, Faucon and Bothorel1992). For electroformation of GUVs, a stock lipid solution in chloroform is prepared with  $25\,\textrm {mg}\,\textrm {ml}^{-1}$ DOPC and
 $0.04\,\textrm {mg}\,\textrm {ml}^{-1}$ DOPE-Rh for fluorescent imaging. Next,
 $10\,\mathrm {\mu }\textrm {l}$ of the lipid solution in chloroform is spread on a conductive indium tin oxide (known as ITO) coated glass slide (resistance
 $5\,\Omega$,
 $25\times 50 \times 1.1$ mm, Delta Technologies) and dried under vacuum overnight. The pair of indium tin oxide slides are sandwiched together using a 1.5 mm Teflon spacer, forming a chamber with a volume of
 $\approx$2.4 ml and coupled to a function generator (Agilent 33220 A). The electroformation chamber is filled with a mixture of 100 mM sucrose solution (Sigma-Aldrich), and glycerol-water is added to achieve a total viscosity of 0.030 Pa s measured using a benchtop viscometer (Brookfield) at 22
 $^\circ$C. An alternating current electric field of
 $2\,\textrm {V}\,\textrm {mm}^{-1}$ is then applied at 10 Hz for 120 min at room temperature (22
 $^\circ$C). Under these conditions, DOPC lipid remains in the fluid phase (Kantsler & Steinberg Reference Kantsler and Steinberg2005). Most of the vesicles prepared by this method are quasi-spherical and unilamellar with few defects in the size range of 5–25
 $\mathrm {\mu }\textrm {m}$ in radius.
2.2. Stokes trap for large amplitude oscillatory extension
It is challenging to observe vesicle dynamics in time-dependent extensional flow for long periods of time while simultaneously imposing precisely controlled flow rates. To achieve this, we used the Stokes trap (Shenoy et al. Reference Shenoy, Rao and Schroeder2016; Kumar et al. Reference Kumar, Shenoy, Deutsch and Schroeder2020c) to precisely position the centre-of-mass of single vesicles near the centre of a cross-slot microfluidic device for long times using model predictive control (figure 1a). Briefly, the centroid of a single vesicle is determined in real-time using image processing and fluorescence microscopy and is communicated to the controller. The controller determines the optimal flow rates through four-channels of the device to maintain a fixed vesicle position with desired strain rate. The flow rates are then applied through four independent pressure regulators (Elveflow). During this process, the device operates at a net positive pressure so that each of the four ports can act as an inlet or outlet. This whole procedure requires  $\approx$30 ms in a single cycle, as previously described (Shenoy et al. Reference Shenoy, Rao and Schroeder2016; Zhou & Schroeder Reference Zhou and Schroeder2016a,Reference Zhou and Schroederb). In this work, a sinusoidal strain rate input is imposed (figure 1b) while simultaneously trapping a single vesicle such that
 $$\begin{gather} \dot{\epsilon}_x(t)={-}\dot{\epsilon}_0 \sin\left(\frac{2{\rm \pi}}{T}t\right), \end{gather}$$
 $$\begin{gather}\dot{\epsilon}_y(t)=\dot{\epsilon}_0 \sin\left(\frac{2{\rm \pi}}{T}t\right), \end{gather}$$
where  $T$ is the period of the sinusoidal cycle and
 $\dot {\epsilon }_0$ is the maximum strain rate in one cycle. During the first half-cycle for
 $0< t< T/2$, the
 $x$-axis is the compressional axis and the
 $y$-axis is the elongational axis (
 $\dot {\epsilon }_x(t)<0,\dot {\epsilon }_y(t)>0$), and the fluid is delivered from the two horizontal inlets of the microfluidic device by the pressure regulators (figure 1b). During the second half-cycle for
 $T/2< t< T$, the direction of flow reverses, and fluid is delivered by the two vertical ports in the cross-slot device as shown in figure 1(b). We note that during vesicle trapping, the correctional pressure required for controlling the vesicle's position is small compared with the magnitude of the base pressure used to generate the oscillatory extensional flow (Shenoy et al. Reference Shenoy, Rao and Schroeder2016). Thus, the strain rate is well defined during the LAOE cycle, which is determined as a function of the input pressure using particle tracking velocimetry (known as PTV) as previously described (Kumar et al. Reference Kumar, Richter and Schroeder2020a). We also determined the characteristic response time for actuating fluid flow in the microfluidic device in response to a step change in pressure. For an extreme change in pressure from 0 to 27.58 kPa (strain rate jump from 0 to
 ${\sim }30\,\textrm {s}^{-1}$), the rise time and settling time are
 $\sim$20 ms and
 $\sim$300 ms, respectively (figure S1, see supplementary material). However, the maximum value of pressure used in our experiments is 2.76 kPa, which is continuously varied with small incremental changes during the LAOE cycle, for which we generally expect much smaller characteristic response times. Nevertheless, the lowest cycle time
 $T$ in our experiments is 2 s which is much larger than the maximum characteristic response time for actuating flow in the device corresponding to a step input pressure.
Stokes trap for studying vesicle dynamics in LAOE flow. (a) Schematic of the experimental set-up used to generate planar extensional flow. Inlet/outlet channels in the polydimethylsiloxane (PDMS) microfluidic device are connected to fluidic reservoirs containing the vesicle suspension and pressurized by regulators controlled by a custom LabVIEW program, thereby generating pressure-driven flow in the cross-slot. (b) Schematic of the sinusoidal strain rate input function for one full cycle. The insets are schematics showing the oscillatory extensional flow profile in the microfluidic cross-slot device during the first half ( $0< t< T/2$) and second half-period (
 $T/2< t< T$) of the cycle.

For all experiments, single vesicles are first trapped and imaged for 10–30 s under zero flow conditions to allow for equilibration, followed by LAOE flow for at least two strain rate cycles. During the equilibration step, the vesicle reduced volume  $\nu$ and equivalent radius
 $a$ are determined, as previously described (Dahl et al. Reference Dahl, Narsimhan, Gouveia, Kumar, Shaqfeh and Muller2016; Kumar et al. Reference Kumar, Richter and Schroeder2020a). Reduced volume
 $\nu$ is a dimensionless quantity that measures the amount of osmotic deflation, and is described as
 \begin{equation} \nu=\frac{3V\sqrt{4{\rm \pi}}}{A^{3/2}}, \end{equation}
where  $V$ and
 $A$ are the vesicle volume and surface area, respectively. The equivalent radius
 $a$ of the vesicle is obtained as
 $a=\sqrt {A/4{\rm \pi} }$. Specifically,
 $\nu$ is a measure of vesicle asphericity such that
 $\nu =1$ represents a perfectly spherical shape. For the experiments in § 3.1, 3.2, 3.4 and 3.5, the typical range of reduced volume is
 $0.75<\nu <1$, while vesicles in §§ 3.6 have
 $\nu <0.75$.
The maximum strain rate  $\dot {\epsilon }_0$ experienced by a vesicle in a half-cycle is non-dimensionalized to define a capillary number
 ${Ca} = \mu _{out}\dot {\epsilon }_0 a^3 / \kappa$ where
 $\mu _{out}$ is the suspending medium viscosity,
 $a$ is the equivalent vesicle radius and
 $\kappa$ is the membrane bending modulus. Prior to vesicle experiments in LAOE flow, we determined the average bending modulus of nearly spherical vesicles to be
 $\kappa =(22.3 \pm 0.5) k_B T$ using contour fluctuation spectroscopy (Kumar et al. Reference Kumar, Richter and Schroeder2020a). Similarly, the cycle period is rendered dimensionless by the bending time scale to define the Deborah number
 ${De} = \mu _{out} a^3 / \kappa T$. Single vesicle experiments are generally performed in the range
 $10 < {Ca} < 1000$ and
 $0.1 < {De} <100$ by adjusting the input pressures and strain rate cycle periods. Only vesicles near the centre plane of the microchannel (with respect to the
 $z$-direction) are considered during experiments. Single vesicle trajectories are analysed using a custom MATLAB program that allows for determination of the vesicle deformation parameter in the flow.
2.3. Numerical methods
2.3.1. Governing equations and non-dimensionalization
The system is modelled as a droplet surrounded by a two-dimensional (2-D) incompressible membrane with a bending resistance. At the length scale of a GUV ( $a \approx 10\, \mathrm {\mu }\textrm {m}$) with a strain rate at
 $\dot {\epsilon } \approx 1\,\textrm {s}^{-1}$ the Reynolds number is
 $Re = \dot {\epsilon } \rho a^2 / \mu \approx 10^{-4}$, allowing us to model the inner and outer velocity fields using the Stokes equations. Due to the nature of the time-dependent flow, it is also important to check the Womersley number to assess whether the time-dependent Stokes equations are required. At a flow frequency of
 $\omega = 10\,\textrm {s}^{-1}$, the Womersley number is
 $\alpha = \sqrt {\omega \rho a^2 / \mu } \approx 0.03$. In this work, the flow frequencies are
 $\omega < 10\,\textrm {s}^{-1}$, therefore, the time-dependent Stokes equations are not necessary. The Stokes equations are
 \begin{equation} \boldsymbol{\nabla} \boldsymbol{\cdot} \boldsymbol{u} = 0, \quad \boldsymbol{\nabla} p = \mu \nabla^2 \boldsymbol{u}, \end{equation}
where  $\boldsymbol {u}$ is fluid velocity,
 $p$ is the pressure and
 $\mu$ is the fluid viscosity (
 $\mu _{in}$ for the inner fluid and
 $\mu _{out}$ for the outer fluid). The system is subject to continuity of velocity across the interface and a traction balance across the phospholipid bilayer. The short time scales and low deformation rates used in previous studies makes membrane dilatation negligible (Rawicz et al. Reference Rawicz, Olbrich, McIntosh, Needham and Evans2000; Henriksen & Ipsen Reference Henriksen and Ipsen2004). Vesicles are also known to have negligible shear rigidity as they do not have a cytoskeletal network or an actin cortex. We therefore use the Helfrich model (Helfrich Reference Helfrich1973) for the membrane:
 \begin{equation} \mathbb{H} = \oint \frac{\kappa}{2} {(2H)}^2\,\textrm{d}A + \oint \sigma\,\textrm{d}A. \end{equation}
In (2.5),  $\mathbb {H}$ represents the elastic energy of the vesicle membrane,
 $\kappa$ is the membrane bending modulus,
 $H$ is the mean curvature and
 $\sigma$ is the surface tension. The surface tension is a spatially varying Lagrange multiplier that ensures local area conservation. The surface tension enforces
 $\boldsymbol {\nabla }_s \boldsymbol {\cdot } \boldsymbol {u} = 0$ on the interface, where
 $\boldsymbol {\nabla }_s = (\boldsymbol {I} - \boldsymbol {nn}) \boldsymbol {\cdot } \boldsymbol {\nabla }$. We note that the original Helfrich model includes spontaneous curvature, a parameter to describe a membrane's curvature preference when the sides of the bilayer are chemically different. Although biological vesicles may have multiple lipid components or chemical differences between the inner and outer fluids (Deuling & Helfrich Reference Deuling and Helfrich1976; Dobereiner, Selchow & Lipowsky Reference Dobereiner, Selchow and Lipowsky1999; Bagatolli & Sunil Kumar Reference Bagatolli and Sunil Kumar2009), our experiments focus on simple vesicles with only a viscosity difference between the inner and outer fluids, prompting a negligible spontaneous curvature. We further neglect contributions from thermal fluctuations, membrane viscosity and bilayer friction (Seifert Reference Seifert1997; Noguchi & Gompper Reference Noguchi and Gompper2005).
The force balance at the membrane surface is
 $$\begin{gather} [[\boldsymbol{f}]] = [[\boldsymbol{T} \boldsymbol{\cdot} \boldsymbol{n}]] = \boldsymbol{f_t} + \boldsymbol{f_b}, \end{gather}$$
 $$\begin{gather}\boldsymbol{f_t} = (2H\sigma \boldsymbol{n} - \boldsymbol{\nabla}_{s} \sigma), \end{gather}$$
 $$\begin{gather}\boldsymbol{f_b} = \kappa (4KH - 4H^3 - 2\boldsymbol{\nabla}_{s}^{2} H)\boldsymbol{n}, \end{gather}$$
where  $[[\boldsymbol {f}]]$ is the jump in viscous traction across the interface which can be decomposed into the bending (
 $\boldsymbol {f_b}$) and tension (
 $\boldsymbol {f_t}$) contributions,
 $\boldsymbol {n}$ is the outward-pointing unit normal vector and
 $K$ is the Gaussian curvature of the interface. The mean curvature
 $H$ is defined to be one for the unit sphere.
The vesicle is placed in a time-dependent extensional flow field described by  $\boldsymbol {u}^{\infty } = \boldsymbol {\nabla } \boldsymbol {u}^{\infty } \boldsymbol {\cdot } \boldsymbol {x}$ and defined as
 \begin{equation} \boldsymbol{\nabla}\pmb{u}^{\infty} = \dot{\epsilon}_0 \begin{bmatrix} -\sin( 2 {\rm \pi}\omega t) & 0 & 0 \\ 0 & \sin(2 {\rm \pi}\omega t) & 0 \\ 0 & 0 & 0 \end{bmatrix}, \end{equation}
where  ${\omega }$ is the frequency of the oscillatory flow and
 $\dot {\epsilon }_0$ is the maximum strain rate.
The membrane area ( $A$) is maintained constant by the incompressibility constraint while the low permeability of the membrane allows us to assume that the volume (
 $V$) of the vesicle is constant during the time scale of experiments (minutes). Therefore, we non-dimensionalize distances by the equivalent radius
 $a = \sqrt []{A/(4{\rm \pi} )}$, time scales by
 $\kappa / a^3 \mu _{out}$, velocities by
 $\kappa / a^2 \mu _{out}$, stresses by
 $\kappa / a^3$ and surface tensions by
 $\kappa / a^2$. We obtain four relevant dimensionless groups from the non-dimensionalization:
 \begin{equation} \left. \begin{gathered} {Ca} \equiv \frac{\mu_{out}\dot{\epsilon}_0 a^3}{\kappa}, \quad {De} \equiv \frac{\omega a^3 \mu_{out}}{\kappa}, \\ \lambda \equiv \frac{\mu_{in}}{\mu_{out}}, \quad \nu \equiv \frac{3V}{4{\rm \pi} a^3}. \end{gathered} \right\} \end{equation}
These parameters were previously described in § 2.2 and are elaborated upon here. The base capillary number  $({Ca})$ compares the viscous stress with the bending stress and corresponds to the non-dimensionalized, maximum extension rate experienced by the vesicle during the flow cycle. Here
 ${De}$ is the flow frequency non-dimensionalized by the bending time scale. When
 ${De} \gg 1$, the fluid flow will have a short cycle time compared with the membrane's bending time. The viscosity ratio (
 $\lambda$) is the ratio of inner and outer fluid viscosities. Cellular systems such as red blood cells (known as RBCs) commonly have a more viscous inner fluid, and this parameter can be tuned to more closely model the system of choice. The reduced volume (
 $\nu$) is a measure of the asphericity of the vesicle, corresponding to its osmotic deflation. For example, a reduced volume of
 $\nu = 1$ corresponds to a perfectly spherical vesicle shape, while a value of
 $\nu = 0.2$ would be a highly deflated one. One can experimentally alter the reduced volume of a vesicle by introducing an osmotic pressure difference between the inner and outer membranes, for example by adding sucrose to the outer fluid.
Applying this non-dimensionalization, the external velocity gradient becomes
 \begin{equation} \boldsymbol{\nabla}\pmb{u}^{\infty} = {Ca} \begin{bmatrix} -\sin( 2 {\rm \pi}{De} \: t) & 0 & 0 \\ 0 & \sin(2 {\rm \pi}{De} \: t) & 0 \\ 0 & 0 & 0 \end{bmatrix}, \end{equation}
where all parameters are assumed to be non-dimensional from this point forward.
2.3.2. BI formulation
The Stokes flow assumption enables the use of the BI (Green's function) formulation to simulate vesicle shape dynamics. The Stokes equations are recast into a BI form
 $$\begin{gather} \frac{1+\lambda}{2} u_j(\boldsymbol{x_0}) = u_j^{\infty}(\boldsymbol{x_0}) - \frac{1}{8{\rm \pi}}\int_S G_{ij}(\boldsymbol{x},\boldsymbol{x_0})[[f_i]](\boldsymbol{x})\,\textrm{d}A(\boldsymbol{x}) \nonumber\\ + \frac{1 - \lambda}{8{\rm \pi}}\int_S T_{ijk}(\boldsymbol{x}, \boldsymbol{x_0}) u_i(\boldsymbol{x})n_k(\boldsymbol{x})\,\textrm{d}A(\boldsymbol{x}) \end{gather}$$
where  $u_i^{\infty }$ is the external velocity field,
 $\boldsymbol {x}_0$ is the singularity point and
 $[[f_i]]$ is the jump in viscous traction across the interface, given in (2.8). The kernels
 $G_{ij}(\boldsymbol {x},\boldsymbol {x_0})$ and
 $T_{ijk}(\boldsymbol {x}, \boldsymbol {x_0})$ are the Stokeslet (point force) and stresslet (point dipole) solutions to Stokes flow
 \begin{gather} G_{ij}(\boldsymbol{x} , \boldsymbol{x}_0) = \frac{\delta_{ij}}{r} + \frac{\tilde{x}_i \tilde{x}_j}{r^3}, \end{gather}
 \begin{gather} T_{ijk}(\boldsymbol{x} , \boldsymbol{x}_0) ={-}6 \frac{\tilde{x}_i \tilde{x}_j \tilde{x}_k}{r^5}, \end{gather}
where  $\tilde {\boldsymbol {x}} = \boldsymbol {x} - \boldsymbol {x}_0$ and
 $r = |\tilde {\boldsymbol {x}}|$. Repeated indices are assumed to be summed in the above equations. These equations are also subject to the membrane incompressibility constraint:
 \begin{equation} \boldsymbol{\nabla}_s \boldsymbol{\cdot} \boldsymbol{u} = 0. \end{equation}
2.3.3. Implementation details
Implementation details for the simulations are similar to prior work (Lin & Narsimhan Reference Lin and Narsimhan2019). Here, we reiterate how some aspects are handled, and highlight a few key differences. We solve the boundary element method system with the general minimal residual method (known as GMRES) in parallel using PETSc over the message passing interface (known as MPI). The curvature of the surface is approximated by a subdivision surface (Cirak, Ortiz & Schröder Reference Cirak, Ortiz and Schröder2000; Spann, Zhao & Shaqfeh Reference Spann, Zhao and Shaqfeh2014). Integrals over the triangular elements are evaluated using Gaussian quadrature, where singular elements are handled by using the Duffy quadrature rule for singular kernels (Duffy Reference Duffy1982). We use a time-stepping procedure that is equivalent to the one in Zhao & Shaqfeh (Reference Zhao and Shaqfeh2013). The surface incompressibility constraint is enforced by the Lagrange multiplier  $\sigma$, which is locally determined with each time step. The constant volume constraint is inherently enforced by the Stokes flow assumption for the inner and outer fluids, but the time-stepping procedure used for the surface positions can still give a slight drift in volume over long times (Zhao & Shaqfeh Reference Zhao and Shaqfeh2013). We use a scaling procedure with an arbitrary relaxation parameter of 0.1 that limits the scaling such that the correction is not immediately applied, but rather applied over several time steps to keep the volume consistent. Graphs showing the surface area and volume error are shown in the supplementary material (figure S11) available at https://doi.org/10.1017/jfm.2021.885. These errors oscillate and the maximum surface area errors are below 0.1 % while the maximum volume errors are below 0.2 %.
For meshing the vesicle, we start with an icosahedron and subdivide the mesh into 1280 elements for a quasi-spherical vesicle and 5120 elements for the tubular vesicles. In the following sections, we analyse the deformation parameter of the vesicles; we found the 1280 element mesh to be sufficiently accurate capturing this information. A figure comparing the deformation parameter over several flow cycles for the 1280 element mesh and a 9680 element mesh is in the supplementary materials (figure S12). We tested mesh sizes from 720 elements to 9680 elements and found no significant difference in the deformation parameter over the flow cycles between them. However, the 1280 element mesh used does not accurately resolve the wrinkling dynamics. Our implementation does not take into account thermal fluctuations, making it unlikely the simulations would accurately predict the wrinkling dynamics even with smaller element sizes. Therefore, we chose to use lower element meshes to reduce computation time.
To form the initial vesicle shape for our simulations, we use a scaling transformation on the subdivided icosahedron to deform the mesh into a prolate spheroid with the desired reduced volume  $\nu$, followed by relaxing the mesh to its equilibrium (no flow) configuration. In this way, the vesicle has a prolate spheroid-like shape at the start of any cycle. It is possible to start with an oblate spheroid or any arbitrary ellipsoid-like shape, but it has been shown that the global minimum energy state for a vesicle with reduced volume greater than 0.652 is of the prolate shape family (Seifert Reference Seifert1997). After forming the initial vesicle shape, vesicle dynamics are simulated in oscillatory flow with a time step of
 $10^{-3}$ strain units.
The majority of the analysis in this study is focused on vesicle behaviour that has reached a steady limit cycle in time-dependent flow, such that the dynamics are the same regardless of the number of additional strain rate cycles. The start-up dynamics have been simulated but are not elaborated on in this paper. We simulate vesicles of reduced volumes between  $0.60 < \nu < 0.90$ and viscosity ratios
 $\lambda = 0.1, 1.0$ and
 $10$ for flows with capillary numbers
 $1 < {Ca} < 80$ and Deborah numbers
 $1 < {De} < 10$. Significantly higher capillary numbers (
 ${Ca} \gtrapprox 200$) become numerically intractable as the time step needed for convergence in our implementation becomes prohibitively small. Higher and lower
 ${De}$ can be simulated, but the current range of values is sufficient for comparison with the majority of experimental conditions for GUVs in microfluidic devices.
We define the parameter
 \begin{equation} {Ca}_x(t) \equiv{-}{Ca} \sin({2 {\rm \pi}{De} \cdot t}) \end{equation}
which represents the time-dependent capillary number in the  $x$-direction. This will be the measure used for the instantaneous strain rate. We also define a deformation parameter
 \begin{equation} D \equiv \frac{l_x - l_y}{l_x + l_y}, \end{equation}
where  $l_x$ and
 $l_y$ are the
 $x$- and
 $y$-axis lengths of the vesicle, respectively, or the length of the axes of the equivalent ellipsoid. In the experiments,
 $l_x$ and
 $l_y$ are computed from the vesicle microscopy movies using a custom image processing algorithm as described in Zhou & Schroeder (Reference Zhou and Schroeder2016a) and Kumar et al. (Reference Kumar, Richter and Schroeder2020a). For the simulations, the lengths of the vesicle in the
 $x$- and
 $y$-axes are computed. The deformation parameter (
 $D$) provides a measure of vesicle shape distortion. For
 $D$ values near zero, the vesicle shape projected in the
 $x$–
 $y$ plane will be circular. Positive values of
 $D\approx 0.50$ correspond to prolate spheroid-like shapes along the
 $x$-axis, while negative values correspond to the same shapes along the
 $y$-axis.
3. Results and discussion
3.1. Dynamical regimes
Experiments were performed in the range of approximately  $10 < {Ca} < 1000$ and
 $0.5 < {De} < 100$, whereas the majority of the simulations are in the range of
 $1 < {Ca} < 40$ and
 $1 < {De} < 10$. Simulations were performed for several vesicles matching the conditions in the experiments, as discussed in the following section (figures 2–4). It is possible to perform additional simulations at
 ${Ca} \approx 100$, but current results suggest that the vesicle dynamics do not significantly change at higher
 $Ca$ for quasi-spherical vesicles.
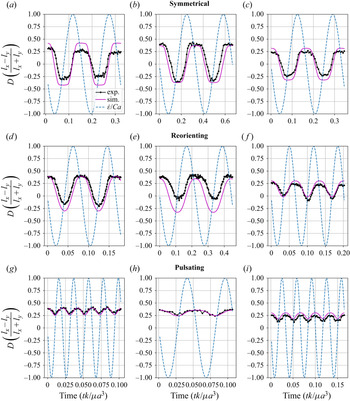
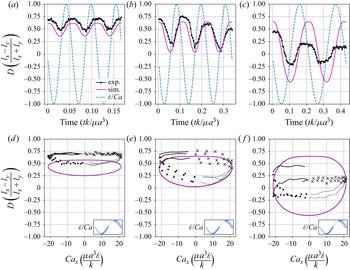
Transient deformation parameter  $D$ for vesicle dynamics in time-dependent LAOE from experiments and simulations. All vesicles have a viscosity ratio of
 $\lambda = 1.0$. The
 $\dot {\epsilon }/{Ca}$ line is the instantaneous strain rate of the external flow along the
 $x$-axis. A negative
 $\dot {\epsilon }/{Ca}$ value is compression along the
 $x$-axis. For each panel: (a)
 $Ca = 28.8$,
 $De = 6.40$,
 $\nu$ = 0.85; (b)
 $Ca = 10.9$,
 $De = 3$,
 $\nu$ = 0.88; (c)
 $Ca$ = 17.9,
 $De = 6$,
 $\nu$ = 0.91; (d)
 $Ca$ = 28.8,
 $De = 12$,
 $\nu$ = 0.85; (e)
 $Ca$ = 10.9,
 $De = 4.5$,
 $\nu$ = 0.88; (f)
 $Ca$ = 17.9,
 $De = 14.9$,
 $\nu$ = 0.91; (g)
 $Ca$ = 28.8,
 $De = 48$,
 $\nu$ = 0.85; (h)
 $Ca$ = 10.9,
 $De = 18.2$,
 $\nu$ = 0.88; (i)
 $Ca$ = 17.9,
 $De = 29.9$,
 $\nu$ = 0.91.

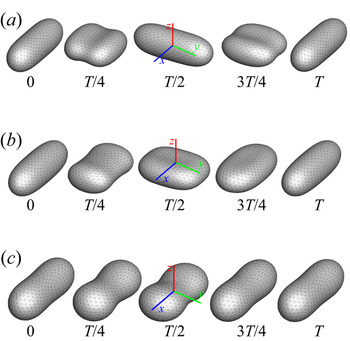
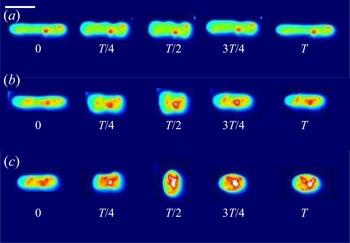
We observe three dynamical regimes of vesicle dynamics based on the ratio between capillary number and Deborah number. We refer to these regimes as symmetrical, reorienting and pulsating. The transitions between these regimes are continuous – in other words, there is no bifurcation between the regimes in the sense that the dynamics change suddenly. We define the regimes based on the deformation characteristics of vesicles in each case: symmetrical when the vesicle deforms to the same length in both orientations; pulsating when the vesicle's major axis stays along the same orientation; reorienting for the region between symmetrical and pulsating where the vesicle major axis changes orientation but does not deform to the same maximum length in both directions. Vesicles in all three regimes can experience significant nonlinear stress responses. Snapshots of vesicle shapes from simulations and experiments for each of these regimes over a full strain rate cycle are shown in figures 5 and 6.
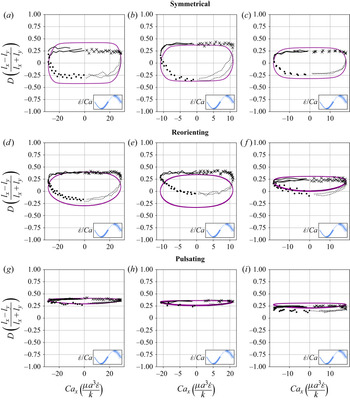
We quantitatively compare the simulations and experiments by plotting the deformation parameter  $D$ (defined in (2.17)) and instantaneous strain rate
 ${Ca}_x$ (defined in (2.16)) as a function of time, as shown in figures 2 and 3. Experimental trajectories are generally limited to 2–4 strain rate cycles due to the photobleaching of the vesicle membrane during fluorescence imaging experiments. Observing vesicle deformation over more strain rate cycles is experimentally feasible, however, we generally opted to observe dynamics under different experimental parameters (
 $Ca$,
 $De$) for the same vesicle in a series of subsequent experiments. For the numerical data, we simulated vesicle dynamics over at least 10 strain rate cycles.
Lissajous-type curves of the deformation parameter  $D$ versus the dimensionless instantaneous strain rate. All vesicles have a viscosity ratio of
 $\lambda = 1.0$. Black data points are experimental data; purple data points show numerical data. The oscillatory strain rate cycle is separated into four parts that have been noted with different markers, as shown in the legend in the bottom right-hand corner of each panel. For each panel: (a)
 $Ca$ = 28.8,
 $De = 6.4$,
 $\nu$ = 0.85; (b)
 $Ca$ = 10.9,
 $De = 3$,
 $\nu$ = 0.88; (c)
 $Ca$ = 17.9,
 $De = 6$,
 $\nu$ = 0.91; (d)
 $Ca$ = 28.8,
 $De = 12$,
 $\nu$ = 0.85; (e)
 $Ca$ = 10.9,
 $De = 4.5$,
 $\nu$ = 0.88; (f)
 $Ca$ = 17.9,
 $De = 14.9$,
 $\nu$ = 0.91; (g)
 $Ca$ = 28.8,
 $De = 48$,
 $\nu$ = 0.85; (h)
 $Ca$ = 10.9,
 $De = 18.2$,
 $\nu$ = 0.88; (i)
 $Ca$ = 17.9,
 $De = 29.9$,
 $\nu$ = 0.91.

Symmetrical regime. Starting with the symmetrical regimes results, we find the symmetrical regime occurs under flow conditions where the vesicle deformation time scale is shorter or exactly equal to half of a strain rate cycle. Based on our simulations, this occurs approximately when  ${Ca} \geq 3.33 {De}$ for a vesicle with a reduced volume
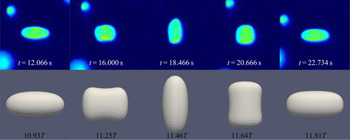
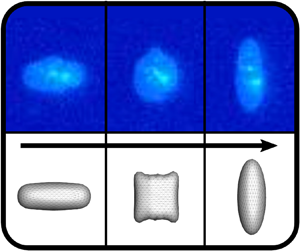
 $\nu = 0.80$. Our experiments and simulations show that vesicle dynamics in the symmetrical regime are described by two common characteristics (figure 4). First, the vesicle reaches approximately the same maximum length twice during one strain rate cycle, regardless of
 ${Ca}$. The observation of a maximum length is reasonable for quasi-spherical vesicles, as it has been shown that vesicles with
 $\nu > 0.75$ have a stable steady-state shape at infinite
 ${Ca}$, regardless of viscosity ratio (Narsimhan et al. Reference Narsimhan, Spann and Shaqfeh2014). Second, vesicle membranes exhibit transient wrinkling when vesicles are exposed to the compressional cycle of the oscillatory extensional flow. The transient wrinkling behaviour is examined later in this section. These features are illustrated in figure 4, where a characteristic time series of images of vesicle shape in LAOE is qualitatively compared with the equivalent numerical simulation. In general, vesicle shapes determined from experiments are in good agreement with those determined from numerical simulations. Turning to the deformation parameter plots (figures 2 and 3), we see the simulations and experiments agree well at the majority of the tested parameters. Some of the experimental datasets show fluctuations in the deformation over the strain rate cycles and disagreement between the simulations on the maximum deformation. These discrepancies likely occur due to challenges in imaging a three-dimensional (3-D) object in a 2-D plane and because the experiments are limited to a few strain rate cycles. Nevertheless, we generally observe good agreement between simulations and experiments in terms of the deformation parameter in transient flows.
Comparison of the experimental and simulation vesicle shapes in the symmetrical regime over one flow cycle at the same conditions of  $Ca$ = 10.9,
 $De = 3.0$,
 $\nu$ = 0.88,
 $\lambda$ = 1.00. The times in the figure are in seconds for the experimental movie. Shapes from the simulations at the same non-dimensional cycle times are shown below. Here
 $T$ is the non-dimensional period, defined as
 $T = 1/ {De}$.

Transient wrinkling dynamics were first reported by Kantsler et al. (Reference Kantsler, Segre and Steinberg2007) for a single cycle of suddenly reversed extensional flow and subsequently elaborated upon by Turitsyn & Vergeles (Reference Turitsyn and Vergeles2008). Wrinkling behaviour is caused by a negative surface tension created during vesicle compression. Moreover, a critical compression rate exists below which thermal fluctuations dominate the observed wrinkling. In our work, we study vesicle dynamics in an extensional flow with smoothly varying sinusoidal strain rate dependence, rather than an abrupt step-function reversal of compressional/extensional axes. We observe qualitatively the same membrane wrinkling features as those reported in prior work. In the experiments, we observe some wrinkling in the majority of the movies; it is unclear if this is from thermal fluctuations or the negative surface tension. In the simulations, we only observe significant wrinkling in the symmetrical regime. Our simulations do not take into account thermal fluctuations, therefore, we hypothesize that the critical wrinkling strain rate required for a given flow frequency is only reached in the symmetrical regime. Additional experimental snapshots of vesicles showing wrinkling dynamics are included in the supplementary materials (figures S2–S5).
Reorienting regime At lower  ${Ca} / {De}$ ratios (when
 ${Ca} \approx 2{De}$ for
 $\nu =0.80$), the vesicle's major axis orientates along the
 $x$- and
 $y$-axes during the flow cycle, but the stretching along these axes will no longer be equal. The creates a deformation parameter that is negative during part of the cycle, but whose mean value is non-zero (figure 2d). We note that in prior work on droplets in oscillatory extensional flow we do not observe this behaviour, as only symmetrical deformation (i.e. equal deformation in the
 $x$- and
 $y$-orientations) has been reported regardless of flow strength and oscillatory frequency (Li & Sarkar Reference Li and Sarkar2005a,Reference Li and Sarkarb). Single polymers in LAOE also deform symmetrically between the two half-cycles for the range of Weissenberg and Deborah numbers studied in prior work (Zhou & Schroeder Reference Zhou and Schroeder2016a). The phenomenon of asymmetric stretching of vesicles along the two axes arises due to the enclosed membrane for fluid-filled vesicles. In particular, we posit that the asymmetrical deformation occurs because the energetically preferred shape for quasi-spherical vesicles at equilibrium is a prolate dumbbell (Seifert Reference Seifert1997). By deforming in this asymmetrical manner, the vesicle shape deviates less from the equilibrium shape over the strain rate cycle than it would if it deformed symmetrically.
Pulsating regime. At even lower  ${Ca} / {De}$, the vesicle no longer reorients and simply pulsates along one axis during LAOE. We refer to this dynamical regime as the pulsating regime, which approximately occurs when
 ${Ca} \le 2 {De}$ for
 $\nu = 0.80$. Note that the strain in the pulsating regime is not necessarily infinitesimal. As shown in figure 2(g), the deformation parameter curve illustrates that vesicles are generally oriented along the
 $x$-axis and can deform significantly in this regime. It is possible to probe the small amplitude oscillatory extension regime by keeping the
 ${De}$ constant and reducing the
 ${Ca}$. In the small amplitude regime, vesicles do not deform appreciably, and the Lissajous curve approaches a constant value, thereby informing on the linear viscoelastic rheology of vesicle suspensions. Similar behaviour occurs when increasing the
 ${De}$ and keeping
 ${Ca}$ constant at small values. In this case, the membrane does not have appreciable time to reorient during the time at which the strain rate changes.
3.2. quasi-spherical initial shape and orientation
The simulations discussed up to this point (including results in figures 5 and 2) were performed using a prolate-like initial shape, because it is the global equilibrium shape for reduced volumes  $\nu \geq 0.652$ (Seifert Reference Seifert1997). These results suggest that the unequal stretching observed in the pulsating and reorienting regimes occurs during the steady limit cycle, for this particular initial shape. However, there are other local minimum energy shapes for vesicles, such as the oblate shape family. To determine whether the pulsating and reorienting regimes are possible with a different initial condition, we performed simulations using an oblate shape such that the initial deformation parameter was set to zero. We examined this initial condition because vesicle shape is isotropic in the
 $x$–
 $y$ plane, where an image obtained through optical microscopy would show a circle. The oblate initial condition simulations test if the anisotropic deformations will still occur if the vesicle starts with a shape isotropic in the
 $x$–
 $y$ plane rather than an initially anisotropic shape. Simulation results for the oblate initial condition are plotted in figure 7, which shows that vesicle dynamics during the steady limit cycle for the oblate initial condition (figure 7a) are the same as that observed from the prolate-like initial condition (figure 7b). We repeated these simulations at several other capillary numbers and Deborah numbers, observing no change in the dynamics.
Snapshots of vesicle shapes from simulations over a flow cycle for the three dynamical regimes. The values under the figures are fractions of a strain rate period defined as  $T = 1/{De}$.

Snapshots of vesicle shapes from experiments over a flow cycle for the three dynamical regimes. The values under the figures are fractions of cycle time  $T$ in seconds. Scale bar is 20
 $\mathrm {\mu }$m. False colour is applied to the greyscale images for enhancing the resolution.

Lissajous-type deformation parameter curves from an oblate shape initial condition and a prolate shape initial condition. The legend at the top right in each panel indicates colour coding for the strain rate cycle. The black circle marks the deformation parameter of the initial shape. The panels are (a) oblate initial; (b) prolate initial.

We additionally examined different starting orientations of the prolate initial shape. Aligning the prolate vesicle with the  $y$-axis instead of the
 $x$-axis does not change the dynamics significantly. The symmetrical regime remains unchanged, while the pulsating and reorienting regimes preferentially stretch along the
 $y$-axis instead of the
 $x$-axis. The observed dynamics change when aligning the prolate vesicle along the
 $z$-axis – i.e. orthogonal to the flow plane. At lower ratios of
 $Ca/De$, the vesicle deforms symmetrically while maintaining the major axis orientation along the
 $z$-axis. At higher ratios of
 $Ca/De$, the dynamics become the same as those observed in the symmetrical regime with other starting orientations. We also simulated vesicles at other out-of-plane orientations and found they can maintain their orientation at low ratios of
 $Ca/De$ over 15 flow cycles. Simulation movie files of vesicle dynamics starting from the
 $z$-axis orientation and angled at 70 degrees between the
 $x$- and
 $z$-axes are included in the supplementary materials (movies 8–10).
Experimentally, we have not observed any of the dynamics suggested by the simulations with alternative starting orientations. It is unclear if these orientations are unstable to perturbation or if the experimental methods limit the possible orientations of the vesicles. One would need to use a microscopy method that can obtain  $z$-axis information to better understand the effect of starting orientation.
3.3. LAOE analysis considerations
In regards to the application of LAOE for vesicle analysis, we note that it may be possible to extract some material properties of the vesicle by LAOE analysis. One could fit the deformation parameter over time of an experimental run to that of a simulation to approximate an unknown parameter, such as the reduced volume or capillary number. There are significant error margins when approximating experimental parameters, such as reduced volume, so confirmation with LAOE could be beneficial. We have not tested the feasibility or accuracy of such a process in this study, however.
3.4. quasi-spherical phase diagrams
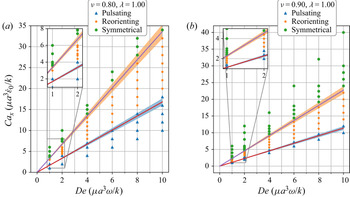
By comparing the deformation parameter results for each simulation, we can plot a phase diagram of different dynamical regimes observed during oscillatory flows. Which regime a vesicle experiences can be quantitatively determined by assessing the minimum and maximum deformation parameter over a cycle. If both the minimum and maximum deformation parameter are positive, the vesicle dynamics are classified as the pulsating regime, reflecting that the vesicle does not change orientation. If the vesicle has a positive maximum  $D$ and a negative minimum
 $D$, we check if the differences in magnitudes are within a threshold value of 0.01. Should they be within 0.01 of each other, the vesicle is in the symmetrical regime, since the vesicle reaches the same maximum length twice a cycle. This threshold value was chosen heuristically to reflect the discretization accuracy. If the magnitudes are not within this threshold value, vesicle dynamics are classified as the reorienting regime. Results from this analysis are plotted in figure 8
Phase diagrams for the low to medium to high deformation regimes for vesicles of reduced volume  $\nu = 0.80$ and
 $\nu = 0.90$. Lines in the diagrams are from the semianalytical theory presented near the end of § 3.1. Due to uncertainty in determining the
 $D_{o}$ value, a 5 % error has been included on the lines.

The phase boundaries appear to be mostly linear, suggesting that the dynamics result from a simple interaction between the flow frequency and the strain rate,  ${Ca}/{De}=\dot {\epsilon }_0/\omega$. Here, we derive the phase boundaries in the limit of a quasi-spherical vesicle (Vlahovska & Gracia Reference Vlahovska and Gracia2007). For small excess area (
 $\varDelta =4{\rm \pi} (\nu ^{-2/3}-1)\ll 1$), the vesicle shape is characterized by a perturbation series in terms of spherical harmonics (Vlahovska & Gracia Reference Vlahovska and Gracia2007). In a planar extensional flow, there are only two modes excited for the leading-order correction to the vesicle shape. When one solves for the deformation parameter as defined in (2.17), one obtains
 \begin{align} &D(t) = (L_{\infty}-1)\nonumber\\ &\quad \left(1-2\left(1+\left(\frac{1+A_o}{1-A_o}\right)\exp\left(\frac{60}{{\rm \pi}(32+23\lambda)}\frac{{Ca}}{{De}}\frac{1}{L_{\infty}-1}\left[\cos(2{\rm \pi} {De}\, t)-1\right]\right)\right)^{{-}1}\right), \end{align}
where parameters  $L_{\infty }=1+\sqrt {15/8}(\nu ^{-2/3}-1)^{1/2}$ and
 $A_o = (\nu ^{-1/3}l_x^{max}/2-1)/(L_{\infty }-1)$;
 $l_x^{max}$ is the maximum
 $x$-axis length of the vesicle. For the detailed derivation of these results, one can refer to the supporting material.
Following the definitions of the phase boundaries discussed previously, we can derive the two phase boundaries in the limit of  $A_0 \ll 1$, i.e.
 $\ln (({1+A_o})/({1-A_o}))\approx {1}/{(L_{\infty }-1)}\ln (({1+D_o})/({1-D_o}))$,
 \begin{gather} \frac{{Ca}}{{De}}=\frac{{\rm \pi}(32+23\lambda)}{120}\log\left(\frac{1+D_o}{1-D_o}\right)\quad \text{for pulsating}/\text{reorienting phases}, \end{gather}
 \begin{gather} \frac{{Ca}}{{De}}=\frac{{\rm \pi}(32+23\lambda)}{60}\log\left(\frac{1+D_o}{1-D_o}\right) \quad \text{for reorienting}/\text{symmetrical phases}. \end{gather}
In the above equations,  $D_0$ is the maximum deformation parameter during the LAOE cycle. Note that the value of
 $D_o$ is determined by our numerical runs at the highest
 ${Ca}$ and
 ${De}$ numbers. Based on the quasi-spherical vesicle theory, the deformation phase boundaries depend on the viscosity ratio, where the factor
 ${(23\lambda +32)}^{-1}$ is related to the relaxation time of the quasi-spherical vesicle (Vlahovska & Gracia Reference Vlahovska and Gracia2007). Figure 8(a) shows the phase boundaries are accurately calculated by using (3.2) and (3.3) when the reduced volume is
 $\nu =0.8$. Increasing
 $\nu$ from 0.80 to 0.90 shifts the phase boundaries downwards, but maintains a similar linear relation (figure 8b). We also simulated viscosity ratio
 $\lambda = 10$ and found that higher viscosity ratios shift the boundaries to higher capillary numbers. We include the dynamics evolution of
 $l_x$ and
 $l_y$ (simulations versus analytical solutions) and
 $\lambda = 10$ results in the supplementary materials for brevity.
3.5. Stress response and dilute suspension rheology
For dilute vesicle suspensions where the macroscopic length scale is large in comparison with the size of the vesicles, the extra stress (the bulk stress contribution from the particles) is the product of the number density of particles and the particle stresslet:  $\sigma _{ij}^{P} = n \: \tilde {S}_{ij}^{P}$. Using the BI formulation, we calculate the particle stresslet (Pozrikidis Reference Pozrikidis1992)
 \begin{equation} \tilde{S}_{ij}^P = \int_D {\frac{1}{2} ([[f_i]] x_j + [[f_j]] x_i)}\,\textrm{d}S - \int_D {(1 - \lambda) \mu_{{out}} (v_i n_j + v_j n_j)}\,\textrm{d}S, \end{equation}
where  $[[\boldsymbol {f}]]$ is the surface traction,
 $\lambda$ is the viscosity ratio,
 $\mu _{{out}}$ is the outer viscosity,
 $\boldsymbol {v}$ is the velocity and
 $\boldsymbol {n}$ is the normal vector. We define the dimensionless particle coefficient of stresslet as
 \begin{equation} S_{ij} = \frac{\tilde{S}_{ij}^P}{\dot{\epsilon} \mu_{{out}} V_p}, \end{equation}
where  $V_p$ is the vesicle volume and
 $\dot {\epsilon }$ is the strain rate. Similarly the normal stress differences are defined as
 $$\begin{gather} N_1 = S_{xx} - S_{yy}, \end{gather}$$
 $$\begin{gather}N_2 = S_{yy} - S_{zz}. \end{gather}$$
Comparing the normal stress differences with the strain rate, we can derive the rheological characteristics of a dilute vesicle suspension, such as the effective viscosity and bulk normal stresses (Danker, Verdier & Misbah Reference Danker, Verdier and Misbah2008). For extensional flow rheology, a key quantity of interest is the extensional viscosity of a solution. Extensional viscosity is often characterized using a quantity known as a Trouton ratio (ratio of extensional to shear viscosity), which for a planar extensional flow is a multiple of  $N_1$. For a planar flow, the extensional viscosity is
 \begin{equation} \eta_E = \frac{\sigma_{11} - \sigma_{22}}{\dot{\epsilon}}. \end{equation}
The planar Trouton ratio is
 \begin{equation} \frac{\eta_E}{\eta} = 4 + \phi * N_1, \end{equation}
where  $\phi$ is the volume fraction of vesicles in the suspensions, and
 $N_1$ is the first normal stress difference. Our simulations have focused on rather large deformations of the vesicle shape, therefore, the stress response analysis will reflect the nonlinear viscoelasticity.
We examine the stress response for a vesicle that starts off oriented along the  $x$-axis. To link the single vesicle stress response to the expected bulk response for a suspension of randomly oriented vesicles, one needs to average over all possible orientations. Therefore, the following results would instead be indicative of a suspension of vesicles all initially oriented along the
 $x$-axis. However, in the symmetrical regime, all of the starting orientations we tested lead to the same dynamics for the limit cycle behaviour. It is possible that the bulk stress response in the symmetrical regime at the limit cycle does not depend on starting orientation. In the pulsating and reorienting regimes on the other hand, the stable orientations depend on several parameters that we have not examined in detail in this study – as reported in § 3.2.
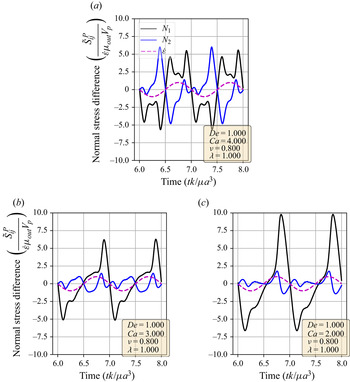
Using the definitions of the particle stresslet and normal stress differences, we determine the vesicle stress as a function of time in extensional flow. In figure 9, we show the stress response over two cycles for three sets of parameters; one from each of the three dynamical regimes discussed before. A linearly viscoelastic material will show purely sinusoidal normal stress differences for this type of plot, as there is a simple linear relation between the strain rate and the stress. On the other hand, for nonlinear viscoelasticity, the normal stress differences will display more complex behaviours.
Normal stress differences versus time for simulations in the pulsating, reorienting and symmetrical regimes. Data over two strain rate cycles is plotted. The  $\dot {\epsilon }/{Ca}$ dotted line is the strain rate of the external flow; it is used to show the directionality of the flow. Parameters used are included in the figure legends. The panels are (a) symmetrical regime; (b) reorienting regime; (c) pulsating regime.

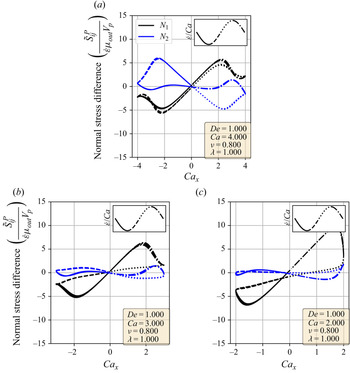
Figure 9 shows that vesicle dynamics in the three regimes (symmetrical, reorienting and pulsating) have nonlinear characteristics. To analyse these stress responses, we replot the data from figure 9 into a Lissajous-type form with the instantaneous strain rate ( ${Ca}_x$) on the
 $x$-axis and the stress response on the
 $y$-axis (figure 10). For this type of plot, a purely viscous material would display a straight line, whereas a purely elastic material would produce an elliptical curve. For example, the first and second normal stress difference for Newtonian flow around a rigid sphere corresponds to the lines
 $N_1 = 10 \times {Ca}_x/{Ca}$ and
 $N_2 = -5 \times {Ca}_x / {Ca}$. Here, we focus on
 $N_1$ because it is related to the extensional viscosity of the solution (Trouton ratio). We also discuss the
 $N_2$ stress differences for completeness.
Lissajous-type normal stress difference versus strain rate ( ${Ca}_x$) curves for simulations in the pulsating, reorienting and symmetrical regimes. The strain rate cycle is separated into four periods demarcated by the line formatting. Parameters used are included in the figure legends. The panels are (a) symmetrical regime; (b) reorienting regime. (c) pulsating regime.

In the symmetrical regime (figure 10a), we observe that  $N_1$ is symmetric across the origin and that the lines for increasing and decreasing strain rate are nearly the same for
 $-2 < {Ca}_x <2$. On the other hand,
 $N_2$ differs significantly depending on the directionality of the flow. The
 $N_1$ curve is mostly linear in the region
 $-2 < {Ca}_x < 2$ and is approximately equal to zero when the strain rate is zero, suggesting that the vesicle contributes a purely viscous response in that region. We further examine this region in more detail by comparing the vesicle deformation with the stress response. From the simulation movie and the Lissajous-type deformation parameter curve (figure 3), we know that the vesicle retains a prolate spheroid-like shape and only changes marginally for the
 ${-2 < {Ca}_x < 2}$ region. The relatively small amount of deformation that occurs in the
 $-2 < {Ca}_x < 2$ region suggests that the vesicle acts like a rigid particle there, explaining the close to linear stress response for
 $N_1$ in the region. In the other strain rate regions, the stress differences shift rapidly in accordance to the vesicle's large deformations and reorientation.
In the reorienting and pulsating regimes (figure 10b,c), the  $N_1$ curves are no longer symmetric across the origin, and the stress responses for increasing and decreasing strain rate are distinct. The maximum
 $N_1$ response is larger in magnitude than the minimum for both regimes; this is likely due to the unequal amounts of deformation between the two strain rate period halves (figure 3). For this analysis, qualitative differences between the shape of the reorienting and pulsating regime curves correspond to the extent of asymmetry in the
 $N_1$ response. Moreover, we observe vesicles in the pulsating regime can have a non-zero normal stress difference when the time-dependent strain rate is zero, as seen in figure 10(c).
For a more quantitative analysis, we decomposed the stress responses into a Fourier series. A similar decomposition was performed by Farutin & Misbah (Reference Farutin and Misbah2012a) to analytically examine the stress over vesicles over all orientations in small amplitude oscillatory shear with a background constant shear rate under the quasi-spherical assumption. This decomposition is commonly applied to large amplitude oscillatory shear (known as LAOS) experiments and is known as Fourier transform (FT) rheology. The FT rheology is commonly performed using oscillatory shear flows on polymeric liquids to probe the shear stress response in the nonlinear regime (Wilhelm Reference Wilhelm2002; Hyun et al. Reference Hyun, Wilhelm, Klein, Cho, Nam, Ahn, Lee, Ewoldt and McKinley2011). The computation is straightforward and relies on taking the FT of the  $N_1$ or
 $N_2$ stress difference,
 \begin{equation} f(k) = \int_{-\infty}^{\infty} {N_{1, 2}(t) \textrm{e}^{{-}2 {\rm \pi}\textrm{i} t k}}\,\textrm{d}t. \end{equation}
In this way, the periodic stress signal is transformed into frequency space. Because the external flow field is sinusoidal, the strain rate ( $\dot {\epsilon }$) and strain (
 $\epsilon$) are proportional to sine and cosine functions. Therefore, the Fourier transformed data provide a description of how the stress depends on different orders of the strain and strain rate. If the stress response was purely of a linear order, the Fourier transformation would show a single peak at the first mode. A nonlinear stress response would have additional peaks at higher modes.
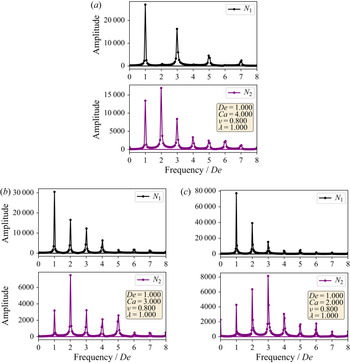
The Fourier decompositions for both  $N_1$ and
 $N_2$ are shown in figure 11, where it is clear that all three regimes show higher-order behaviour. For all regimes, we observe the expected behaviour of the linear-order mode being the highest amplitude with the higher-order modes decreasing monotonically for
 $N_1$. On the other hand, the highest amplitude mode for
 $N_2$ is not the linear-order mode, with the highest generally being the second or third mode. Comparing the
 $N_1$ decompositions between the dynamical regimes, we observe that the symmetrical regime does not have even-order modes, whereas the reorienting and pulsating regimes have even higher-order modes. This change in FT rheology is consistent with the phase boundary defined in § 3.1, and this transition can be used instead of the deformation parameter analysis to demarcate the phase boundary.
Fourier decompositions of the stress responses for indicative parameter sets in each of the dynamical regimes. The panels are (a) symmetrical regime; (b) reorienting regime; (c) pulsating regime.

In large amplitude oscillatory shear, the typical macroscopic stress response shows that the stress is an odd function of the direction of shearing (Hyun et al. Reference Hyun, Wilhelm, Klein, Cho, Nam, Ahn, Lee, Ewoldt and McKinley2011). Such a restriction is not necessarily expected in an extensional flow, but would be related to whether the microstructure of the fluid stretches symmetrically during these flows. In the symmetrical regime, both the vesicle stress response and deformation are time symmetric, leading to only odd-order Fourier modes. The time symmetry does not hold for the reorienting or pulsating regimes, allowing for even-order modes. Based on the currently available results, we do not expect droplets to have even-order Fourier modes in LAOE, regardless of flow rate or flow frequency (Li & Sarkar Reference Li and Sarkar2005b). Broadly speaking, our results show that membrane-bound vesicles are an interesting example of how anisotropic microstructural deformations can lead to complex rheology.
3.6. Transient dynamics of tubular vesicles in large amplitude oscillatory extension
We also investigated the transient dynamics of tubular vesicles in large-amplitude oscillatory extensions (figure 12). In general, we find that tubular vesicles undergo wrinkling/buckling instabilities during the compression phase of the flow cycle similar to quasi-spherical vesicles. However, we occasionally observe buckling instabilities that induce unexpected shape changes. In these situations, the vesicle's initial, tubular shape is not recovered at the end of the flow cycle.
Dynamics of a tubular vesicle with reduced volume  $\nu = 0.64 \pm 0.02$ in LAOE. (a) Snapshots showing pulsating dynamics of a vesicle over one sinusoidal strain rate input cycle with time period
 $T= 4$ s at
 $Ca=21.3$ and
 $De=17.7$. (b) Snapshots showing pulsating dynamics with wrinkles of a vesicle over one sinusoidal strain rate input cycle with time period
 $T= 8$ s at
 $Ca=21.3$ and
 $De=8.9$. (c) Snapshots showing change in the 2-D shape of a vesicle over one flow cycle with time period
 $T= 15$ s at
 $Ca=21.3$ and
 $De=4.7$. Scale bar is 20
 $\mathrm {\mu }$m. False colouring is applied to the greyscale images for resolution enhancement.

Figure 12(a) shows experimental snapshots of a tubular vesicle with reduced volume  $\nu =0.64\pm 0.02$ exposed to a sinusoidal strain rate at
 ${Ca} = 21.3$ and
 ${De} = 17.7$. In this situation, the vesicle exhibits pulsating motion along the
 $x$-axis with buckles during the compressional part of the flow cycle. The vesicle's starting, tubular shape is recovered at the end of the LAOE cycle. To further demonstrate this behaviour, we construct single vesicle Lissajous curves (figure 13d) defined as plots of the deformation parameter as a function of
 ${Ca}$, and the deformation parameter as a function of time (figure 13a). These plots show the vesicle reaches the same value of deformation parameter
 $D \approx 0.7$ at the end of each of the three repeated flow cycles, implying that the vesicle conformation is fully recovered after deformation. There is decent agreement in the qualitative dynamics between the simulations and experiments in this region, but the simulated deformation parameters appear to be lower than the ones measures experimentally.
Experimental and simulation single vesicle Lissajous curves and deformation plots for  $\nu =0.64$. For each panel: (a)
 $Ca = 21.3$,
 $De = 17.7$,
 $\nu$ = 0.64; (b)
 $Ca = 21.3$,
 $De = 8.9$,
 $\nu$ = 0.64; (c)
 $Ca = 21.3$,
 $De = 4.7$,
 $\nu$ = 0.64; (d)
 $Ca = 21.3$,
 $De = 17.7$,
 $\nu$ = 0.64; (e)
 $Ca = 21.3$,
 $De = 8.9$,
 $\nu$ = 0.64; (f)
 $Ca = 21.3$,
 $De = 4.7$,
 $\nu$ = 0.64.

When the same vesicle is exposed to a flow cycle at a lower frequency ( ${De}=8.9$), the membrane has more time to deform in response to the flow. Here, the vesicle undergoes pulsating motion with wrinkles (figure 12b) and we observe appreciable deformation along
 $y$-axis in both the simulations and experiments, as shown in figure 13(b,e). Surprisingly, the experimental results show the vesicle deformation parameter reducing with each subsequent LAOE cycle. The deformation at the end of first cycle is
 $D\approx 0.7$ and it decreases to
 $D\approx 0.6$ at the end of second cycle, and further to
 $D\approx 0.5$ at the end of third cycle. Experimentally, it seems that the vesicle conformation changes over each LAOE cycle while our simulations predict no change over the strain rate cycles. By the end of the third repeated cycle, we experimentally observe that the 2-D shape of vesicle appears to be more spheroidal than tubular. Interestingly, the vesicle did not recover its original tubular shape even when relaxed for
 $\approx$ 2 min. It is noteworthy that we did not observe any reduction in deformation parameter at the higher flow frequency discussed previously (
 $De = 17.7$). These observations suggest that for a given
 ${Ca}$, there appears to be a critical
 ${De}$ below which the change occurs.
Finally, the same vesicle is exposed to a LAOE flow cycle with an even lower frequency ( $De = 4.7$). We observe that the vesicle undergoes full reorientation from the
 $x$-axis to
 $y$-axis, undergoing a wrinkling instability during compression, and the initial spheroidal shape changes to a more spherical shape at the end of the first periodic cycle (figure 12c). The deformation behaviour seen experimentally during the second repeated cycle is symmetric and follows similar dynamics as those observed for quasi-spherical vesicles. This behaviour is more apparent in figure 13(c,f) which shows a slight reduction in deformation at the end of the first cycle. We observe a large difference in deformation between the simulations and experiments at these parameters. Where the simulations predict the vesicle stretching to
 $D \approx 0.63$, the experiments only reach
 $D \approx 0.25$. Additionally, the simulations show that the vesicle does not deform symmetrically at these parameters, reaching
 $D \approx -0.5$ and
 $D \approx 0.6$. The experiments were performed sequentially from the higher to lower
 ${De}$ on the same vesicle in the experiments, and it seems that the gradual change in vesicle deformation is carried over from the previous experiments.
In summary, the experimental data in figures 12 and 13 show that the maximum deformation of tubular vesicles may decrease in repeated LAOE cycles and the initial tubular shape may not be recovered. In contrast, the quasi-spherical vesicles always recover a prolate shape following repeated LAOE deformation cycles. We conjecture that the observation of shape transition from prolate tubular to oblate spheroid during LAOE deformation in figure 12(b,c) can be explained in the context of the area-difference elasticity model (Seifert Reference Seifert1997). Briefly, the negative membrane tension on the vesicle membrane during the compressional phase of LAOE flow leads to a decrease in area per lipid which reduces the preferred monolayer area difference (Avital & Farago Reference Avital and Farago2015; Sakashita et al. Reference Sakashita, Urakami, Ziherl and Imai2012). The decrease in monolayer area difference triggers the shape transition from a prolate tubular shape to an oblate spheroid in accordance with the ADE model (Seifert Reference Seifert1997; Ziherl & Svetina Reference Ziherl and Svetina2005). This hypothesis is consistent with prior observations where the prolate to oblate transition was triggered by chemical modification of the ambient environment of vesicles (Kodama et al. Reference Kodama, Morandi, Ebihara, Jimbo, Toyoda, Sakuma, Imai, Puff and Angelova2018). Resolving what exactly is occurring during compressional flow requires additional experiments, likely with 3-D confocal microscopy to obtain the full 3-D vesicle shape.
Additional experimental data on dynamics of highly deflated vesicles ( $\nu =0.35$) is included in the supplementary material (figures S6 and S7).
In steady extensional flow with  ${De}=0$, the critical capillary number required to trigger dumbbell shape transition is a function of reduced volume and the comprehensive phase diagram in
 ${Ca}$–
 $\nu$ space has been reported in an earlier work (Kumar et al. Reference Kumar, Richter and Schroeder2020a). The dumbbell-like shape has also been observed in simulations of a reduced volume
 $\nu =0.60$ vesicle in a steady shear flow (Farutin & Misbah Reference Farutin and Misbah2012b). Figure 14 qualitatively demonstrates how oscillatory extensional flow alters these shape instabilities. At
 ${De}=1.2$, we observe that the critical capillary number
 ${Ca}$ required to induce an asymmetric dumbbell is much higher compared with steady extensional flow at
 ${De}=0$. For instance, the critical
 ${Ca}$ required to generate an asymmetric dumbbell in steady extension for
 $\nu =0.69$ is
 $\approx 5.3$ (Kumar et al. Reference Kumar, Richter and Schroeder2020a). However, in LAOE flow at
 ${De}=1.2$, the transition to a dumbbell shape occurs at
 ${Ca}=52.5$ which is approximately 10 times higher than the critical
 ${Ca}$ for steady flow. This observation can be rationalized by considering the competition between flow cycle time
 $T$ and the inverse of the predicted growth rate of asymmetric instability from linear stability analysis (Narsimhan et al. Reference Narsimhan, Spann and Shaqfeh2015). Briefly, the presence of flow oscillations (
 ${De} > 0$) prevents any instability formation which requires a time scale larger than cycle time
 $T$. Thus, a large
 ${Ca}$ is needed to reduce the time scale of instability sufficiently to observe the dumbbell formation within the flow cycle time
 $T$. While it is possible to explore the phase diagram describing conformation change to asymmetric/symmetric dumbbell on
 ${Ca}$–
 ${De}$ space for the entire range of reduced volumes using the Stokes trap, the parameter space is vast and it remains a ripe area for future numerical simulations.
Asymmetric dumbbell formation in a vesicle with reduced volume  $\nu =0.69$ exposed to LAOE flow at
 ${Ca}=52.5$ and
 ${De}=1.2$. Scale bar is 10
 $\mathrm {\mu }$m.

4. Conclusions
In this work, we examined the dynamics of vesicles in LAOE flow using both experiments and numerical simulations. The experiments were carried out using the Stokes trap experimental technique while the simulations were done with the boundary element method. For quasi-spherical vesicles, the simulations are found to capture the transient wrinkling dynamics as well as the overall vesicle shapes from experiments. We have identified three dynamical regimes based on their deformation characteristics and named them the symmetrical, reorienting and pulsating regimes. Based on these results, we generated a phase diagram in capillary number and Deborah number space for the dynamical regimes; our data suggest that the phase boundaries are linear. The unique deformation observed in the pulsating and reorienting regimes also has interesting effects on the stress response in that the time symmetry of the stress does not hold. Additional analysis of the stress response and confirmation by experimental studies is required for a better idea of the dynamics. Finally, we presented results on highly deflated tubular vesicles which shows that lower reduced volume vesicles tend to undergo a shape change following repeated LAOE deformation. From a broad perspective, we have shown through experiments and simulations that the vesicle system shows interesting dynamics in extensional oscillatory flows. We have also shown how microstructural changes from extensional and compression of a cell-like suspension can affect the overall rheology. Similar dynamics might be observed in other cell-like systems such as red blood cells or single-celled organisms, prompting additional study into time dependent flows for these systems.
Supplementary material and movies
Supplementary material and movies are available at https://doi.org/10.1017/jfm.2021.885.
Funding
This work was funded by the National Science Foundation (NSF) through grant CBET PMP 1704668 for C.M.S. and by a PPG-MRL Graduate Research Fellowship from the Illinois Materials Research Lab and A.T. Widiger Fellowship for D.K.
Declaration of interest
The authors declare no conflict of interest.
Author contributions
C. Lin and D. Kumar contributed equally to this work.