





1 Introduction
Laser wakefield accelerators (LWFAs)[
Reference Tajima and Dawson
1
] provide accelerating fields for charged particles that are orders of magnitude higher than those in conventional radio-frequency (RF) accelerators, enabling electrons to attain giga-electronvolt energies within centimeter-scale distances[
Reference Gonsalves, Nakamura, Daniels, Benedetti, Pieronek, de Raadt, Steinke, Bin, Bulanov, van Tilborg, Geddes, Schroeder, Tóth, Esarey, Swanson, Fan-Chiang, Bagdasarov, Bobrova, Gasilov, Korn, Sasorov and Leemans
2
,
Reference Miao, Shrock, Feder, Hollinger, Morrison, Nedbailo, Picksley, Song, Wang, Rocca and Milchberg
3
]. This capability makes LWFAs a promising alternative for next generation particle colliders and compact radiation sources[
Reference Foster, D'Arcy and Lindstrøm
4
,
Reference Mix, Maslow, Jaworski and Coleman
5
]. Over the past decades, significant progress has been achieved in improving electron beam quality[
Reference Maier, Delbos, Eichner, Hübner, Jalas, Jeppe, Jolly, Kirchen, Leroux, Messner, Schnepp, Trunk, Walker, Werle and Winkler
6
,
Reference Wang, Zeng, Li, Wang, Lu and Gao
7
]. Through techniques such as controlled injection and plasma shaping, for instance, stable beams with charges of approximately
$10\;\mathrm{pC}$
 and energy spread at a few per-mille level have been demonstrated[
Reference Ke, Feng, Wang, Qin, Yu, Wu, Chen, Qi, Zhang, Xu, Yang, Leng, Liu, Li and Xu
8
]. However, the underlying physical mechanisms that enable such narrow energy spreads often inherently limit the energy transfer efficiency. In LWFAs, the energy transfer efficiency from the laser pulse to the high-quality electron beam typically lies between 0.1% and 1%[
Reference Gonsalves, Nakamura, Daniels, Benedetti, Pieronek, de Raadt, Steinke, Bin, Bulanov, van Tilborg, Geddes, Schroeder, Tóth, Esarey, Swanson, Fan-Chiang, Bagdasarov, Bobrova, Gasilov, Korn, Sasorov and Leemans
2
,
Reference Leemans, Nagler, Gonsalves, Toth, Nakamura, Geddes, Esarey, Schroeder and Hooker
9
–
Reference Götzfried, Döpp, Gilljohann, Foerster, Ding, Schindler, Schilling, Buck, Veisz and Karsch
11
]. This limitation arises from several physical constraints. The dependence of the wakefield structure on the laser energy implies that, even if the laser energy is depleted only by half, the laser might not be able to drive the wakefield to accelerate electrons[
Reference Decker, Mori, Tzeng and Katsouleas
12
], preventing the electrons from being stably accelerated. The fact that the laser group velocity is lower than the speed of the electron beams causes the particles to outrun the accelerating phase, thus limiting the beam energy[
Reference Lu, Tzoufras, Joshi, Tsung, Mori, Vieira, Fonseca and Silva
13
,
Reference Palastro, Shaw, Franke, Ramsey, Simpson and Froula
14
]. Moreover, beam-loading effects can significantly reduce the accelerating gradient, particularly when accelerating high-charge beams[
Reference Tzoufras, Lu, Tsung, Huang, Mori, Katsouleas, Vieira, Fonseca and Silva
15
]. Although the beam-loading effect reduces the accelerating gradient, it plays an important role in reducing the energy spread of high-charge beams[
Reference Rechatin, Davoine, Lifschitz, Ismail, Lim, Lefebvre, Faure and Malka
16
].
Recent efforts have sought to overcome these limitations. A scheme combining a tri-plateau plasma channel[
Reference Luther, Wang, Marconi, Chilla, Larotonda and Rocca
17
,
Reference Arjmand, Catalano, Oliva, Amato, Manna, Pappalardo, Suarez and Cirrone
18
] with a nonlinearly chirped laser was proposed to mitigate the laser distortion and beam dephasing, thereby enhancing transfer efficiency while using controlled dynamic beam-loading to reduce correlated energy spread[
Reference Liu, Li, Zhou, Hua, Mori, Joshi and Lu
19
]. The high energy transfer efficiencies have also been reported in the plasma telescope configuration[
Reference Zeng, de la Ossa, Poder and Osterhoff
20
,
Reference Zeng
21
] and the wakefield driven by a
${\mathrm{CO}}_2$
 laser[
Reference Brunetti, Campbell, Lovell and Jaroszynski
22
]. The high efficiency LWFA has also been investigated in the pump-depletion dominated bubble regime[
Reference Horný, Bleotu, Ursescu, Malka and Tomassini
23
,
Reference Streeter, Ma, Kettle, Dann, Mayr, Albert, Bourgeois, Cipiccia, Cole, González, Hussein, Jaroszynski, Falk, Krushelnick, Lemos, Lopes, Lumsdon, Lundh, Mangles, Najmudin, Rajeev, Sandberg, Shahzad, Smid, Spesyvtsev, Symes, Vieux and Thomas
24
] and in subcritical density plasma[
Reference Ablimit, Han, Zhao, OuYang, Wen and Yu
25
]. Despite these advances, achieving simultaneous improvements in both beam quality and energy transfer efficiency with a simple and controllable setup remains a critical challenge, especially for applications such as particle colliders and X-ray free-electron lasers, which demand high charge and high beam quality.
In this paper, we propose and demonstrate an LWFA scheme that mitigates this challenge. Our approach uniquely leverages the laser defocusing injection mechanism[
Reference Wang, Zeng, Li, Wang and Gao
26
] to enable efficient acceleration using an ultrashort (
${\sim} 10\;\mathrm{fs}$
 ) drive laser. Within this injection scheme, the reduced pulse duration is naturally combined with a smaller focal spot, sustaining a high laser amplitude and a corresponding
$\mathrm{TV}/\mathrm{m}$
 -scale wakefield[
Reference Esarey, Schroeder and Leemans
27
] at multi-terawatt power levels. This strong wakefield suppresses beam loading for
$\mathrm{nC}$
 -scale charges, while the controlled pump depletion of the short driver induces a two-step dechirping dynamics that reduces correlated energy spread before the substantial beam dephasing occurs[
Reference Wang, Zeng, Li, Wang, Lu and Gao
7
]. The optimal operating regime, with laser pulse duration as an essential control parameter, is efficiently identified through multi-objective Bayesian optimization (MOBO). We demonstrate, through particle-in-cell (PIC) simulations, the simultaneous generation of high-charge (
${\sim} \mathrm{nC}$
 ) electron beams with approximately
$20\%$
 energy transfer efficiency and narrow energy spread, representing a significant step toward practical, high-performance plasma accelerators.
2 Fundamental theory
In the injection mechanism facilitated by laser defocusing, the injection process itself imposes certain requirements on both the laser waist and the laser amplitude. Current theories[ Reference Esarey, Schroeder and Leemans 27 , Reference Matsuoka, McGuffey, Cummings, Horovitz, lar, Chvykov, Kalintchenko, Rousseau, Yanovsky, Bulanov, Thomas, Maksimchuk and Krushelnick 28 ] are not yet able to fully describe the relationship between the bubble length and the laser parameters, including the pulse duration, laser radius and intensity. However, it is clear that after the laser passes through its focal point, the attenuation of the laser intensity and the increase in the laser radius lengthen the nonlinear plasma wave[ Reference Wang, Zeng, Li, Wang and Gao 26 , Reference Ding, Döpp, Gilljohann, Götzfried, Schindler, Wildgruber, Cheung, Hooker and Karsch 29 ]. This can explain the reduction in the phase velocity and the resulting injection dynamics.
Here, we perform one quasi-three-dimensional (3D) PIC simulation using the FBPIC code[
Reference Lehe, Kirchen, Andriyash, Godfrey and Vay
30
] with the Pseudo-Spectral Analytical Time Domain solver to show the laser defocusing injection, as depicted in Figure 1. The fully ionized plasma, with a plateau density of
${n}_\mathrm{p}=6\times {10}^{18}\ {\mathrm{cm}}^{-3}$
 , features an upramp defined by
$n={n}_\mathrm{p}\exp \left(-{z}^2/{\sigma}_z^2\right)$
 spanning from
$z=-500\;\mu \mathrm{m}$
 to
$z=0$
 , where
${\sigma}_z=200\;\mu \mathrm{m}$
 . The laser polarized in the
$y$
 direction has the strength parameter of
${a}_0=15$
 , the laser waist of
${w}_0=6\;\mu \mathrm{m}$
 , the wavelength of
$\lambda =800\;\mathrm{nm}$
 and the focusing position of
${z}_\mathrm{f}=0$
 . The laser strength parameter
${a}_0$
 is the peak amplitude of the normalized vector potential of the laser field
${a}=e{A}/{m}_\mathrm{e}{c}^2$
 , with
${A}$
 being the amplitude of the vector potential. In addition,
$e$
 is the elementary charge,
${m}_\mathrm{e}$
 is the electron mass,
$c$
 is the speed of light in vacuum and
${w}_0$
 is the laser waist at the focal point in vacuum, defined as the radius at which the laser intensity drops to
$1/{\mathrm{e}}^2$
 of its peak value. The full width at half maximum (FWHM) pulse duration
${\tau}_{\mathrm{FWHM}}$
 in this case is
$20\;\mathrm{fs}$
 , where
${\tau}_{\mathrm{FWHM}}$
 is the FWHM duration of the laser intensity. The simulations have the box size of
$\left(100\;\mu \mathrm{m},65\;\mu \mathrm{m}\right)$
 and grid numbers of
$\left(256,2048\right)$
 in the
$r$
 and
$z$
 directions, respectively. The number of particles per cell along the
$\left(z,r,\theta \right)$
 directions is
$\left(\mathrm{2,2,4}\right)$
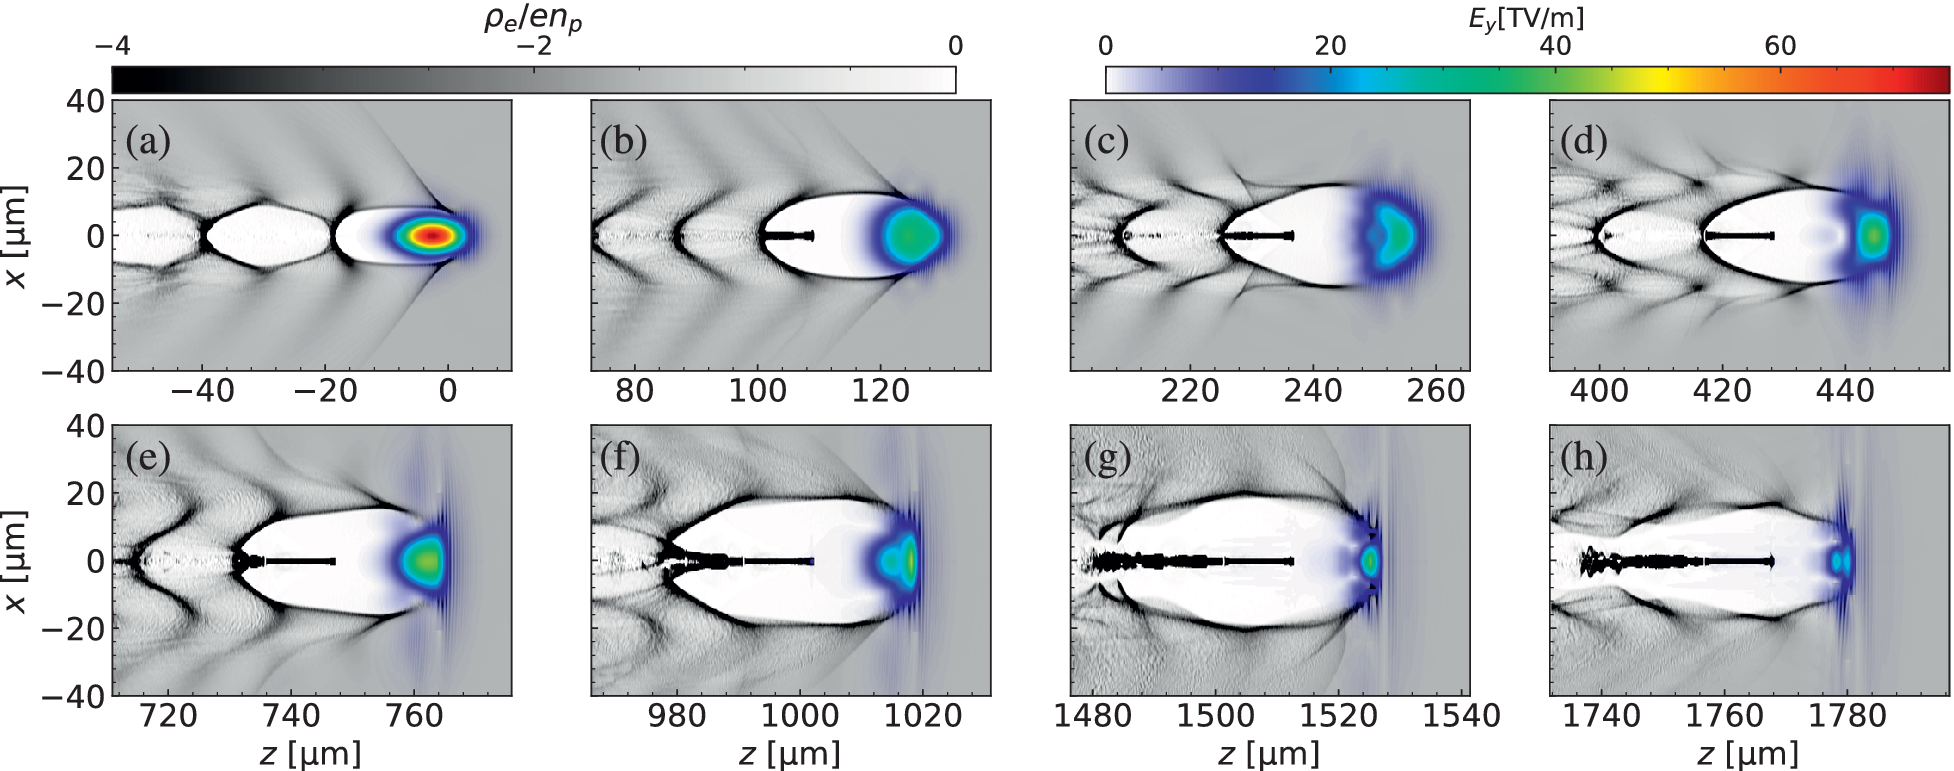
 , respectively. Two azimuthal modes are used. To reduce computational costs, ion motion is neglected in the simulations, and the reflective boundary condition is employed in the transverse direction. The snapshots in Figure 1 illustrate the evolution of the bubble and the electron injection process. The injection can be divided into two stages, corresponding to two distinct injection mechanisms. The first injection arises from the defocusing of the laser pulse (Figures 1(a)–1(d)), while the second injection originates from the carrier carrier-envelope phase (CEP) effect arising from sufficient pulse-front erosion[
Reference Zeng
21
,
Reference Li, Li, Huang, Tao, Li, Zhao, Ma, Guo, Wang, Chen, Hafz, Zhang and Chen
31
–
Reference Yan, Chen, Li, Zhang, Hafz, Dunn, Ma, Huang, Su, Chen, Sheng and Zhang
35
].
The snapshots of the plasma wakefield driven by a tightly focused laser pulse. (a)–(d) show the electron injection process driven by laser defocusing, where the bubble elongates and contracts due to the increasing laser radius after the focal point. (e)–(h) show the secondary injection process driven by pulse-front erosion, where the leading edge of the laser pulse becomes significantly eroded. The plasma has an unperturbed density of
${n}_\mathrm{p}=6\times {10}^{18}\ {\mathrm{cm}}^{-3}$
 and the laser has
${a}_0=15$
 ,
${w}_0=6\;\mu \mathrm{m}$
 and
${\tau}_{\mathrm{FWHM}}=20\;\mathrm{fs}$
 . Here,
${\rho}_\mathrm{e}$
 is the charge density of the plasma electrons and
${E}_y$
 is the envelope of the laser electric field.

Figure 1 Long description
A multi-panel plot consisting of eight panels labeled a through h. The vertical y-axis for all panels is x in micrometers, ranging from negative 40 to 40. The horizontal x-axis is z in micrometers, with varying ranges across panels to show the progression of the pulse.
Two color scales are provided at the top. The left scale for rho sub e all over e n sub p ranges from negative 4 to 0 in grayscale. The right scale for E sub y in T V per m ranges from 0 to 60 using a rainbow spectrum from blue to red.
* Panel a: z from negative 50 to 10. Shows a concentrated rainbow-colored pulse at the front of a white bubble-like wakefield.
* Panel b: z from 70 to 130. The wakefield bubble elongates, and a dark horizontal filament begins to form at the center.
* Panel c: z from 210 to 270. The rainbow pulse at the front shifts toward blue-green, and the central filament becomes more distinct.
* Panel d: z from 390 to 450. The wakefield structure shows increased turbulence in the trailing regions.
* Panel e: z from 710 to 770. The central filament extends further back into the bubble.
* Panel f: z from 970 to 1030. The front pulse narrows, and the wakefield walls show fine-scale oscillations.
* Panel g: z from 1480 to 1540. The central filament thickens and shows internal structure, while the front pulse becomes more compact.
* Panel h: z from 1730 to 1790. The final snapshot shows a highly elongated wakefield with a dense, structured central filament and a small, intense blue-green pulse at the leading edge.
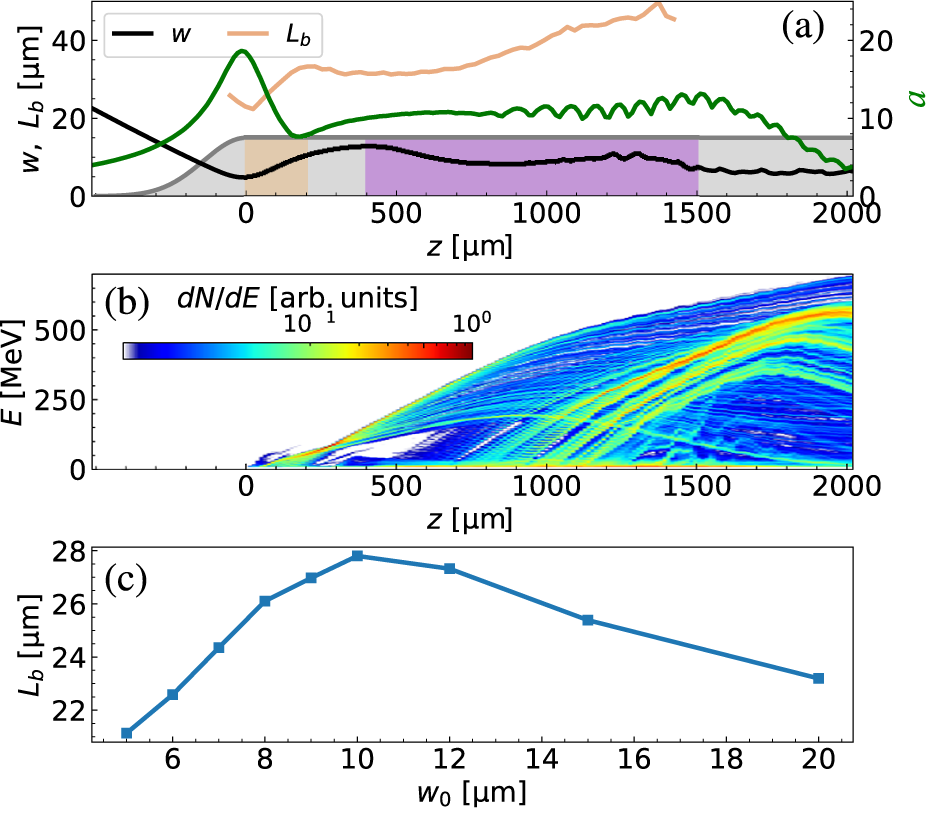
Figure 2 shows the evolution of the laser radius
$w$
 , laser intensity
$a$
 and bubble length
${L}_\mathrm{b}$
 . It can be seen that after the laser pulse passes through the focal point
${z}_\mathrm{f}$
 , the laser radius
$w$
 gradually increases and
$a$
 decreases due to laser diffraction. This effectively promotes the longitudinal expansion of the bubble and reduces the phase velocity of the wakefield, leading to the rapid injection of an electron bunch. The transverse size of the bubble increases after the onset of injection, reaches a peak and subsequently decreases. This transverse contraction of the bubble causes the longitudinal size to shrink (see the orange curve in Figure 2(a)), thereby terminating the injection. The electron injection is confined to a narrow region between
$z=0$
 and
$z\sim 200\;\mu \mathrm{m}$
 , as indicated by the orange shaded area in Figure 2. After the laser defocusing injection ceased, the laser pulse continued to interact with the plasma. As this interaction proceeds, its pulse-front erosion effect became increasingly pronounced, inducing a fresh injection of electrons. This injection process lasted for approximately
$1\;\mathrm{mm}$
 , shown in the violet shaded area in Figure 2(a), and injected several
$\mathrm{nC}$
 of charge. Subsequently, as the laser pulse undergoes energy depletion, the bubble contracts. Meanwhile, the self-generated wakefield of the beam prevents the bubble from closing, thereby inhibiting further injection of background electrons (Figures 1(g) and 1(h)). To clarify the essence of the first injection process, a series of simulations with constant
${a}_0{w}_0=15\times 6\;\mu \mathrm{m}$
 are conducted to investigate the relationship of the bubble length
${L}_\mathrm{b}$
 with the laser waist
${w}_0$
 at the position before injection, that is,
$z={z}_\mathrm{f}$
 . Note that a constant
${a}_0{w}_0$
 corresponds to a fixed laser power. As shown in Figure 2(c), this result confirms that the bubble elongation and contraction is caused by the laser defocusing, which promotes the reduction of the wakefield phase velocity, the injection of electrons and the subsequent termination of the injection. It should be noted that injection due to pulse-front erosion (in the violet region) has been discussed in another work[
Reference Zeng
21
,
Reference Li, Li, Huang, Tao, Li, Zhao, Ma, Guo, Wang, Chen, Hafz, Zhang and Chen
31
–
Reference Yan, Chen, Li, Zhang, Hafz, Dunn, Ma, Huang, Su, Chen, Sheng and Zhang
35
], and is not considered in this work.
The evolution of the laser radius
$w$
 , laser strength
$a$
 and bubble length
${L}_\mathrm{b}$
 (a) and the energy spectrum of the trapped electrons (b) with the laser position
$z$
 . In (a), the gray region represents the density profile of the plasma, the orange region represents the zone dominated by injection driven by laser defocusing and the violet region corresponds to the zone dominated by a regular self-injection. (c) The relationship of the bubble length
${L}_\mathrm{b}$
 with the laser waist radius
${w}_0$
 at the position before injection is from a series of simulations with a constant
${a}_0{w}_0=15\times 6\;\mu \mathrm{m}$
 .

Figure 2 Long description
Panel a is a line graph with a horizontal axis z in micrometers ranging from minus 500 to 2000. The left vertical axis represents w and L sub b in micrometers (0 to 40), and the right vertical axis represents a (0 to 20). A black line w decreases then stabilizes. A green line a peaks near z equals 0 then oscillates. A light orange line L sub b increases steadily. The background features a gray plasma density profile with an orange shaded region from z equals 0 to 200 (defocusing injection) and a violet region from z equals 400 to 1500 (self-injection).
Panel b is a spectrogram showing electron energy E in M e V on the vertical axis (0 to 500) against z (0 to 2000). A color scale for d N forward slash d E in arbitrary units ranges from 10 super minus 1 to 10 super 0. The data shows multiple diagonal streaks of increasing energy as z increases, indicating electron acceleration.
Panel c is a line graph with square markers showing bubble length L sub b in micrometers (22 to 28) on the vertical axis against laser waist radius w sub 0 in micrometers (6 to 20) on the horizontal axis. The curve rises from w sub 0 equals 5 to a peak at w sub 0 equals 10, then decreases linearly toward w sub 0 equals 20.
Previously, we obtained an empirical formula for the charge of the electron bunch injected via the laser defocusing injection, which is as follows[ Reference Wang, Zeng, Li, Wang and Gao 26 ]:

where
$C=1.19\times {10}^{-18}\;\mathrm{nC}\;{\mathrm{cm}}^2$
 is an empirical constant,
${L}_\mathrm{{inj}}$
 is the injection length and
${n}_\mathrm{p}$
 is the plasma density. The injection length is as follows:

where
${k}_\mathrm{p}={\omega}_\mathrm{p}/c$
 and
${\omega}_\mathrm{p}$
 is the plasma frequency. The effective Rayleigh length within the first oscillation period of the laser pulse envelope
${z}_{\mathrm{Re}}=\pi {w}_0^2{\varGamma}^2/\lambda$
 , where
$\varGamma ={w}_{0\mathrm{e}}/{w}_0$
 and
${w}_{0\mathrm{e}}$
 stands for the effective laser waist at the effective focal point for the laser in the plasma[
Reference Wang, Zeng, Li, Wang and Gao
26
], and
$\lambda$
 is the laser wavelength. We postulate the laser at the ending time of electron injection satisfies the matching condition
${k}_\mathrm{p}{w}_\mathrm{m}=2\sqrt{a_\mathrm{m}}$
 [
Reference Lu, Tzoufras, Joshi, Tsung, Mori, Vieira, Fonseca and Silva
13
]. The laser radius is described as
${w}_\mathrm{m}=\exp \left(-1/2\right){\left(2{w}_0^2{a}_0^2/{k}_\mathrm{p}^2\right)}^{1/4}$
 and
${a}_\mathrm{m}$
 represents the matched laser strength for the matched state[
Reference Wang, Zeng, Li, Wang and Gao
26
]. In addition, we assume the laser depletion length
${L}_\mathrm{{etch}}={\omega}^2/{\omega}_\mathrm{p}^2c{\tau}_{\mathrm{FWHM}}$
 is related to the dephasing length
${L}_\mathrm{d}=2/3{\omega}^2/{\omega}_\mathrm{p}^2{w}_\mathrm{m}$
 by
${L}_\mathrm{{etch}}=\alpha {L}_\mathrm{d}$
 , where
$\omega$
 is the laser frequency. Here,
$\alpha =3c{\tau}_{\mathrm{FWHM}}/2{w}_\mathrm{m}$
 is a dimensionless coefficient.
By substituting the laser envelope
$a={a}_0\exp \left(-{t}^2/{\tau}^2\right)$
 into the one-dimensional (1D) nonlinear wakefield equation[
Reference Esarey, Schroeder and Leemans
27
], we can obtain the normalized wakefield amplitude
${E}_\mathrm{p}$
 . For the case where
$0<\alpha \le 1$
 , the maximum energy gain can be expressed as follows:

Subsequently the energy transfer efficiency for the electron beam with charge
$Q$
 and energy
$\overline{E}$
 is given by the following:

where
${E}_\mathrm{L}$
 is the laser energy and
$\eta$
 is approximately related to
${\eta}_{\mathrm{FWHM}}$
 as
$\eta \sim 1.27\times {\eta}_{\mathrm{FWHM}}$
 , where
${\eta}_{\mathrm{FWHM}}$
 corresponds to the energy transfer efficiency from the laser to the electrons with the charge of
${Q}_{\mathrm{FWHM}}$
 in the FWHM range of the energy spectrum and
$Q\sim 1.27\times {Q}_{\mathrm{FWHM}}$
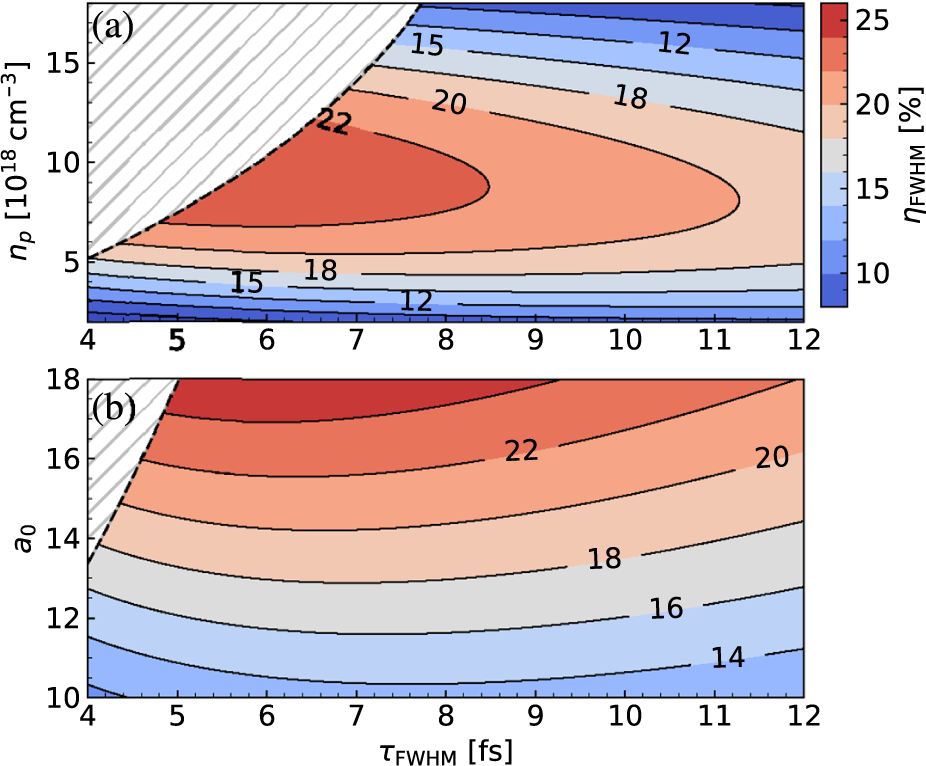
 . We show the theoretical energy transfer efficiency according to this model in Figure 3. For the laser and plasma parameters of
${a}_0=15$
 ,
${w}_0=6\;\mu \mathrm{m}$
 and
${n}_\mathrm{p}=6\times {10}^{18}\ {\mathrm{cm}}^{-3}$
 , Equation (4) indicates that the energy transfer efficiency attains its maximum value
${\eta}_{\mathrm{FWHM}}\sim 21.5\%$
 at a pulse duration of
${\tau}_{\mathrm{FWHM}}\sim 6.3\;\mathrm{fs}$
 . This model predicts that if the pulse duration of the laser pulse can be compressed from
$30\;\mathrm{fs}$
 to around
$10\;\mathrm{fs}$
 , it will be beneficial for the energy transfer efficiency of the LWFA. Note that the laser pulse should have sufficient energy to drive the wakefield for removing the chirp of the injected beam, which means that
${L}_\mathrm{{etch}}$
 should be sufficiently larger than
${L}_\mathrm{{inj}}$
 . We assert the criteria to be
${L}_\mathrm{{etch}}>2{L}_\mathrm{{inj}}$
 , or

The distribution of the energy transfer efficiency according to the model, (a) with plasma density
${n}_\mathrm{p}$
 and laser pulse duration
${\tau}_{\mathrm{FWHM}}$
 , while
${w}_0=6\;\mu \mathrm{m}$
 and
${a}_0=15$
 , (b) with laser strength parameter
${a}_0$
 and laser pulse duration
${\tau}_{\mathrm{FWHM}}$
 , while
${w}_0=6\;\mu \mathrm{m}$
 and
${n}_\mathrm{p}=6\times {10}^{18}\;{\mathrm{cm}}^{-3}$
 . The practical parameters should be on the right-hand side of the dashed lines
${\tau}_{\mathrm{FWHM}}=2{L}_\mathrm{{inj}}{w}_\mathrm{p}^2/{cw}^2$
 , so that the laser pump-depletion length is sufficient for the acceleration.

Figure 3 Long description
A two-panel contour plot with a shared horizontal x-axis representing tau sub F W H M in femtoseconds, ranging from 4 to 12. A vertical color bar on the right indicates efficiency eta sub F W H M in percent, ranging from 10 in dark blue to 25 in dark red.
Panel a: The vertical y-axis is plasma density n sub p in units of 10 super 18 inverse cubic centimeters, ranging from 5 to 15. A dashed line separates a hatched white region in the top-left from the colored data. The efficiency peaks in a central red region labeled 22, located between n sub p values of 8 and 12 and tau sub F W H M values of 6 to 10. Efficiency decreases toward the top and bottom edges, with contours labeled 20, 18, 15, and 12.
Panel b: The vertical y-axis is the laser strength parameter a sub 0, ranging from 10 to 18. A small hatched region exists in the top-left corner. The efficiency increases as a sub 0 increases, with the highest values above 22 percent shown in red at the top of the plot. Contours are labeled 14, 16, 18, 20, and 22, showing a positive correlation between laser strength and efficiency across the pulse duration range.
Thus, the practical parameters should be on the right-hand side of the curve
${\tau}_{\mathrm{FWHM}}=2{L}_\mathrm{{inj}}{\omega}_\mathrm{p}^2/c{\omega}^2$
 in Figure 3.
3 Effect of pulse duration on beam quality
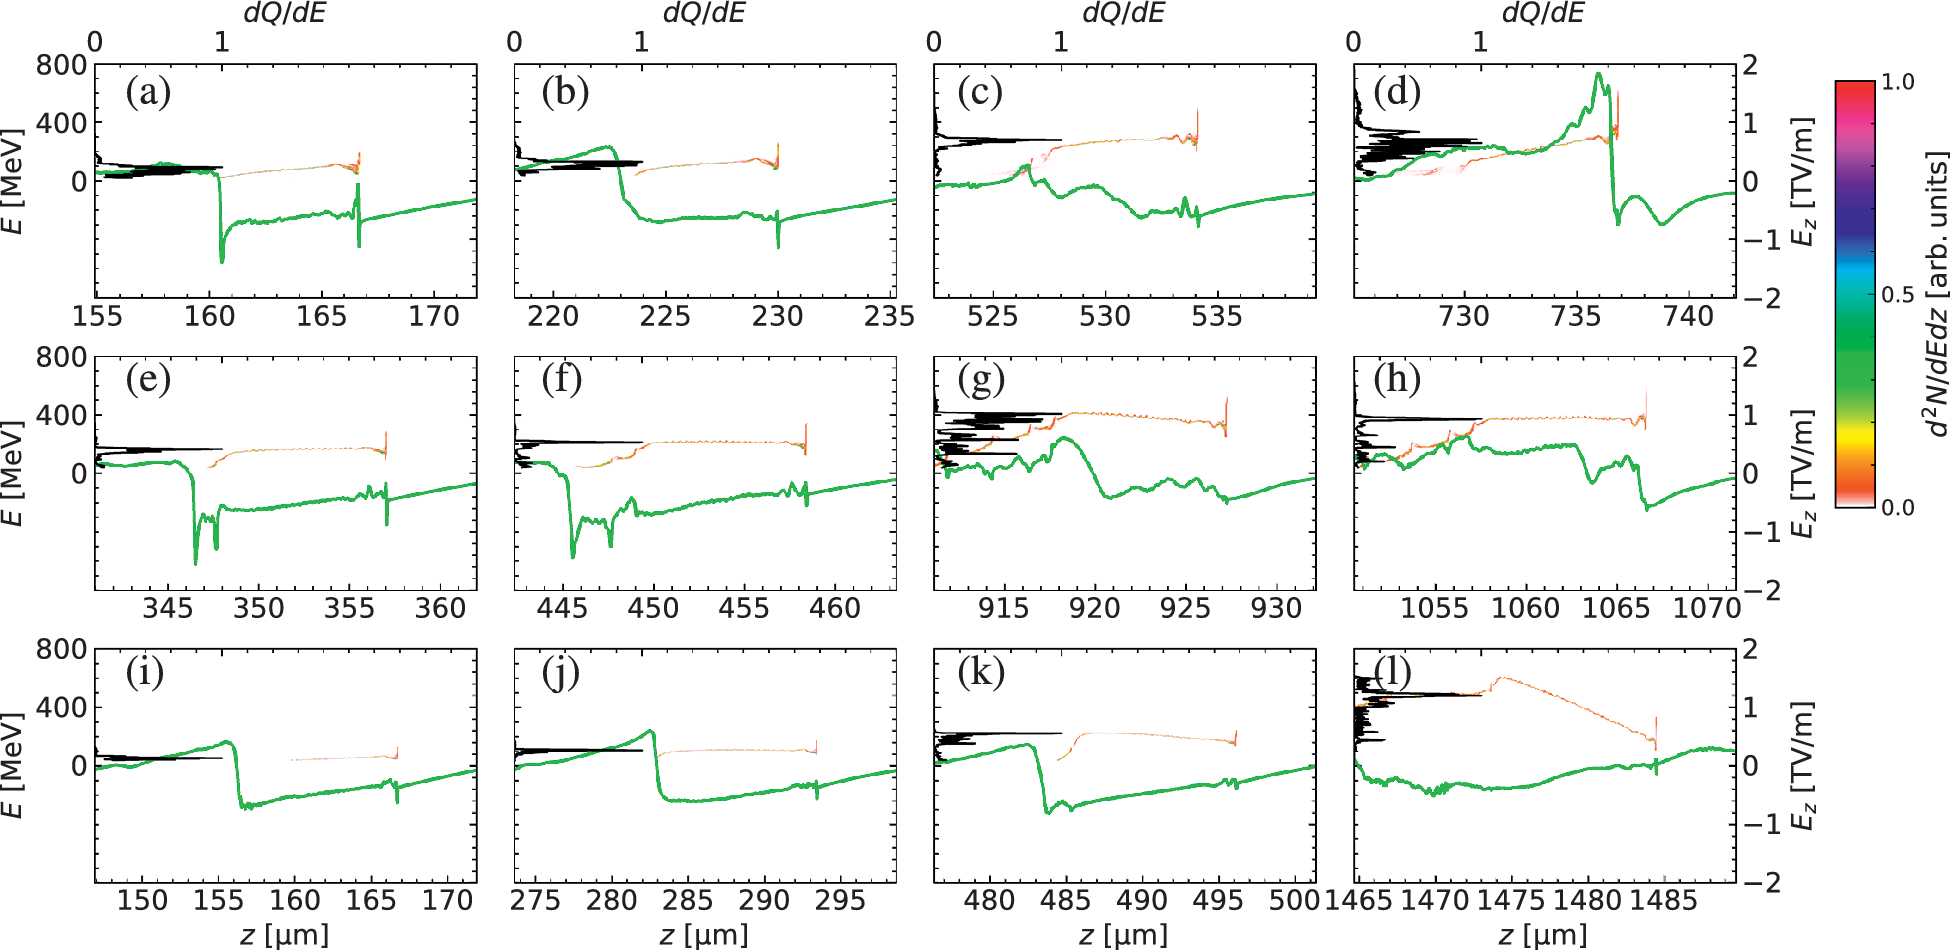
Here, we perform three additional PIC simulations to show the impact of the laser pulse duration on the beam quality and examine the model above, as depicted in Figure 4. In the plots, the black curves represent the energy spectrum of the electron beams
$\mathrm{d}Q/ \mathrm{d}E$
 , and the green curves represent longitudinal electric field
${E}_z$
 . The FWHM pulse durations
${\tau}_{\mathrm{FWHM}}$
 in the three cases are 5, 8 and
$15\;\mathrm{fs}$
 , respectively. The other laser and plasma parameters are the same as the case in Figure 1. For the case of
${\tau}_{\mathrm{FWHM}}=5\;\mathrm{fs}$
 , the laser pump-depletion length is too short, such that there is not enough length to remove the negative energy chirp of the electron beam. At
$z\sim 530\;\mu \mathrm{m}$
 as shown in Figure 4(c), the beam has charge of
${Q}_{\mathrm{FWHM}}\sim 0.76\;\mathrm{nC}$
 , the average energy of approximately
$280\;\mathrm{MeV}$
 , the FWHM energy spread of approximately
$6.2\%$
 and the energy transfer efficiency of
${\eta}_{\mathrm{FWHM}}\sim 15\%$
 , within
$\mathrm{FWHM}$
 range of the energy spectrum. For the case of
${\tau}_{\mathrm{FWHM}}=8\;\mathrm{fs}$
 , the chirp of the electron beam is removed twice at
$z\sim 450\;\mu \mathrm{m}$
 and
$z\sim 1060\;\mu \mathrm{m}$
 as shown in Figures 4(f) and 4(h), respectively. At
$z\sim 1060\;\mu \mathrm{m}$
 , the beam obtains the maximum energy of
$\overline{E}\sim 372\;\mathrm{MeV}$
 , and has the charge of
${Q}_{\mathrm{FWHM}}\sim 1.27\;\mathrm{nC}$
 , the energy spread of
$\Delta {E}_{\mathrm{FWHM}}/\overline{E}\sim 3.28\%$
 and the energy transfer efficiency of
${\eta}_{\mathrm{FWHM}}\sim 20\%$
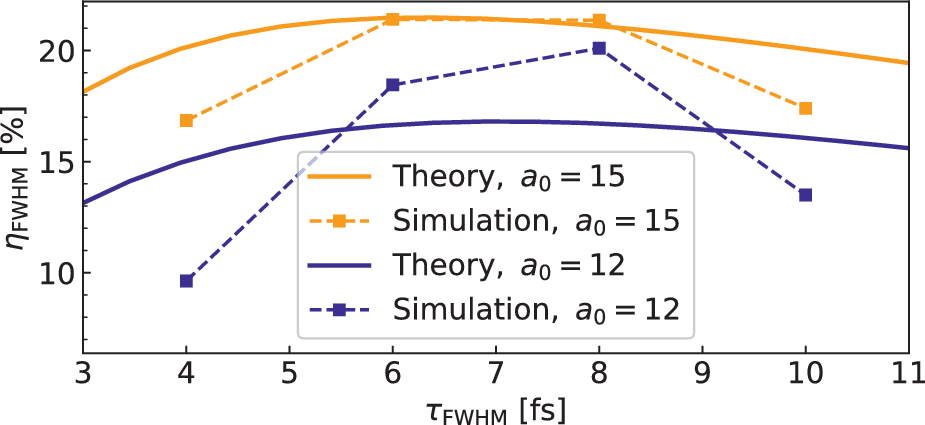
 . Note that our model, that is, Equations (1), (3) and (4), predicts the beam parameters to be
$\overline{E}=360\;\mathrm{MeV}$
 ,
${Q}_{\mathrm{FWHM}}=1.34\;\mathrm{nC}$
 and
${\eta}_{\mathrm{FWHM}}=21.1\%$
 , which are in good agreement with the simulation result as shown in Figure 5. For this moderate laser pump-depletion length, as the laser energy is gradually consumed in the plasma, the bubble shrinks and the beam-loading effect becomes more pronounced[
Reference Tzoufras, Lu, Tsung, Huang, Mori, Katsouleas, Vieira, Fonseca and Silva
15
]. Consequently, the electric field
${E}_z$
 felt by the electron beam changes from having a positive longitudinal derivative (
${\mathrm{d}E}_z/ \mathrm{d}z>0$
 ) to a negative one (
${\mathrm{d}E}_z/ \mathrm{d}z<0$
 ). This in turn causes the longitudinal phase space (LPS) to rotate reversely, canceling the beam positive chirp. This two-step dechirping phenomenon caused by the laser depletion can also be observed in other injection schemes[
Reference Wang, Zeng, Li, Wang, Lu and Gao
7
]. For the case of
${\tau}_{\mathrm{FWHM}}=15\;\mathrm{fs}$
 , the initial negative energy chirp of the beam is removed at
$z\sim 290\;\mu \mathrm{m}$
 (Figure 4(j)) where the beams have the charge of
${Q}_{\mathrm{FWHM}}\sim 0.84\;\mathrm{nC}$
 , the energy of approximately
$109\;\mathrm{MeV}$
 , the FWHM energy spread of approximately
$5.06\%$
 and the energy transfer efficiency of
${\eta}_{\mathrm{FWHM}}\sim 2.1\%$
 . However, the reversal of the phase rotation does not take place in this case, because the laser is still strong enough to drive a nonlinear wakefield with
${\mathrm{d}E}_z/ \mathrm{d}z>0$
 even though the dephasing occurs, as the pump-depletion length is long in this case. Thus, the second removing of the energy chirp does not take place, and the beam quality is not as good as in the
${\tau}_{\mathrm{FWHM}}=8\;\mathrm{fs}$
 case. Here, we respectively refer to the dechirping mechanisms corresponding to long, moderate and short laser pump-depletion lengths (pulse duration) as the long-depletion regime, moderate-depletion regime and short-depletion regime.
The phase-space distributions and the spectra
$\mathrm{d}Q/ \mathrm{d}E$
 (black curves) of the electron beam during the acceleration process for different laser duration cases. The distributions of the longitudinal electric field
${E}_z$
 , which are labeled on the right-hand axis, are also shown as the green curves. The laser durations are (a)–(d)
${\tau}_{\mathrm{FWHM}}=5\;\mathrm{fs}$
 , (e)–(h)
${\tau}_{\mathrm{FWHM}}=8\;\mathrm{fs}$
 and (i)–(l)
${\tau}_{\mathrm{FWHM}}=15\;\mathrm{fs}$
 .

Figure 4 Long description
The figure consists of 12 panels arranged in a 3 by 4 grid, labeled (a) through (l).
Row 1 (a to d) represents a laser duration of tau sub F W H M = 5 f s.
Row 2 (e to h) represents a laser duration of tau sub F W H M = 8 f s.
Row 3 (i to l) represents a laser duration of tau sub F W H M = 15 f s.
Each panel shares a common vertical structure:
- The left y-axis measures energy E in M e V from 0 to 800.
- The right y-axis measures the longitudinal electric field E sub z in T V per m from -2 to 2.
- The bottom x-axis measures position z in micrometers, with ranges shifting rightward across each row to show temporal evolution.
- The top x-axis measures the spectrum d Q all over d E from 0 to 1.
Data features in each panel:
- Green curves: Represent the longitudinal electric field E sub z. These show oscillating wave-like patterns with sharp drops and gradual recoveries.
- Black curves: Located on the left side of each panel, these represent the electron beam spectra d Q all over d E, showing peaks at specific energy levels.
- Colored scatter plots: Represent the phase-space distribution of the electron beam, with a color scale on the far right indicating density d super 2 N all over d E d z in arbitrary units from 0 (red) to 1 (pink/white).
Across all rows, as the beam moves to higher z values (from left to right panels), the energy E of the electron bunches increases, and the green E sub z field curves show increasing complexity and amplitude, particularly in the 5 f s and 8 f s cases compared to the 15 f s case.
The comparison of energy transfer efficiency
${\eta}_{\mathrm{FWHM}}$
 between the theory and simulations for different pulse durations
${\tau}_{\mathrm{FWHM}}$
 , while
${w}_0=6\;\mu \mathrm{m}$
 and
${n}_\mathrm{p}=6\times {10}^{18}\;{\mathrm{cm}}^{-3}$
 are fixed.

Figure 5 Long description
The horizontal X axis represents tau sub F W H M in femtoseconds (f s), ranging from 3 to 11. The vertical Y axis represents eta sub F W H M as a percentage, ranging from 8 to 22.
Four data series are plotted:
* Theory, a sub 0 equals 15: An orange solid curve that peaks at approximately 21.5 percent around 6.5 f s and gradually declines.
* Simulation, a sub 0 equals 15: An orange dashed line with square markers. It follows the theoretical curve closely, peaking at 21.5 percent at 6 and 8 f s.
* Theory, a sub 0 equals 12: A dark blue solid curve positioned lower than the orange curves, peaking at approximately 17 percent around 7 f s.
* Simulation, a sub 0 equals 12: A dark blue dashed line with square markers. It shows a sharper peak at 20 percent at 8 f s, deviating more significantly from its theoretical counterpart at the lower and higher ends of the pulse duration scale.
4 Multi-objective Bayesian optimization
In order to optimize the parameters of beam energy spread and energy transfer efficiency that cannot be simultaneously considered in theory, and verify the strong dependence between beam quality and laser pulse duration, MOBO[
Reference Irshad, Karsch and Döpp
36
–
Reference Balandat, Karrer, Jiang, Daulton, Letham, Wilson and Bakshy
38
] is investigated for its ability to quickly evaluate and predict while relying on a very small amount of data by establishing surrogate models. MOBO can balance the objective functions by finding the Pareto front of the system. The cheap and fast Gaussian process (GP) is used as the surrogate model. The parallel Noisy Expected Hypervolume Improvement (qNEHVI)[
Reference Daulton, Balandat and Bakshy
39
] is used as the acquisition function. During the optimization cycles, the plasma density
${n}_\mathrm{p}$
 , laser strength parameter
${a}_0$
 , laser waist
${w}_0$
 and laser pulse duration
${\tau}_{\mathrm{FWHM}}$
 are selected as the optimized input parameters. The plasma density is restricted to the range of
$\left[4\times {10}^{18}\ {\mathrm{cm}}^{-3},8\times {10}^{18}\ {\mathrm{cm}}^{-3}\right]$
 . Considering the currently achievable laser power in experiment and the specific requirement of triggering this injection, the varying range of laser strength
${a}_0$
 is between 8 and 20. In the laser defocusing injection scheme, the laser waist
${w}_0$
 should be under
$10\;\mu \mathrm{m}$
 [
Reference Wang, Zeng, Li, Wang and Gao
26
], because
${w}_0=10\;\mu \mathrm{m}$
 is the transition from the laser defocusing injection to general self-injection. We observed that the beam energy chirp cannot be removed if the laser waist is smaller than
$4\;\mu \mathrm{m}$
 , so the range of laser waist
${w}_0$
 is set to
$\left[4\;\mu \mathrm{m},9\;\mu \mathrm{m}\right]$
 . The range of the laser pulse duration
${\tau}_{\mathrm{FWHM}}$
 is from 5 to
$20\;\mathrm{fs}$
 , so that all three types of dechirping mechanisms are included in the optimization iteration. As the laser pulse interacts with the plasma over a longer distance before reaching its actual focal point, the effective Rayleigh length decreases. This, in turn, reduces the energy to which the beam can be accelerated. Therefore, for all simulations, the laser focus position is fixed at the entrance of the plasma density plateau.
We set four objective parameters for optimization: the charge
${Q}_{\mathrm{FWHM}}$
 , the relative energy spread
$\Delta {E}_{\mathrm{FWHM}}/\overline{E}$
 , the average energy
$\overline{E}$
 and the corresponding energy transfer efficiency
${\eta}_{\mathrm{FWHM}}$
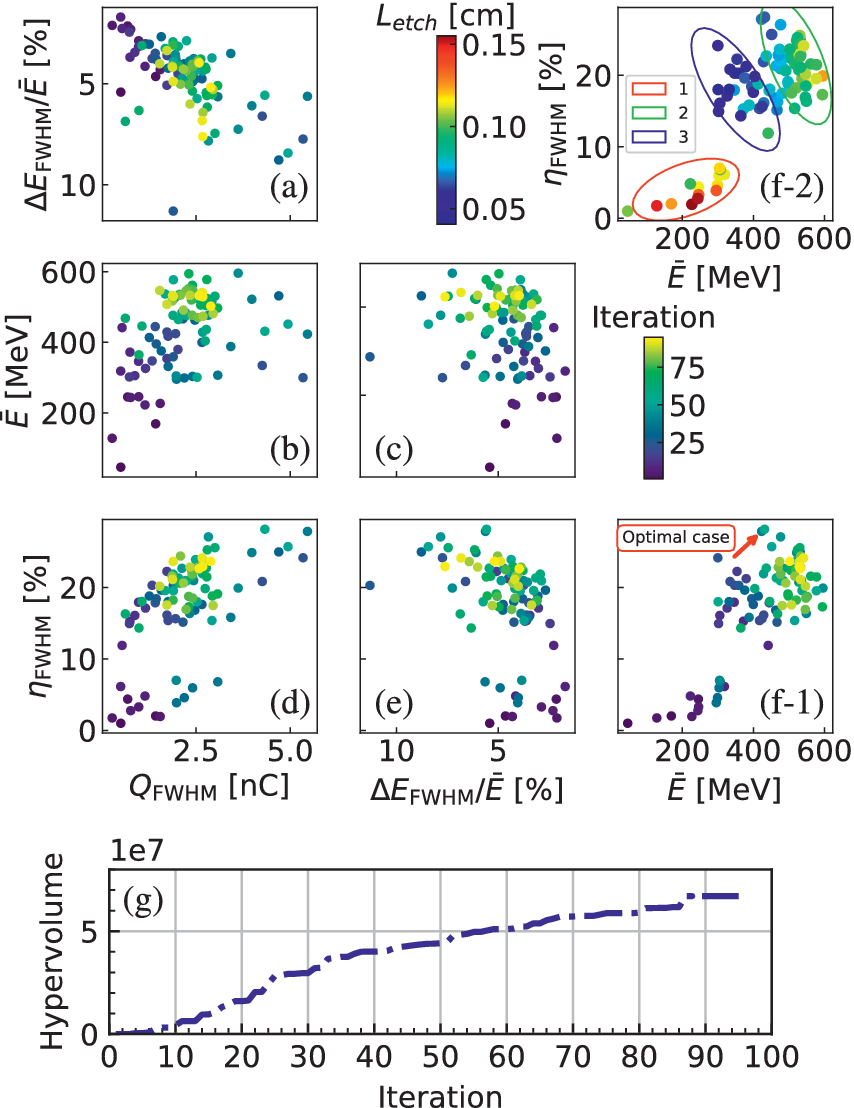
 . The beam parameters at which the chirp of the beam is approximately removed are chosen as the training data. Upon executing nearly 100 iterations of the algorithm, the objective parameters are as depicted in Figure 6. Evidently, three separate Pareto fronts or clusters of points can be easily identified, which roughly correspond to the three types of dechirping mechanism described earlier. The behavior of the algorithm is observed to quickly deviate from the long-depletion regime and converge to the moderate-depletion regime. The electron beams generated in the moderate-depletion regime display higher energy and higher energy transfer efficiency. The physical trade-off between the charge and the energy spread broadens the spectrum of the beam as the charge is much higher (Figure 6(a)). Figure 6(g) shows the evolution of the hypervolume over the iterations. The hypervolume increases rapidly in the early stage and continues to grow throughout the optimization, indicating that the MOBO algorithm effectively explores the parameter space. Although full convergence has not been reached within 100 iterations, the hypervolume already shows a substantial improvement over the initial solutions, confirming the effectiveness of the MOBO approach in jointly optimizing the beam quality and the energy transfer efficiency.
Diagram of the multi-objective Bayesian optimization. (a) The objective pairs of energy spread
$\Delta {E}_{\mathrm{FWHM}}/\overline{E}$
 versus charge
${Q}_{\mathrm{FWHM}}$
 . (b) The beam energy
$\overline{E}$
 versus charge
${Q}_{\mathrm{FWHM}}$
 . (c) The beam energy
$\overline{E}$
 versus energy spread
$\Delta {E}_{\mathrm{FWHM}}/\overline{E}$
 . (d) The energy transfer efficiency
${\eta}_{\mathrm{FWHM}}$
 versus charge
${Q}_{\mathrm{FWHM}}$
 . (e) The energy transfer efficiency
${\eta}_{\mathrm{FWHM}}$
 versus energy spread
$\Delta {E}_{\mathrm{FWHM}}/\overline{E}$
 . (f-1) The energy transfer efficiency
${\eta}_{\mathrm{FWHM}}$
 versus energy
$\overline{E}$
 . In (f-2), three clusters of dots are categorized according to the associated laser depletion length
${L}_\mathrm{{etch}}$
 and the legend numbers are indicative of the three types of dechirping mechanisms. (g) The evolution of the hypervolume over the iterations.

Figure 6 Long description
A multi-panel figure with seven scatter plots labeled a through f-2 and one line graph labeled g.
* Scatter plots a through f-1 use a color scale for Iteration, ranging from dark purple at 25 to bright yellow at 75.
* Panel a: Delta E sub F W H M over E bar percent on the y-axis versus Q sub F W H M in n C on the x-axis. Data shows a downward trend where higher charge correlates with lower energy spread.
* Panel b: E bar in M e V on the y-axis versus Q sub F W H M on the x-axis. A dense cluster of yellow points appears around 500 M e V and 2.5 n C.
* Panel c: E bar on the y-axis versus Delta E sub F W H M over E bar on the x-axis.
* Panel d: Eta sub F W H M percent on the y-axis versus Q sub F W H M on the x-axis. Shows a positive correlation between charge and energy transfer efficiency.
* Panel e: Eta sub F W H M on the y-axis versus Delta E sub F W H M over E bar on the x-axis.
* Panel f-1: Eta sub F W H M on the y-axis versus E bar on the x-axis. An Optimal case label with a red arrow points to a high-efficiency, high-energy cluster.
* Panel f-2: Uses a different color scale for L sub etch from 0.05 to 0.15 cm. Three clusters are circled and numbered: 1 red, 2 green, and 3 blue, representing different dechirping mechanisms.
* Panel g: A line graph at the bottom showing Hypervolume on the y-axis (up to 5 times 10 super 7) versus Iteration on the x-axis (0 to 100). The curve shows a steady logarithmic-like increase, plateauing toward the later iterations.
5 Discussion
Generally, points lying on the Pareto front are considered optimal and are the desired targets of the optimization process. An example of such an optimal point is indicated by the red arrow in Figure 6(f-1), which corresponds to laser and plasma parameters of
${a}_0=20$
 ,
${w}_0=9\;\mu \mathrm{m}$
 ,
${\tau}_{\mathrm{FWHM}}~=~7.17\;\mathrm{fs}$
 and
${n}_\mathrm{p}~=~5.4\times {10}^{18}\ {\mathrm{cm}}^{-3}$
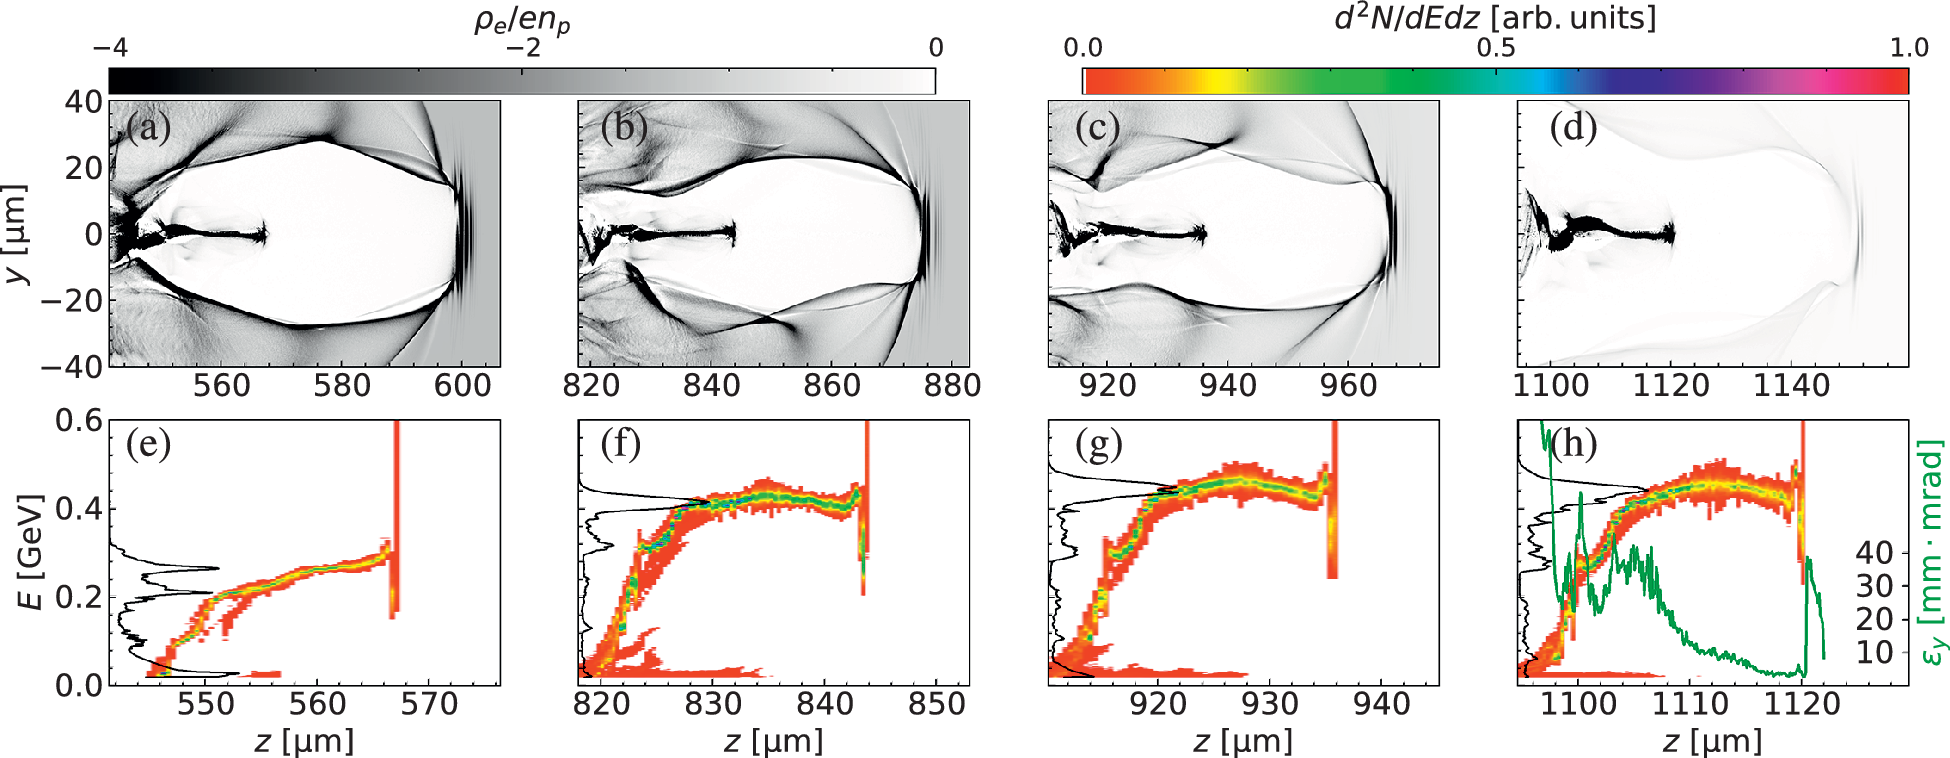
 . In the simulations and parameter optimization presented above, we did not account for the effect of the plasma exit (i.e., the down-ramp) on the beam quality, as it was unclear when the beam chirp would be eliminated. We now introduce the plasma exit into our simulations, whose density profile is symmetric to that at the plasma entrance. To maintain simulation accuracy, we accordingly increased the transverse resolution by increasing the cells from 256 to 1024 and setting the number of azimuthal modes to 4. Figures 7(a)–7(d) show the snapshots in the yz plane (i.e., the laser polarization plane). Transverse oscillations of the beam and the bubble are clearly observed, which arise from the single-cycle effect (CEP effect)[
Reference Nerush and Kostyukov
32
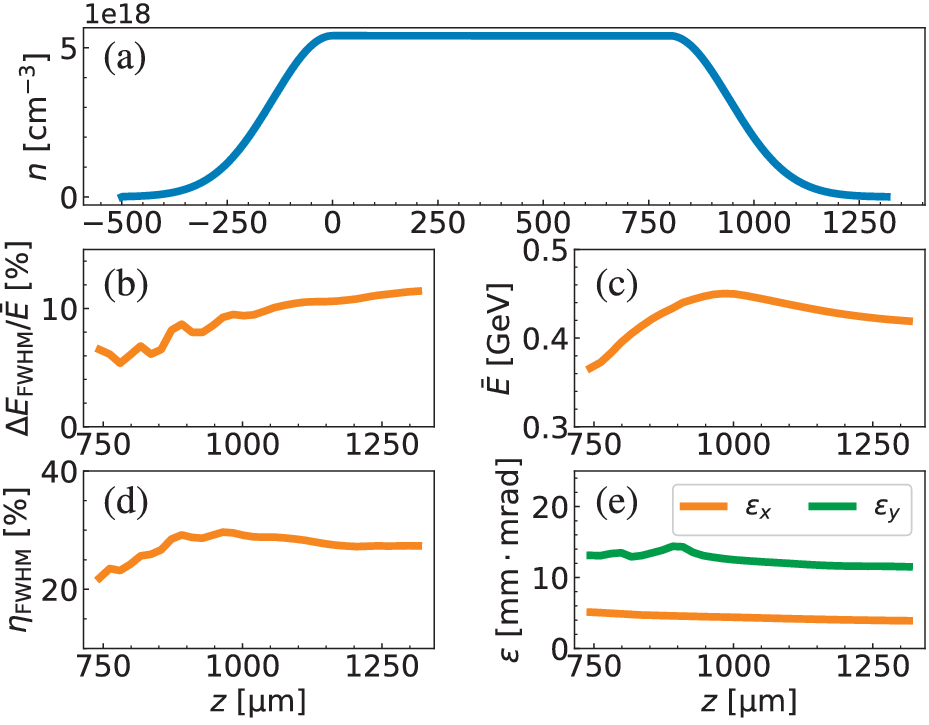
] induced by the self-compression of the laser pulse. This effect also results in very large transverse momentum and emittance for the lately injected electrons (Figure 7(h)). The evolution of the beam parameters at the plasma exit reveals a marked increase in beam energy spread (Figure 8(b)). This deterioration is attributed to aggravated beam loading in the low-density region, where the trailing particles of the high-charge bunch are strongly decelerated, thereby broadening the energy spectrum and compromising both the final beam energy and the transfer efficiency (Figures 8(c) and 8(d)). After passing through the plasma down-ramp, the electron beam has
${Q}_{\mathrm{FWHM}}=5.4\;\mathrm{nC}$
 , energy spread of
$\Delta {E}_{\mathrm{FWHM}}/\overline{E}\sim 11.45\%$
 , energy of
$\overline{E}\sim 0.42\;\mathrm{GeV}$
 , energy transfer efficiency of
${\eta}_{\mathrm{FWHM}}\sim 27.33\%$
 and normalized emittance of
${\varepsilon}_x\sim 3.9\;\mathrm{mm}\cdot \mathrm{mrad}$
 and
${\varepsilon}_y\sim 11.5\;\mathrm{mm}\cdot \mathrm{mrad}$
 . Note that we prioritized the optimization of beam charge to explore physics scenarios where high-charge beams are of particular interest, such as for radiation sources or beam-driven wakefield applications. While this comes at the cost of a reduced maximum energy, we believe this trade-off is worthwhile for applications that demand high charge[
Reference Qin, Geng, Zhang, Yu, Zhang, Dai, Wang, Zhang, Guo, Xu, Xu, Ding, Xu, Liu, Wang, Shi, Zhang, Liu, Leng, Liang, Shen, Ji and Li
40
,
Reference Shi, Wang, Xie, He, Dong, Sun, Huang, Zhang, Yang, Deng, Lu, Zhou, Gu, Leng, Li and Xu
41
] over ultra-high energy.
The snapshots of the plasma wakefield (a)–(d) and the corresponding distributions of the LPS (e)–(h) of the injected electron beam for the simulation with plasma density
${n}_\mathrm{p}=5.4\times {10}^{18}\ {\mathrm{cm}}^{-3}$
 and an 8.3 J laser at different positions. The black curves in (e)–(h) are the energy spectrum, and the green curve in (h) is the slice emittance. Because the head of the beam is positively chirped, this case belongs to the moderate-depletion regime.

Figure 7 Long description
A multi-panel plot organized into two rows.
Top row (a-d): Four grayscale snapshots of the plasma wakefield. The vertical y-axis ranges from -40 to 40 micrometers, and the horizontal z-axis shows progressive positions from 560 to 1140 micrometers. A grayscale bar at the top indicates rho sub e all over e n sub p values from -4 to 0. The snapshots show a bubble-like structure in the plasma with a dense electron filament along the central axis (y = 0). As the beam moves from panel a to d, the wakefield structure becomes less defined.
Bottom row (e-h): Four heatmaps showing the longitudinal phase space (L P S) of the injected electron beam. The vertical axis represents energy E in G e V from 0.0 to 0.6, and the horizontal axis represents z in micrometers. A color scale at the top indicates d super 2 N all over d E d z in arbitrary units from 0.0 (orange) to 1.0 (pink).
Data trends in bottom row:
- The beam shows a negative chirp where energy increases with z.
- Black curves on the left of each panel represent the energy spectrum, showing a peak that shifts to higher energy from panel e to h.
- Panel h includes a green curve representing slice emittance epsilon sub y in millimeters times milliradians, which peaks near the tail of the beam at approximately 40 and drops toward the head.
(a) The plasma density distribution for the simulation including the plasma down-ramp. The evolution of the energy spread
$\Delta {E}_{\mathrm{FWHM}}/\overline{E}$
 (b), energy
$\overline{E}$
 (c), energy transfer efficiency
${\eta}_{\mathrm{FWHM}}$
 (d) and normalized emittance
${\varepsilon}_x$
 and
${\varepsilon}_y$
 (e) of the beam during passing through the plasma density down-ramp.

Figure 8 Long description
Panel a is a line graph of plasma density n in units of 10 super 18 per cubic centimeter versus z in micrometers. The density rises from 0 at z equals minus 500 to a plateau of 5.5 from z equals 0 to 800, then ramps down to 0 by z equals 1250.
Panel b shows energy spread Delta E sub F W H M over E bar in percent versus z from 750 to 1300. The orange line shows a fluctuating but overall increasing trend from 6 percent to 12 percent.
Panel c shows mean energy E bar in G e V versus z. The orange line increases from 0.37 G e V at z equals 750 to a peak of 0.45 G e V at z equals 1000, then gradually declines to 0.42 G e V.
Panel d shows energy transfer efficiency eta sub F W H M in percent versus z. The orange line rises from 22 percent to a peak of 30 percent near z equals 1000 before slightly declining to 28 percent.
Panel e shows normalized emittance epsilon in millimeter milliradians versus z. An orange line for epsilon sub x remains nearly flat near 5. A green line for epsilon sub y starts at 13, peaks at 15 near z equals 900, and then slowly decreases toward 12.
6 Conclusion
We have performed PIC simulations to show that LWFAs driven by moderately short laser pulse duration can have enhanced beam quality and energy transfer efficiency. By applying the laser defocusing injection scheme, a sub-petawatt laser pulse with a duration around
$10\;\mathrm{fs}$
 generates a nanocoulomb electron beam with an initially negative chirp, which is experiencing an automatic two-step dechirping process during the subsequent acceleration process. By employing MOBO, we show the generation of electron beams with high energy transfer efficiency of up to
$28\%$
 , small energy spread of less than approximately
$5\%$
 , energy of approximately
$500\;\mathrm{MeV}$
 and charge of approximately
$5\;\mathrm{nC}$
 using a
$10\;\mathrm{J}$
 laser. Our findings make a significant step toward compact accelerator-based applications.
Acknowledgements
This work was supported by the Strategic Priority Research Program of the Chinese Academy of Sciences (Grant Nos. XDB0530000 and XDB0890200), the National Natural Science Foundation of China (Grant Nos. 12475159, 12225411, 12388102, 12474349 and 12174410), the Key Research Program of Frontier Sciences of the Chinese Academy of Sciences (Grant No. QYZDJ-SSW-SLH004), the CAS Project for Young Scientists in Basic Research (Grant No. YSBR060), the CAS Youth Innovation Promotion Association (Grant No. 2022242) and the New Cornerstone Science Foundation through the Xplorer Prize.















 Open access

