Over the past decade, arginine vasopressin has become an important part of the armamentarium available to paediatric cardiac intensivists for the management of post-operative haemodynamic instability. Several authors have reported the use of arginine vasopressin in children following cardiac surgery.Reference Rosenzweig, Starc and Chen 1 – Reference Mastropietro, Clark, Delius, Walters and Sarnaik 4 In nearly all of these cases, arginine vasopressin was initiated for haemodynamic instability with clinically apparent vasodilatation and led to increased blood pressure and decreased exogenous catecholamine requirements. We recently reported the existence of relative arginine vasopressin deficiency in some children undergoing cardiac surgery with cardiopulmonary bypass.Reference Mastropietro, Rossi and Clark 5 In these children, plasma arginine vasopressin concentrations were low before surgery and remained low post-operatively despite changes in blood pressure, central venous pressure, and plasma osmolality. Low plasma arginine vasopressin concentration in these children was not in and of itself associated with hypotension, a finding consistent with a previous report.Reference Morrison, Simone, Conway, Tumulty, Johnson and Cardarelli 6 Rather, in a small subset of patients in the study who required exogenous arginine vasopressin therapy, those who were hypotensive and had coincident relative arginine vasopressin deficiency seemed to benefit most from exogenous arginine vasopressin infusion, whereas those with hypotension and appropriately high plasma arginine vasopressin concentration received little or no benefit. In fact, catecholamine requirements increased in three patients with elevated pre-infusion arginine vasopressin concentrations. We concluded that, in contrast to previous reports, some patients with haemodynamic instability and clinically apparent vasodilatation may not improve clinically with arginine vasopressin infusion, depending at least partly upon pre-infusion plasma arginine vasopressin concentrations.
Ideally, knowledge of plasma arginine vasopressin concentration at the bedside could help identify optimal or poor candidates for exogenous arginine vasopressin therapy. Measurement of arginine vasopressin, however, is challenging. The mature hormone has a short half-life. Specimen collection needs to be carefully performed and measurement is cumbersome and time-consuming, making plasma arginine vasopressin an impractical means to guide clinical decision making. In this study, we therefore aimed to confirm, in a larger group of patients, that arginine vasopressin infusion does not lead to haemodynamic improvement in all children following cardiac surgery and identify clinical characteristics that could differentiate the arginine vasopressin responders from those who will not benefit haemodynamically from its use.
Materials and methods
This retrospective study was approved by the Institutional Review Boards of Wayne State University and the Detroit Medical Center. All children less than or equal to 6 years of age who received an arginine vasopressin infusion for at least 6 hours for haemodynamic instability within the first 7 days following cardiac surgery at the Children's Hospital of Michigan from January, 2009 to July, 2010 were included in the study. The study was restricted to children less than or equal to 6 years of age in an attempt to limit the heterogeneity of the study population. Children who received arginine vasopressin were identified by reviewing the medication administration records of all children who underwent open heart surgery during this time period.
Our institutional operative protocol has been previously described.Reference Mastropietro, Rossi and Clark 5 Briefly, all patients received methylprednisolone 30 milligrams per kilogram before surgical incision. Cardiopulmonary bypass was performed using a Terumo System One heart–lung machine with a roller arterial pump (Terumo Cardiovascular Systems, Ann Arbor, Michigan, United States of America) and a Jostra HCU-30 heater–cooler unit (Maquet Cardiopulmonary, Solna, Sweden). Cardiopulmonary bypass was instituted with target flow rate of 2.5 to 3.0 litres per minute per square metre. Acid–base status was managed using a pH stat blood gas strategy. After cross-clamp removal, zero-balanced ultra-filtration was started. After terminating cardiopulmonary bypass, 20 minutes of modified ultra-filtration was initiated. Post-operatively, patient management including fluid resuscitation, use of exogenous catecholamines, and the decision to start exogenous arginine vasopressin was at the discretion of the cardiovascular surgical and intensive care teams. No formal criteria for arginine vasopressin therapy were followed. Other adjuncts towards haemodynamic instability employed in these patients included intravenous corticosteroids, inhaled nitric oxide, and extracorporeal membrane oxygenation.
Anthropometric, peri-operative, and post-operative data were reviewed for all patients. Basic and comprehensive Aristotle scores were also recorded for all patients.Reference Lacour-Gayet, Jacobs and Clarke
7
The Aristotle score is a risk stratification tool used to stratify paediatric cardiac surgical procedures based upon complexity. We recorded haemodynamic variables, for example heart rate, systolic blood pressure, catecholamine requirements, and lactate for all patients before and 6 hours after initiation of arginine vasopressin therapy. We also recorded fluid balance variables, for example fluid input, urine output, and drain output, during this time period. We chose to evaluate haemodynamics over a 6-hour time period following initiation of arginine vasopressin therapy to provide adequate time to observe a clinical response – arginine vasopressin
 $$)(-->$<>{{{\rm{t}}}_{{{\rm{1}} \mathord{\left/ {\vphantom {{\rm{1}} 2}} \right. \kern-\nulldelimiterspace} 2}}}<$>
<!--$$
is 7–10 minutes – and limit the effect of other variables on haemodynamic stability – for example, recovery time post surgery. We also recorded pre-infusion toe temperature and delta (core minus toe) temperature, commonly used clinical indicators of peripheral vasodilatation.
We divided the patients into two groups based on their response to arginine vasopressin infusion. Favourable responders were defined as those patients in whom systolic blood pressure was increased or maintained and catecholamine score was decreased from pre-infusion values at 6 hours following arginine vasopressin initiation or in whom systolic blood pressure was increased by at least 10% and catecholamine score was unchanged. Increases in systolic blood pressure less than 10% – for example, 60 millimetres of mercury to 63 millimetres of mercury – at the same catecholamine dosages were deemed clinically insignificant. These definitions were based on the previous reports of arginine vasopressin use in infants and children after cardiac surgery, in which nearly all infants are shown to have increased blood pressure and decreased catecholamine score after arginine vasopressin initiation.Reference Rosenzweig, Starc and Chen 1 – Reference Mastropietro, Clark, Delius, Walters and Sarnaik 4 Catecholamine score was calculated using a modification of the inotrope score developed by Wernovsky et alReference Wernovsky, Wypij and Jonas 8 as follows: dopamine dose plus dobutamine dose plus (epinephrine dose multiplied 100) plus (norepinephrine dose multiplied by 100).
Duration of mechanical ventilation, intensive care unit length of stay, and in-hospital mortality were also recorded, as was ventilator-free days at 28 days post operation to account for patients who expired, which were assigned zero ventilator-free days. Data are represented as mean (standard deviation) unless otherwise noted. Characteristics of favourable responders were compared with those who did not respond favourably using t-tests, Mann–Whitney U-test, or Fisher exact tests as appropriate for individual variables. All calculations were performed using ISPSS Statistics 19.0 (IBM, Armonk, New York, United States of America).
Results
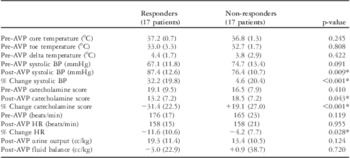
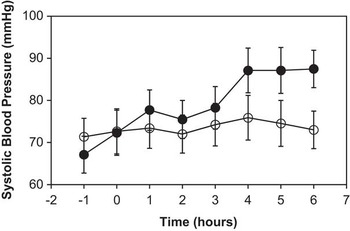
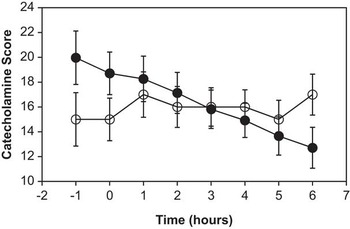
A total of 34 patients who received arginine vasopressin for haemodynamic instability for at least 6 hours during the first 7 post-operative days were identified. In addition to intravenous catecholamines, 33 of the 34 patients were also receiving intravenous milrinone at the time of arginine vasopressin initiation. In all, 17 patients (50%) had a favourable haemodynamic response to arginine vasopressin, whereas the other 17 did not respond favourably. Haemodynamic data and fluid balance are provided in Table 1. It is noteworthy that fluid balance was similar in both groups, with the majority of responders in negative fluid balance during the 6 hours following arginine vasopressin initiation. Hourly changes in the systolic blood pressure and catecholamine score following arginine vasopressin initiation for those who responded favourably and those who did not are shown in Figures 1 and 2, respectively. The mean maximum arginine vasopressin dose was similar in both groups, 0.85 (0.54) milliunits per kilogram per minute in responders (ranging from 0.3 to 2) and 0.99 (0.48) milliunits per kilogram per minute in non-responders (ranging from 0.5 to 2), with a p-value of 0.460. Further, despite no evidence of haemodynamic improvement in the non-responders, the mean duration of arginine vasopressin therapy was similar, 43.3 (27.5) hours in responders and 40.1 (25.7) hours in non-responders, with a p-value of 0.759.
Haemodynamics and fluid balance.

AVP = arginine vasopressin; BP = blood pressure; HR = heart rate
Post-AVP systolic BP, catecholamine score, and heart rate were recorded at 6 hours following initiation of AVP
Catecholamine score: dopamine + dobutamine + (epinephrine × 100) + (norepinephrine × 100)
Fluid balance: total fluid input − (urine + drain output) for 6 hours post-arginine vasopressin
Variables represented as mean (standard deviation)
*Statistical significance set at p < 0.05
Mean hourly changes in systolic blood pressure after initiation of arginine vasopressin. In patients who responded favourably (dark circles), mean systolic blood pressure steadily increased after arginine vasopressin was started (time 0), whereas mean systolic blood pressure in patients who did not respond or responded unfavourably (white circles) changed minimally. Error bars represent standard error of the mean.

Mean hourly changes in catecholamine score after initiation of arginine vasopressin. In patients who responded favourably (dark circles), catecholamine score steadily decreased after arginine vasopressin was started (time 0), whereas catecholamine score in patients who did not respond or responded unfavourably (white circles) changed minimally. Error bars represent standard error of the mean.

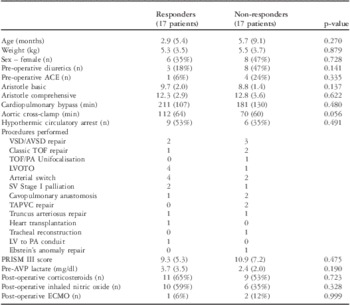
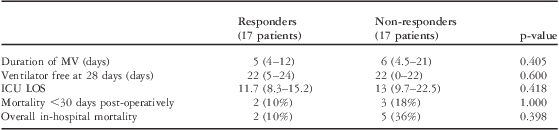
The clinical characteristics of these patients are provided in Table 2. Patients who responded favourably had similar anthropometrics, demographics, pre-operative cardiovascular medical management, and intra-operative characteristics as compared with those who did not, although there was a trend towards longer duration of aortic cross-clamping in the responders. Pre-arginine vasopressin infusion peripheral skin temperatures, objective measures of peripheral vasodilatation, and pre-arginine vasopressin infusion lactate measurements were also not helpful in distinguishing between favourable responders and non-favourable responders. The median time of arginine vasopressin initiation following admission to the intensive care unit, however, was significantly later in responders, 20 hours (intraquartile range from 16 to 27), as compared with those who did not respond, 6 hours (intraquartile range from 5.5 to 21.5), with a p-value of 0.032. The clinical outcomes, provided in Table 3, were similar in both groups.
Patient characteristics.

ACE = angiotensin-converting enzyme; AVP = arginine vasopressin; AVSD = atrioventricular septal defect; ECMO = extracorporeal membrane oxygenation; LV to PA conduit = left ventricular to pulmonary artery conduit for congenitally-corrected transposition of the great arteries with pulmonary stenosis; LVOTO = left ventricular outflow tract obstruction; PA = pulmonary atresia; PRISM = Paediatric Risk of Mortality; SV = single ventricle; TAPVC = total anomalous pulmonary venous connections; TOF = tetralogy of Fallot; VSD = ventricular septal defect; Pre-AVP lactate values were obtained at a mean of 1.0 (1.4) hours before initiation of AVP therapy
Metric data are represented as mean (standard deviation); statistical significance set at p < 0.05
Outcomes.

ICU LOS = intensive care unit length of stay; MV = mechanical ventilation
Metric data are represented as median (intraquartile range) due to skewness
Statistical significance set at p < 0.05
Discussion
This is the first report comparing patients who haemodynamically improved with arginine vasopressin with those who did not. Anthropometric, demographic, and intra-operative data were not helpful in predicting response to arginine vasopressin therapy. In particular, peripheral skin temperatures, commonly used markers of systemic dilatation, were not helpful in differentiating arginine vasopressin responders to non-responders. Disease severity was also similar between groups, as indicated by similar PRISM (Paediatric Risk of Mortality) III scores; pre-arginine vasopressin systolic blood pressures and catecholamine scores; and use of corticosteroids, inhaled nitric oxide, and extracorporeal membrane oxygenation. Further, the variety of different surgical procedures performed in both groups did not allow us to associate a favourable haemodynamic response with a specific cardiac lesion or lesions. On the other hand, patients who responded favourably to arginine vasopressin began receiving it later in their post-operative course as compared with those who did not respond favourably. The median time of arginine vasopressin initiation in those who responded favourably was 20 hours, which typically corresponds to the morning or early afternoon of the first post-operative day. In contrast, the median time to arginine vasopressin initiation in those who responded minimally was 6 hours, or early in the first post-operative night.
Our findings can be explained by what is known regarding endogenous arginine vasopressin concentrations after cardiopulmonary bypass. In the majority of infants and children following cardiopulmonary bypass, endogenous arginine vasopressin concentrations increase markedly in the immediate post-operative period, remaining significantly elevated above baseline in the first 0–12 hours following cardiopulmonary bypass and return to baseline by 24–48 hours, often regardless of the degree of haemodynamic stability.Reference Mastropietro, Rossi and Clark 5 – Reference Morrison, Simone, Conway, Tumulty, Johnson and Cardarelli 6 Further, endogenous arginine vasopressin concentrations have not been shown to correspond with anthropometric, demographic, or intra-operative data in this patient population.Reference Mastropietro, Rossi and Clark 5 – Reference Morrison, Simone, Conway, Tumulty, Johnson and Cardarelli 6 Endogenous arginine vasopressin concentrations were likely much higher in the patients in our study who received arginine vasopressin earlier in their post-operative course. Owing to the fact that response to arginine vasopressin is related at least partly to pre-infusion endogenous arginine vasopressin concentrations,Reference Mastropietro, Rossi and Clark 5 additional exogenous arginine vasopressin was likely less effective in these patients. In addition, low cardiac output with elevated systemic vascular resistance is more common on the first post-operative night as compared with haemodynamic instability with systemic vasodilatation.Reference Killinger, Hsu, Schleien, Mosca and Hardart 9 Low cardiac output with elevated systemic vascular resistance could have been present in some of our patients despite clinical examination findings including peripheral skin temperatures and capillary refill time that suggested otherwise. These physical examination findings have been shown to be influenced by environmental temperatures and, as a result, can be unreliable markers of systemic vascular resistance.Reference Tibby, Hatherhill and Murdoch 10 If arginine vasopressin is initiated in patients with low cardiac output and elevated systemic vascular resistance, it would likely be of little benefit to these children.
However, we are not advocating to universally delay the use of arginine vasopressin until the first post-operative day. Indeed, a few patients who responded to arginine vasopressin did so in the early post-operative period. These patients possibly had relative arginine vasopressin deficiency, as we have described previously.Reference Mastropietro, Rossi and Clark 5 In this subset of patients, endogenous arginine vasopressin concentrations are low before cardiopulmonary bypass and remain low throughout the post-operative course. If hypotension occurs in this setting, arginine vasopressin should be helpful. We therefore suggest that clinicians temper their expectations for arginine vasopressin on the first post-operative night, monitor the clinical response to arginine vasopressin closely, and discontinue arginine vasopressin if blood pressure does not improve or if catecholamine use increases after its initiation. Interestingly, despite no objective evidence of clinical improvement in the group of non-responders, the duration of arginine vasopressin therapy in this group was similar to those who responded favourably. We presume that following tenuous periods of haemodynamic instability during which multiple bedside actions were taken, the contribution of arginine vasopressin to each patient's haemodynamic stabilisation was unclear, and thus our clinicians were likely reluctant to quickly wean or discontinue arginine vasopressin. We have since modified our practice and currently wean arginine vasopressin when clinical benefit is not observed.
Our study has several limitations. First, we acknowledge that our definitions of responders and non-responders to arginine vasopressin therapy may not properly categorise all patients. It is possible that some patients are “weak” responders, such that arginine vasopressin does not increase blood pressure significantly but provides enough stability to prevent further escalation of exogenous catecholamine requirements. In other patients such as those with increased blood pressure at increased catecholamine dosages or decreased blood pressure at decreased catecholamine dosages, the contribution of arginine vasopressin to their haemodynamic status is unclear. Most clinicians, however, initiate arginine vasopressin in this patient population to increase blood pressure, decrease dependence on exogenous catecholamines, and alleviate some of the detrimental effects associated with their use, such as excessive tachycardia.Reference Rosenzweig, Starc and Chen 1 – Reference Mastropietro, Clark, Delius, Walters and Sarnaik 4 , Reference Scheurer and Thiagarajan 11 In addition to vasoconstriction by direct stimulation of the V1 receptor on vascular smooth muscle, arginine vasopressin also enhances catecholamine sensitivity.Reference Holmes, Landry and Granton 12 These two effects should, in most patients with vasodilatory shock, at the very least increase blood pressure and ideally also permit catecholamine weaning. Second, our study is limited by its small sample size. A large study may be able to identify additional predictors of arginine vasopressin response. For example, there was a near-significant trend of longer duration of aortic cross-clamping in arginine vasopressin responders, which should be further examined in a larger study. Lastly, our study is limited by its retrospective design. Prospective evaluation of arginine vasopressin response recording haemodynamic variables at frequent pre-set time intervals, as well as measurement of markers of perfusion such as mixed venous oxygen saturation and arterial lactate pre- and post-initiation of arginine vasopressin, would provide important data.
Children recovering from cardiac surgery who receive arginine vasopressin represent a high acuity patient population at risk for significant morbidity and mortality. Indeed, three previous series of paediatric cardiac surgical patients receiving arginine vasopressin for post-operative hypotension report mortality of 18–24%.Reference Rosenzweig, Starc and Chen 1 – Reference Jerath, Frndova, McCrindle, Gurofsky and Humpl 3 In our study, in-hospital death occurred in 7 of the 34 patients (21%), consistent with these previous reports and markedly higher than that of the rest of our paediatric cardiac surgical patients. Further research directed at optimising the post-operative care of this challenging patient population should be pursued, such as determining the degree to which haemodynamic response to arginine vasopressin therapy is affected by endogenous plasma arginine vasopressin concentration, as well as devising a means of estimating plasma arginine vasopressin concentration at the bedside. For example, in cases of minimal or poor response to arginine vasopressin therapy, knowledge of pre-infusion plasma arginine vasopressin concentration could help a clinician decide to discontinue arginine vasopressin therapy or try further dose escalation. Copeptin, a more stable by-product of the arginine vasopressin precursor pro-vasopressin that is secreted in equimolar ratio and less challenging to measure, represents a possible means to this end.Reference Choong and Kissoon 13
In conclusion, arginine vasopressin therapy leads to haemodynamic improvement in some but not all patients with haemodynamic instability and apparent vasodilatation after paediatric cardiac surgery. In some patients, blood pressure decreased and/or catecholamine requirements increased after initiation of arginine vasopressin. Until a better method for assessing plasma arginine vasopressin concentration is available at the bedside, careful monitoring of the haemodynamic consequences of arginine vasopressin therapy should be performed, especially if arginine vasopressin was started on the first post-operative night.