Introduction
Proximal sensing is a promising technology that provides information concerning the crop’s physiological and phenological status. This information is based on the spectral absorption and scattering features of the plants. Many different vegetation indices (VI) have been developed, and are in use to estimate quantitatively the relationship between multi-spectral reflectance and effective crop physiological parameters, i.e. biomass nitrogen, nutrients content, phenology etc. (Bonfil and Gitelson, Reference Bonfil and Gitelson2014; Gnyp et al., Reference Gnyp, Miao, Yuan, Ustin, Yu, Yao, Huang and Bareth2014; Li et al., Reference Li, Miao, Feng, Yuan, Yue, Gao, Liu, Liu, Ustin and Chen2014; Mulla, Reference Mulla2013; Pimstein et al., Reference Pimstein, Karnieli, Bansal and Bonfil2011; Pimstein et al., Reference Pimstein, Eitel, Long, Mufradi, Karnieli and Bonfil2009). Strategies to make use of plant sensors-based diagnostic information for nitrogen recommendations have been developed and reviewed (Samborski et al., Reference Samborski, Tremblay and Fallon2009).
The RapidScan, a simple active radiometer, offers an option retrieving red (R), red edge (RE) and near infrared (NIR) plant reflectance enabling calculation of many VI’s such as NDVI, NDRE, and others based on the important RE region (Bonfil and Gitelson, Reference Bonfil and Gitelson2014). It was found that the sensor sense mainly biomass, and although sensing N concentration is problematic, sensing N uptake is more accurate than the biomass itself (Bonfil and Gitelson, Reference Bonfil and Gitelson2014). However, that study showed that correlation accuracy must be taken with caution as there was low repeatability in different data bases, difference between CropCircle and RapidScan correlation, and finally as a variation between fields accounted for the correlation much more than the within field variation. As that study included only one season of RapidScan measurements, the first objective of the present study was to evaluate the accuracy of quantitative biomass and nitrogen uptake estimation by RapidScan over several seasons.
Furthermore, average of NDVI values during the period from prior heading until the late grain-filling stage (AVGBG) was highly correlated with grain yield (Bonfil, Reference Bonfil2016). However, for accurate yield prediction, it was found that cultivar effect must be included. Moreover, it was shown that the yield-NDVI ratio enables calculation of the yield loss due to stresses such as drought or disease that prevailed at the grain-filling stage, which did not affect biomass production or potential yield, prior to the occurrence of the stress. Once again, it was based on only two seasons, and it requires validation in more experiments. Hence, the second objective of this study was to evaluate yield loss estimation based on NDVI retrieved from larger data set.
Materials and methods
Wheat Samples
The study was carried out during the growing seasons of 2013–2016 on commercial spring wheat fields of kibbutz Saad (~10 ha each) and experiment fields (~0.5 ha) at the Gilat Research Center, located in the Northern Negev region of Israel. RapidScan CS-45 (Holland Scientific) data has been collected by hand, approximately 1 m above the canopy. Measurements included spectral reflectance and sampling of plants contained within the field of view of the RapidScan for biomass and N analysis. The samples for biomass and N uptake that were collected from commercial and experimental fields covered the main development stages of active vegetative growth, spanning from 2 leaves (Zadoks 12) up to stem elongation (Zadoks 35), reflecting large differences in canopy height and vegetation cover. The biophysical variables (canopy biomass, and N total concentration based on dry weight) were measured after drying for 48 h at 70°C. After drying, samples were weighted and the material from the whole above ground plant was grinded and mixed. N concentration was obtained using NIRS (FOSS 6500) following the micro-Kjeldhal method (Bonfil et al., Reference Bonfil, Karnieli, Raz, Mufradi, Asido, Egozi, Hoffman and Schmilovitch2005). Thereafter, the N content was calculated by multiplying the biomass by N concentration. For yield loss estimation, in the additional experiments, canopy reflectance was monitored by the RapidScan for the whole plot, 10–20 m long. Reflectance data was collected from emergence until harvest at weekly intervals. More data on the 2014–2015 data are listed earlier (Bonfil, Reference Bonfil2016). In 2016 season, two similar experiments have been added, differing in sowing time, the emergence of the first occurred in mid-November and the second a month later. Grain yield was determined from a 20–40 m2 area, harvested with a combine.
Data Analysis
All vegetation indices included in the first study (Bonfil and Gitelson, Reference Bonfil and Gitelson2014) were evaluated and analyzed similarly, as a potential tool for monitoring the crop’s nutritional contents by quantitatively retrieving the nutrient content in the crop. The best parameter that estimated grain yield AVGBG (average of NDVI values during the period from prior heading until the late grain-filling stage) (Bonfil, Reference Bonfil2016), was tested in the present work. The absolute difference between the estimated yield and the harvested yield is presented as a percent difference from the actual yield, and transformed (square root) for an ANOVA test. All statistical and correlations analyses between parameters (using α=0.05) were carried out with JMP software version 12.0 (SAS Institute Inc., USA).
Results and discussion
Biophysical variables
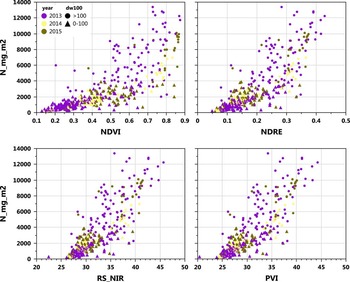
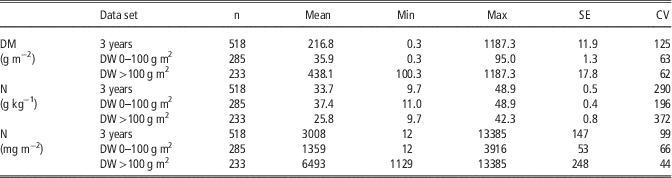
The purpose of collecting data from trials and commercial fields was to simultaneously characterize real growing conditions in commercial operations and to increase variability. The statistics of the measured biophysical variables are presented in Table 1. As many VI exhibit saturation where dry matter (DM) is higher than 100 g m2, the total data set was split to two sub-sets according biomass, below and above 100 g DM m2 (Figure 1). A total of 518 canopy samples were collected, including samples from the very beginning of the season until stem elongation time. The variation in wheat samples represents biomass of 0.3 to 1187 g DM m−2, N concentration 9.7 to 49 g kg−1, and canopy N content 12 to 13385 mg N m−2. Samples from 3 years represent almost the same range in biomass and N as in the first year samples (Bonfil and Gitelson, Reference Bonfil and Gitelson2014).
Nitrogen uptake (mg m−2) by wheat canopy in samples taken from fields monitored by RapidScan to NDVI, NDRE, PVI and NIR reflectance.

Wheat canopy biomass and nitrogen content in samples taken from fields monitored by RapidScan during three years

Biophysical variables estimation
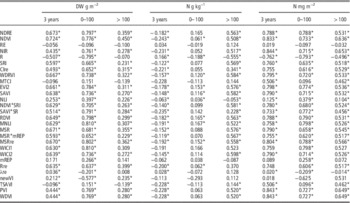
As for the first season (Bonfil and Gitelson, Reference Bonfil and Gitelson2014), high correlation existed between the different VI, as they were calculated from the same 2 or 3 bands (data not shown). Most VIs had similar correlation (Table 2 and table 2 in Bonfil and Gitelson, Reference Bonfil and Gitelson2014) with wheat parameters independent of the representing seasons. Several VI’s, as NDVI and NDRE, represent almost the same correlation based on one or three seasons. However other VI’s, as WICI1 WICI2 mREP and Rre, exhibit huge difference, emphasizing instability of the correlation, i.e. low accuracy. Therefore, applications based on these VI’s are restricted to the specific data set. The calculated correlation shows that for biomass estimation a noteworthy improvement was achieved for the 0–100 g DM m−2 data set, for many VI’s from 0.6–0.7 to 0.8, while for the high biomass data set the correlation was very low up to 0.45. In contrast, most VI’s correlation with nitrogen content exhibit significant improvement in the high vs. low biomass data set, 0.5–0.6 vs. 0.1–0.2 respectively. The highest correlation, 0.83–0.84, has been achieved for the whole data set between NIR, PVI, WDVI and NDRE with the total nitrogen uptake, as a synergism between biomass and N estimation. Surprising, the NIR reflectance without any normalization reached the highest correlation. It can be suggested that a combination of proximal sensing and a good active sensor can overcome many factors that affect reflectance measurements leading to normalization requirements. However, even the highest correlation presented in this work are lower than the correlation achieved by the CropCircle sensor that exhibit correlations of 0.9 (Bonfil and Gitelson, Reference Bonfil and Gitelson2014), emphasizing the requirement of monitoring the area surrounding of sampling points continuously, and not only one specific point.
Correlation indices between vegetation indices and wheat biomass and nitrogen, *significance lower than 0.05 (VI’s formula in Bonfil and Gitelson, Reference Bonfil and Gitelson2014)

Since, N yield is the most important parameter and it exhibits the best correlation, a multi regression analysis based on all available VI’s have been applied trying improve N yield estimation. A model that combines the EVI2 with WDVI or NIR has been found as the best model and reaches correlation of 0.85, RMSE=1597 and SEP=1.4. This accuracy is similar to the model that use ChlI with EVI2 based on the combined data, CropCircle and RapidScan, but lower than the CropCircle model that use the WDRVI and WICI2 indices. These differences between models can be attributed partially to the measurement procedure, as the CropCircle data represents an average of an area while the RapidScan data represents only the sampling point, and the combination of three seasons in the present study.
Grain yield estimation
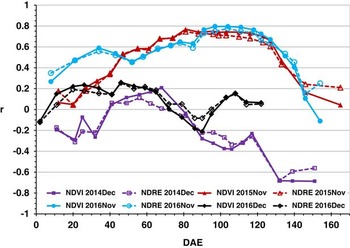
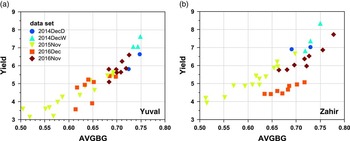
Like the CropCircle (Bonfil and Gitelson, Reference Bonfil and Gitelson2014), the grain yield estimation was based on RapidScan data that represents an average of an area, along the whole plot, 10–20 m long. Adding the 2016 experiments data shows that grain yield estimation is highly affected by emergence date (Figure 2). High correlation can be achieved for fields that emerged during November (19/11/14 & 16/11/15), but almost no correlation exists for thus emerged on December (11/12/13 & 18/12/15). In addition, for each cultivar, yield estimation by AVGBG shows yield stability or yield lost (Bonfil, Reference Bonfil2016). The low correlation achieved for the December emergence is probably a result of water stress and heat spells that occurred during the grain filling period of the late emergence (Bonfil et al., Reference Bonfil, Karnieli, Raz, Mufradi, Asido, Egozi, Hoffman and Schmilovitch2004), cutting short the grain potential yield produced on the available biomass. The cultivar Yuval shows very high yield stability, and most data set on the linear relation (Figure 3a). In comparison, cultivar Zahir (Figure 3b) exhibited nice stability for November emergence plots, with slight yield increase (mainly related to irrigation) in the December-2014 plots, and loss yield in the December-2016 plots. All cultivars have their own yield-NDVI ratio (data not shown) and most of them have similar pattern like Zahir differing in the actual yield and loss yield.
Grain yield (all wheat cultivars by experiment, year-emergence) correlation with NDVI or NDRE values as monitored by RapidScan. DAE, days after emergence.

Relation of two cultivars' grain yields (t ha−1) to the average NDVI values in the period from prior heading till late grain-filling stage (AVGBG), as measured by RapidScan (symbols by experiment, year-emergence; 2014DecD/W: D=dry, W=wet plots); a- cv Yuval; b- cv Zahir.

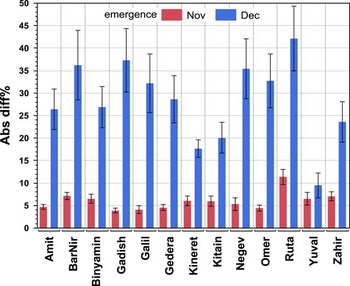
The stability of grain yield estimation based on RapidScan measurements has been tested by adding the 2016 experiments to the developed AVGBG model (Bonfil, Reference Bonfil2016). For each cultivar, yield estimation have been calculated and presented as an absolute percent of the actual harvested yield (Figure 4). The emergence timing proved crucial on yield estimation. Good yield estimation, low difference ~5%, is shown for all cultivar that emerged on November, but much higher difference ~20–40% to thus that emerge in December. A minor significant effect is shown between cultivars too, but high variation prevent separation between most of them, and usually only cultivars representing the highest and the lowest values differs. In most cases, the significant difference was for the December 2016 experiment, as exhibit for cv. Zahir (Figure 4). In 2016, both experiments were sown in parallel fields, and the average yield was 4.5 vs. 6.7 t ha−1, December vs. November emergence, representing a similar reduction of ~34% in grain production due to the later emergence.
Absolute difference (percent) of the estimate yield by AVGBG model and actual harvested yield (mean ±SE).

Discussion
Growers, scientists and breeders can use RapidScan data to test stress effect and adopt specific cultivars and lines to fit certain environments. This can be achieved by analyzing cultivar behavior along the season (Bonfil, Reference Bonfil2016) and pattern changes during stress, alternatively, it could be obtained from the grain yield (Figures 3 & 4). However, the present study emphasizes the need to use RapidScan data with caution. During vegetative growth stage, quantitative estimation of biomass and/or nitrogen uptake relate to canopy density. Up to approximately 100 g DM m−2 biomass estimation can be achieved, but on higher biomass conditions no reliable biomass information can be collected. However, estimation of nitrogen uptake becomes more reliable on this high canopy biomass. Therefore, decision making based upon RapidScan data solely in the field cannot be straight forward, and reference strip or other parameters must be added (Samborski et al., Reference Samborski, Tremblay and Fallon2009). Moreover, even the common use of proximal sensors for top dress nitrogen based on reference strip or other source of variation, must be with caution; at low biomass conditions the sensing data relates to the biomass and not to the N concentration. Therefore, if N is not the limiting factor that retards biomass production, for example where cereal cyst nematode attacked roots, then top N application would probably be a wrong decision.
Continuous measurements of NDVI along the whole season can be very important in the interpretation of proximal sensing data as it enables yield lost estimation. Yield loss can be attributed to many factors, disease and late emergence in our two cases. Therefore, an agronomic decision can be done upon profitability of fungicide application, profitability of early irrigation enabling emergence when rains delay, and vice versa, late irrigation to enable grain filling under late emergence conditions. Probably, it can be done for other limiting factors as insects, nutrients, herbicide toxicity etc., but not for weed infestation as their presence increases the NDVI values too. Still, the ability to use RapidScan sensor based on only one measurement for estimating grain yield and quality requires further studies.
Conclusions
The accuracy of biomass estimation with the Rapidscan sensor is limited up to about 100 g DM m−2 . Estimation of nitrogen uptake assessment was improved by using the full data set. Grain yield, actual and potential, estimation is highly affected by the date of emergence. Once emerged, continuous measurements of NDVI along the whole season help enable profitability to be determined for agronomic decisions. In conclusion, there are several limitations in data interpretation although, the RapidScan sensor is very impressive and can give us important data that can be used in decision-making.
Acknowledgments
This research was supported in part by a Research Grant Award from the Chief Scientist of the Israeli Ministry of Agriculture and Rural Development #20-10-0066 and by the Israel Association of Field Crop Growers. Special thanks to Dr. Kyle H. Holland from Holland Scientific.