
I. INTRODUCTION
Metallic materials continue to play an essential role in orthopedic surgery, both as bone regeneration implants and as fixation devices, among which stainless steel, cobalt-chromium, and titanium-based alloys have been used for almost a century.Reference Niinomi1 New developments and innovative methods are proposed to make these materials even more suitable.Reference Niinomi1 In this context, Mg and its alloys have gained high attention recently due to their attractive features, including biocompatibility, biodegradability, and bioresorbability,Reference Witte2,Reference Witte3 all being related to their light weight with an appropriate density (1.74–2.0 g/cm3), as well as excellent mechanical properties and elastic modulus (41–45 GPa).Reference Witte3–Reference Farraro, Kim, Woo, Flowers and McCullough11
Acting as temporary implants, Mg alloys can dissolve within the body without the need for a second surgical intervention for their removal. However, too rapid degradation of Mg from Mg alloys in the presence of human body fluids, and subsequent loss of mechanical integrity before the tissue regeneration, limits its application.Reference Grünewald, Rennhofer, Hesse, Burghammer, Stanzl-Tschegg, Cotte, Löffler, Weinberg and Lichtenegger10,Reference Zhao, Huang, Lu, Wang, Yang, Qin, Yang, Li, Li, Wang, Tian, Zhang, Gao, Wang, Zhang, Xie, Wang and Li12 In addition to that, the simultaneous generation of H2 and OH− ions in the surrounding medium causes an increase of alkalinity, leading to a delay of the healing process at the implantation place, as well as tissue necrosis.Reference Uddin, Hall and Murphy13 Many methods have been developed over the decades to combat these issues. The surface modification by heat treatment, micro-arc oxidation (MAO) using plasma or electrolytes, phosphating treatment, alloying, and ion implantation,Reference Uddin, Hall and Murphy13–Reference Chu, Han, Xue, Bai and Chu17 were used to control the degradation rate of the Mg alloy. Various surface dip- and electrophoretic-deposition coatings with biocompatible and biodegradable polymersReference Jia, Xiong, Shi, Zhou, Cheng, Zheng, Xi and Wei18–Reference Kunjukunju, Roy, Ramanathan, Lee, Candiello and Kumta24 were also investigated as an attractive strategy without altering the alloy bulk properties. However, although clinically acceptable, synthetic poly(glycolic acid), poly(lactic acid), and their copolymers with tailored in vivo degradation rates and metabolically digestible degradation productsReference Ren, Feng, Guo, Wang, Li, Yang, Hao, Lv, Ma and Li16,Reference Gong, Shen, Gao, Xie and Luo22,Reference Zhen, Xi and Zheng23,Reference Wei, Tian, Liu and Zhou25,Reference Ostrowski, Lee, Roy, Ramanathan and Kumta26 have been shown as highly potential to act as a corrosion barrier and, additionally, to deliver drugs, genes, and growth factors at the body–implant interface,Reference Ostrowski, Lee, Roy, Ramanathan and Kumta26,Reference Jeon, Song, Kang, Putnam and Kim27 the usage of natural biopolymers, such as chitosan, albumin, hyaluronic acid, alginate, cellulose, gelatine, collagen, fibronectin, etc., which were found to be more appropriate due to the lack of highly acidic degradation products as well as their bioactivity and osseo-integration support, resulting in faster/improved biological interactions with the surrounding tissues,Reference Gorgieva and Kokol28,Reference Kokubo and Takadama29 have not been fully explored yet.
In particular, gelatine which is obtained by a controlled denaturation and proteolysis of fibrous insoluble protein, type I collagen, the major constituent of skin, bones, and tissues shows high potential. This is due mainly to its good-accessible cell-recognition (i.e., Arginine–Glycine–Aspartates, RGD) sequences of amino acids with osseo-inductive and osseo-conductive properties that intensify the osteo-integration as well as three-dimensional tissue regeneration,Reference Gorgieva and Kokol28,Reference Gorgieva, Strancar and Kokol30–Reference Karthika, Kavitha, Surendiran, Kannan and Gopi32 while may simultaneously improve the anticorrosion properties and reduced adhesion of bacterial colonies.Reference Karthika, Kavitha, Surendiran, Kannan and Gopi32 Gelatine is used currently in pharmaceuticals, wound dressings, and adhesives in clinics due to its good resorption in vivo, excellent cytocompatibility, nonantigenicity, plasticity, and adhesiveness, as well as the ability to be processed in films, fibers, foams, and scaffolds, thus to engineer various tissues such as bones, as well as cartilage, heart, ligaments, and nerves.Reference Chiono, Pulieri, Vozzi, Ciardelli, Ahluwalia and Giusti33–Reference Haroun and Migonney35 Gelatine has also shown the potential to act as a barrier surface layer for Mg alloys to decrease their corrosion potential by being applied with an electrospinning and dehydrothermal post cross-linking,Reference Chan, Chian and Tan36 by an impregnation with the co-embedded hydroxyapatite (HAp) and using a zirconia sol–gel,Reference Chu, Han, Xue, Bai and Chu17 or by an emulsion solvent evaporation/extraction using the gelatine-PLGA hybrid and glutaraldehyde cross-linked nanoparticles.Reference Xu, Lu, Guo and Fang37 All the coatings showed relatively high stability with a strong binding capacity due to physical interlocking with the MAO layer which, however, may cause a deleterious influence on the corrosion protective ability—being related to its high pore density, which increases the effective surface area and the tendency of the corrosive medium to adsorb and concentrate in these pores.Reference Vladimirov, Krit, Lyudin, Morozova, Rossiiskaya, Suminov and Epel’feld38,Reference Sankara Narayanan, Park and Lee39 Hence, it is not only essential, but also mandatory, to increase the corrosion resistance of such coatings. On the other hand, the stability of the gelatine coating appears to break down with subsequent incubation time leading to swelling, deformation, and eventual delimitation from the alloy surface. Further studies are thus needed to enhance the mechanical properties and the long-term corrosion protection ability of gelatine coatings.
The aim of this study was, thus, to evaluate the corrosion behavior of Mg–9Al–1Zn-based (marked commercially as AZ91 Mg) alloys coated with gelatine (GEL) being stabilized mechanically by cross-linking in situ using noncytotoxic carbodiimide chemistry.Reference Gorgieva and Kokol28,Reference Gorgieva, Strancar and Kokol30 simulated body fluid (SBF) incubation was performed to evaluate the coating process-related improvement of the Mg alloy deterioration rate and its kinetic profile by following the pH studies. The corrosion behavior was also evaluated. Two different electrochemical methods were used for this purpose, i.e., classical potentiodynamic measurement and electrochemical impedance spectroscopy (EIS), while the surface chemistry and morphology were analyzed using Fourier transform infrared (FTIR), X-ray diffraction (XRD) spectroscopy, scanning electron microscopy (SEM) imaging, and energy dispersive X-ray (EDX) analysis. The intermediate processes and the corrosion or anticorrosion mechanism of the GEL-coating are discussed on the basis of the experimental results.
II. MATERIALS AND METHODS
A. Materials
Commercially available AZ91 Mg (Mg–9Al–1Zn) alloys used in the present investigation were composed of wt%, 8.5–9.5% of Al, 0.45–0.9% of Zn, 0.17–0.5% of Mn, 0.05% of Si, 0.04% of Fe, 0.001% of Ni, and 0.015% of Cu. Gelatine (GEL) type B (PI of ∼5, confirmed by potentiometric titration, Mw of 47 ± 32 kDa as determined by Gel Permeation Chromatography), l,1-ethyl-3(3-dimethyl aminopropyl)-1-carbodiimide hydrochloride (EDC), and N-hydroxysuccinimide (NHS), and SBF composition chemicals all purchased from Sigma-Aldrich (Steinheim, Germany) were of analytical grade and used as received, without further purification.
B. Mg alloy preparation
Magnesium alloy was supplied by Exclusive Magnesium Pvt. Ltd., Hyderabad, India. Samples with dimensions of 15 × 15 × 3.5 mm were prepared for the corrosion tests and surface characterization. The specimens were polished with silicon carbide (SiC) abrasive papers (from 600 to 2400 #). After polishing, the samples were cleaned ultrasonically with 99.8 vol% of ethanol, rinsed with distilled water and dried in air before used for further studies.
C. Coating of Mg alloy with GEL
A 10% (w/v) GEL water solution was prepared from GEL powder solubilized under gentle stirring and temperature up to 50 °C, and the final pH of 5.5 by using MES (2-(N-morpholino)ethanesulfonic acid) buffer. The AZ91 Mg alloy was simply dipped in the described solution, taken out, and left for 1 h of gelation (setting) period. For physiological stabilization of GEL coating, carbodiimide chemistry was appliedReference Gorgieva, Štrancar and Kokol40 using EDC with a molar ratio of 2.4/1 with respect to the number of GEL-free NH2 groups, being determined by the UV-Vis spectroscopy as described previously.Reference Gorgieva and Kokol28 The NHS was also added in the fixed EDC/NHS molar ratio of 4/1. After 24 h incubation at room temperature, samples were left to air dry. The thickness of the coating was approximately 40 µm.
D. Immersion tests
The bioresistivity of the specimens was assessed by sample incubation in SBF solution, being prepared according to the protocol suggested by Kokubo et al.Reference Kokubo and Takadama29 The coated and uncoated Mg alloys with dimensions of 15 × 15 × 3.5 mm (total surface of around 6.6 cm2) were submerged into 25 mL of SBF (pH 7.4 ± 0.2) (i.e., surface area to volume ration of around 0.26 cm−1) at 37 ± 0.5 °C up to 30 days. The submerged samples were taken out of the SBF solution, washed gently with distilled water, and dried under ambient conditions. The in vitro corrosion rate was calculated by the following equation: Corrosion rate = K × W/A × T × ρ, where the time conversion coefficient K = 8.76 × 10⁴, W is the weight difference before and after immersion (g), A is the sample area exposed to solution (cm2), T is the exposure time (h), and ρ is the density of the material (g/cm3). The changes in the pH value of the solution were also recorded during the immersion test. The results are presented as means from three separate measurements, including standard deviations (SDs).
E. FTIR spectroscopy analysis
FTIR spectroscopy studies were carried out to identify the GEL presence and its secondary molecular conformation, as well as to identify the potential mineralization resulting from immersion in SBF solution. A Perkin-Elmer IR spectrometer (Kent, UK) was used with a golden gate attenuated total reflection attachment with a diamond crystal. The spectra were accumulated within 16 scans at a resolution of 4 cm−1 within a range of 4000 to 450 cm−1. Fourier self-deconvolution was conducted on FTIR average spectra for the amide I region (1600–1700 cm−1) by applying a resolution enhancement factor of 1.8, which provides information for peaks’ numbers and location. Curve fitting was performed afterward by using Peak Fit. v4.12 program software.
F. SEM and EDX spectroscopy analysis
SEM imaging, coupled with EDX detection system, was performed on the Mg alloys’ top surface before and after the coating process, the same as after the SBF incubation. The samples were mounted using double-sided carbon tape, sputter-coated with gold, and examined with the microscopy equipment (high-vacuum Sirion NC 400 and Zeiss Ultra Plus Wien, Austria) using back-scattered (BSE) modes at different magnifications.
G. XRD spectroscopy analysis
The phase component of the samples was analyzed with XRD, using Xpert-pro equipment with Cu Kα radiation (λ = 1.5406 Å) in a continuous scan mode. The filament current of 30 mA and acceleration voltage of 45 kV were applied. The diffraction angles (2θ) range from 10° to 80° and a scanning speed of 10°/min were used.
H. Electrochemical corrosion behavior
A conventional three-electrode configuration was used for the potentiodynamic polarization studies. All the potentials were measured against a saturated calomel electrode (SCE), and the counter electrode was made from Pt. The SCE was immersed in a Luggin capillary, which was placed as close as possible to the working electrode to minimize the IR drop. The potentiodynamic current potential curves were recorded by changing the electrode potential automatically from −1.7 to 1.1 V (V/SCE) at a scanning rate of 1 mV/s. The SCE was immersed in a Luggin capillary that was placed as close as possible to the working electrode. In all experiments, electrochemical polarization was started 60 min after the working electrode was immersed in solution, to allow the stabilization of the stationary potential. Impedance spectra were obtained at E oc in the frequency range from 100 kHz to 10 mHz, with 10 points per decade and a 10 mV (peak to peak) amplitude of the excitation signal. Nyquist and polarization plots were obtained from the results of these experiments 1 h after the working electrode had been immersed in the solution, to allow stabilization of the stationary potential (three replicate measurements were performed). All the experiments were carried out at 37 ± 0.5 °C. The measurements were performed using the Solartron 1287 Electrochemical interface, and with a Gamry 600™ potentiostat/galvanostat controlled by an electrochemical program, respectively. The test specimens were fixed in a PTFE holder, and the geometric area of the electrode exposed to the electrolyte was 0.785 cm2. Data were collected and analyzed using CorrView, CorrWare, Zplot, and ZView software, developed by Scribner Associates, Inc.
III. RESULTS AND DISCUSSION
A. Coating characterization
The uncross-linked GEL-coating onto the Mg alloy specimen is unstable at physiological temperature due to the characteristic sol–gel temperature transition point of GEL at <35 °C. The water-soluble EDC/NHS mediated zero-length and site-specific cross-linking chemistry was, thus, applied to arrest the structure by forming stable intra- and intermolecular amide (CO–NH) bonds between GEL carboxyl groups (–COOH) in the C-terminals, and available nonprotonated amino (–NH2) groups of Lysine or Arginine residues via an unstable amino-reactive intermediate (O-acylisourea), the mechanism being explained elsewhere.Reference Gorgieva and Kokol41
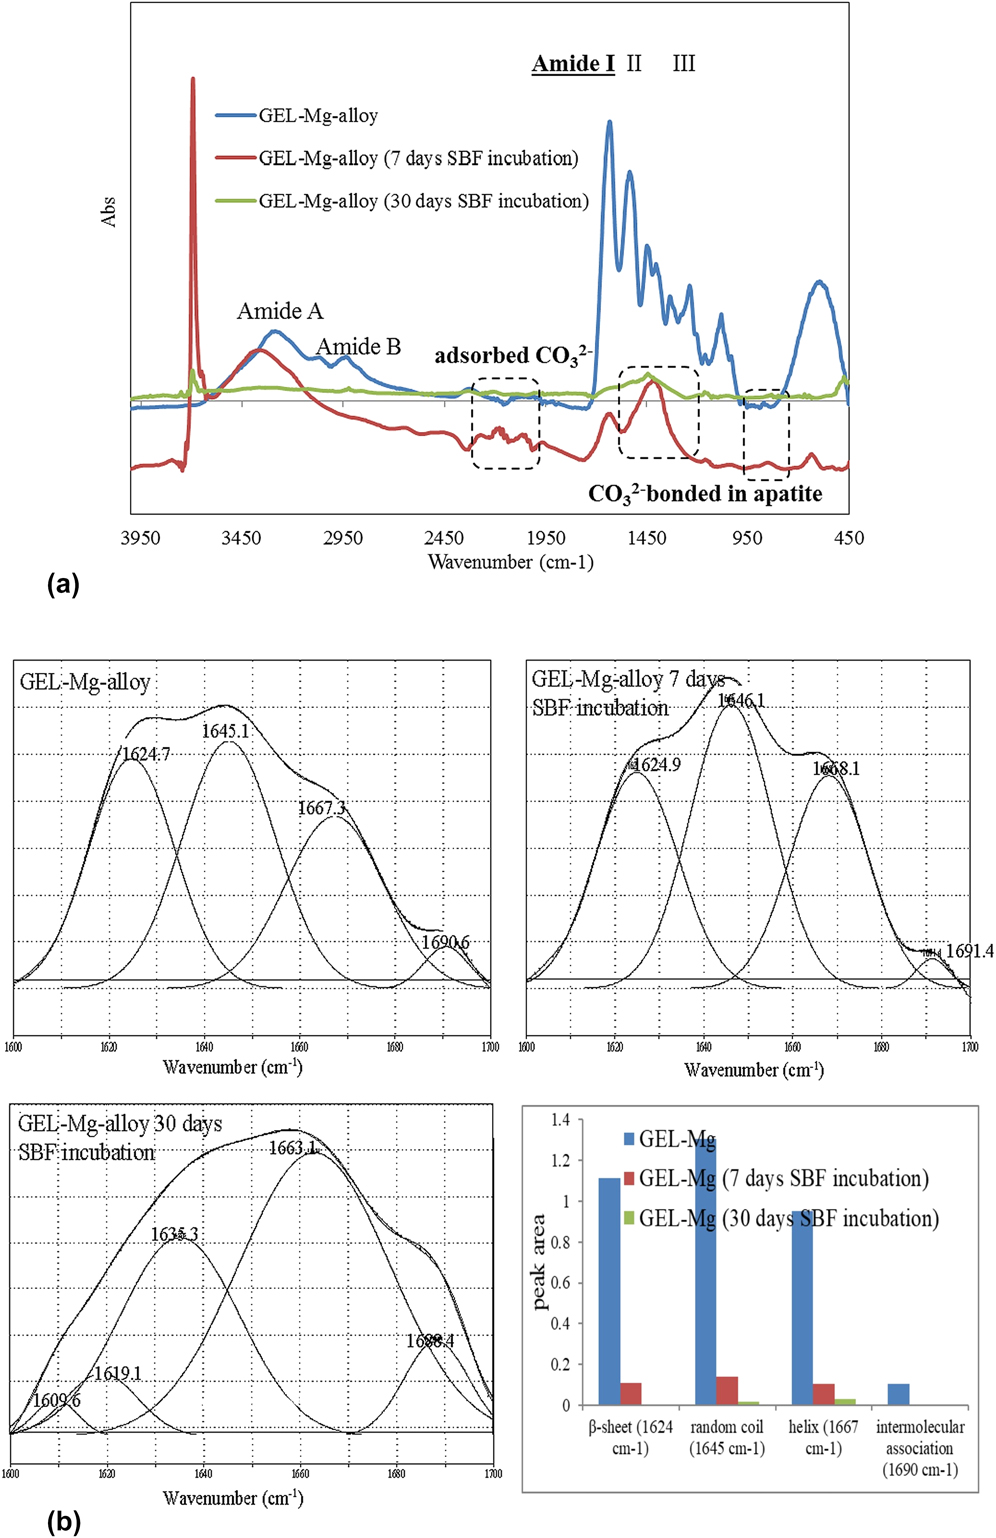
FTIR studies were thus carried out to confirm the presence of a GEL coating on the Mg alloy surface, its secondary conformation, as well as to identify the potential mineralization resulting from immersion in SBF media. The FTIR spectra [Fig. 1(a)] of GEL-coated Mg alloy showed a broad absorption band in the region between 3200 and 3100 cm−1, which is attributed to amide-A stretching within the GEL molecule. The signals at about 1645, 1539, and 1236 cm−1 were attributed to the amide I, II, and III groups, respectively, and all presenting a typical protein fingerprint. The detailed observation of deconvoluted amide I [Fig. 1(b)], as the most useful IR indicator for the secondary protein structure, revealed four bands, with frequencies centered at around 1624, 1645, 1667, and 1690 cm−1, assigned to β-sheet, random coil, polyproline (II-type) helix conformation and intermolecular associations, respectively.Reference Muyonga, Cole and Duodu42 However, the quantified peak areas [Fig. 1(b), inserted values] demonstrated the domination of random coil conformation in both cases. Based on our previous study,Reference Gorgieva, Strancar and Kokol30 the random coil GEL conformation was adapted during the casting process. Indeed, the completion of the gelation process to the equilibrium involves monomer aggregation, coil-single-helix transition, and single helix–triple-helix transition, so that this process may take several weeks. However, as the casting process in this study was limited related to the initial gelation process that occurred in the first hour after dipping within the GEL solution, it resulted in a dominant random coil conformation which allowed maximal exposure of the cell recognition amino-acid sequences (i.e., Arginine–Glycine–Aspartates, RGD), and may, thus, be valuable for primary cell response during biomedical application. Moreover, the 10-fold area reduction for all bands after SBF incubation, along with the newly appearing carbonate (CO32−)-related bands [Fig. 1(a)], indicates the progress of the mineralization process. As reported in our previous study,Reference Reddy Tiyyagura, Rudolf, Gorgieva, Fuchs-Godec, Rao Boyapati, Mohan Mantravadi and Kokol19 the presence of carbonate-related vibration may be due to direct adsorption (2000–2300 cm−1 region), or may be attributed to apatite presence by being bonded with PO43−.Reference Berzina-Cimdina and Borodajenko43 However, clear evidence for the presence of PO43− vibration (bands at 1049 and 1033 cm−1) is missing, due to its overlapping with GEL spectra, as well as the presence of a thick carbonate layer.Reference Rettig and Virtanen44 These results may also indicate the formation of an amorphous, nonstoichiometric type apatite, being already well describedReference Gopi, Bhalaji, Ramya and Kavitha46 as a pre-step-in HAp formation. Only traces of GEL molecules, generally in a random coil and helix conformation, were found on the GEL-coated alloy surface after 30 days of incubation; their retention was probably the consequence of extensive inter- and intramolecular interactions with the Mg surface, as well as amide cross-linking of GEL provided by the EDC/NHS chemistry.
(a) FTIR absorbance spectra of the GEL-coated AZ91 Mg alloy before and after incubation in SBF (pH of 7.4 ± 0.2) at 37 ± 0.5 °C for 7 and 30 days, and (b) deconvoluted amide I (1600–1700 cm−1) region of the respective samples with inserted histogram containing deconvolution data.

It was also ascertained that such a structure should still possess both negative- and positive-rich segments under physiological conditions (pH ≈ 7.4), where amino groups are protonated and positively charged, whereas carboxylic groups are deprotonated and negatively charged—which remains free after the GEL macromolecule cross-linking and interactions with the Mg alloy surface, and thus is available for interactions with the SBF ions.
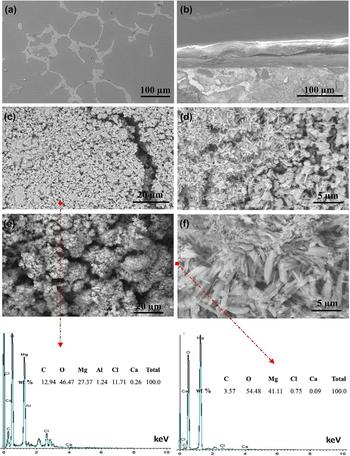
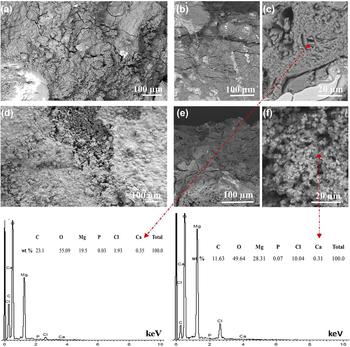
Apatite formation in the SBF solution has been recorded widely as a quick and convenient way to predict bioactivity of biomaterials in vitro. Recent literature explains the formation of apatite and the corrosion layers on the AZ91 Mg alloys in the SBF solution.Reference Wong, Zhao, Tam, Wu, Chu, Zheng, To, Leung, Luk, Cheung and Yeung45–Reference Mukhametkaliyev, Surmeneva, Vladescu, Cotrut, Braic, Dinu, Vranceanu, Pana, Mueller and Surmenev47 Figures 2 and 3 show the FE-SEM images of uncoated and GEL-coated AZ91 alloy—surfaces and cross-sections—before and after 7 and 30 days of incubation in SBF solution, respectively, with inserted EDS analysis for selected ones. The uncoated AZ91 alloy surface was getting covered with small flower-shaped corrosion products after incubation for 7 days [Figs. 2(c) and 2(d)], and also a crack was observed on the alloy. In the case of GEL-coated alloy [Figs. 2(e) and 2(f)], spongy and plate-like structures were identified on the entire surface of the alloy with uniform distribution, which can be favored by the orientation and conformation of the predeposited 40.9-µm thick layer of GEL macromolecules on the alloy surface and their interactions.Reference Yang, Jiang, Yu, Wen, Li, Suna and Houa31 The formed corrosion products consisted mainly of Mg, C, O, and Cl, with small amounts of Ca, in both the uncoated and coated alloys, confirming the presence of an oxide layer and the formation of carbonates on the surface. These results are in good agreement with the FTIR results for the formation of carbonates and oxide layers on the surface. After 30 days of incubation in SBF solution (Fig. 3), several cracks are observed on the surface of the uncoated alloy with white precipitates, while uniformly distributed white and gray corrosion layers were observed on the GEL-coated alloy on both the surface and the cross-section, the formed corrosion products being similar to that of after 7 days. While a relatively small amount of Ca was detected in both uncoated and GEL-coated samples after 7 days of incubation (Fig. 2, EDS analysis), P was also identified after 30 days (Fig. 3), implying time-progression of the probable apatite layer formation, as already reported by Mukhametkaliyev et al.Reference Mukhametkaliyev, Surmeneva, Vladescu, Cotrut, Braic, Dinu, Vranceanu, Pana, Mueller and Surmenev47
FE-SEM images of the uncoated AZ91 Mg alloy: (a) Surface and (b) cross-section before incubation; the surfaces of (c and d) uncoated and (e and f) GEL-coated AZ91 Mg alloys after incubation in SBF solution (pH of 7.4 ± 0.2) at 37 ± 0.5 °C for 7 days, with inserted EDS analyses at locations of selected images.

FE-SEM images of (a) the uncoated AZ91 Mg alloy surface and (b and c) cross-section, and (d) the GEL-coated AZ91 Mg alloy surface and (e and f) cross-section after incubation in SBF solution (pH of 7.4 ± 0.2) at 37 ± 0.5 °C for 30 days, with inserted EDS analysis at locations of selected images.

These results demonstrated that the GEL-coating retards the degradation of the Mg alloy and forms the thick surface layer, which improves the corrosion resistance of the alloy. The calculated corrosion rates are 2.08 and 1.19 mm/year for the uncoated and GEL-coated alloys, respectively, indicating that the corrosion rate may be controlled by the GEL layer. It can be concluded that the AZ91 coated with GEL has a better corrosion resistance than the uncoated sample, also leading to a bio-safer, alkaline environment and, thus, could lead to a faster healing process at the implantation site. Indeed, provided alkalinity can ultimately have a buffering effect on local metabolic H+ ions, i.e., acidosis condition, which is a direct stimulator for osteoclasts-mediated bone resorption.Reference Arnett48
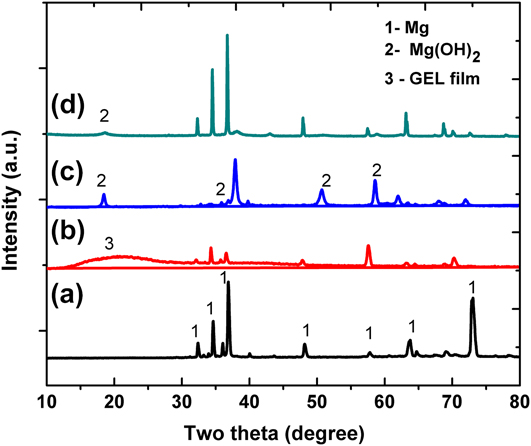
Figure 4 shows the XRD patterns of uncoated and GEL-coated alloys before and after incubation for 30 days in SBF solution. The presented data confirm that the high intensity peaks at 34.4°, 36.6°, 47.8°, 63.4°, and 72° (peak designation 1) are corresponding to the structure of Mg crystal planes (JCPDS card no. 35-0821). The broad peak around 20° confirmed the presence of GEL (peak designation 3),Reference Karthika, Kavitha, Surendiran, Kannan and Gopi32 while the peaks at 18.5°, 32.5°, 50.5°, and 58.5° (peak designation 2) are corresponding to Mg(OH)2 (JCPDS card no. 044-1482), which confirms the presence of an Mg oxide layer on the surface. Taking into account the normalization of peaks’ intensities, the obvious GEL presence before SBF incubation is demonstrated with broad peaks, indicative of high amorphous content, which correlates with the missing 2θ peak at 7.8°, being ascribedReference Sarker, Papageorgiou, Silva, Zehnder, Gul-E-Noor, Bertmer, Kaschta, Chrissafis, Detsch and Boccaccini49 to the triple-helical crystalline structure of collagen renaturation in GEL. Such evidence supports the FTIR findings for dominant random coil (amorphous) conformation within the coating. However, the mineral phase dominates after 30 days of incubation, varnishing the GEL-related spectral features significantly. Interestingly, in addition, the XRD spectra did not provide direct evidence for calcium phosphate related minerals’ formation, probably due to their very limited amount relative to the Mg and Mg (OH)2 products.
XRD patterns of (a) uncoated and (b) GEL-coated AZ91 Mg alloys before incubation, and (c) uncoated and (d) GEL-coated AZ91 Mg alloys after incubation in SBF solution (pH of 7.4 ± 0.2) at 37 ± 0.5 °C for 30 days.

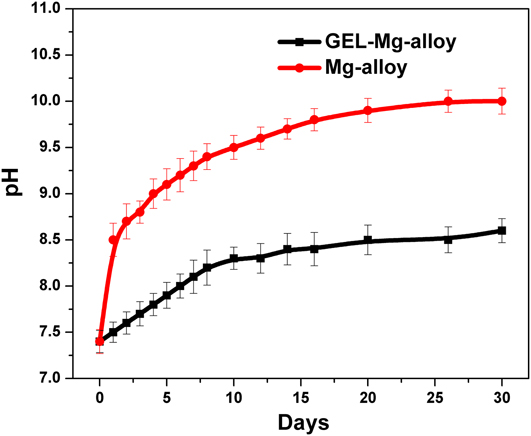
The variations of SBF solutions’ pH value at different immersion times are presented in Fig. 5. The uncoated alloy showed much higher pH values during the whole time of incubation compared to the GEL-coated Mg alloy. Furthermore, the pH values of the solution for uncoated and coated alloys increased with different slopes with increasing immersion duration. After 30 days of immersion, the uncoated sample reached the value of about pH 10, while that of the GEL-coated alloy was about pH 8.3, indicating the kinetically faster degradation rate of the uncoated Mg alloy. Indeed, the process of minerals’ precipitation within the SBF solution is kinetically faster at higher pH, meaning that at a lower pH the mineralization is slower, and likely to occur at nucleation sites present on the material/SBF interface, rather than the SBF solution itself. Such a process is expected to guide the mineralization process toward HAp-like minerals’ formation.
Change of SBF solution pH values with immersed uncoated and GEL-coated AZ91 Mg alloys at 37 ± 0.5 °C for 30 days. The results are presented as means from three separate measurements ± SD.

During immersion, the Mg dissolved and combined with OH, leading to the formation of Mg(OH)2, which was confirmed by the FTIR and XRD studies. In the case of the GEL-coated sample, the GEL layer suppressed the dissolution of the Mg and accelerated the formation of the thick oxide layer interfacing with the SBF solution.
B. Electrochemical corrosion behavior
1. Potentiodynamic polarization, PDP curves
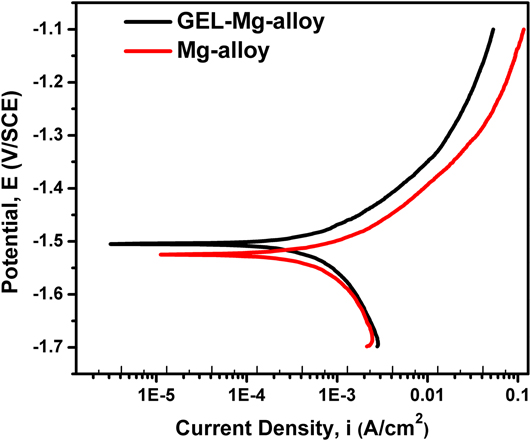
The effect of the GEL-coated Mg and uncoated Mg alloys on the current–potential characteristics, as given by the polarization curves within the SBF solution, is presented in Fig. 6. The electrochemical parameters obtained from the polarization curves, corrosion potential (E corr), corrosion current density (i corr), polarization resistance (R p), anodic Tafel slopes (b a), cathodic Tafel slopes (b c), and the corrosion rate (r) are shown in Table I. The polarization resistance was obtained from linear polarization within the potential range of ±20 mV with respect to E corr. Extrapolation of the Tafel line allowed us to determine the corrosion current density i corr. All the parameters were determined simultaneously by CorrView software.
Potentiodynamic polarization curves of uncoated and GEL-coated AZ91 Mg alloys tested in SBF solution (pH of 7.4 ± 0.2) at 37 ± 0.5 °C for 1 h.

Electrochemical parameters of uncoated and GEL-coated AZ91 Mg alloys.

A comparison of curves shows that, with respect to the blank (uncoated Mg alloy), a noticeable reduction of the cathodic current density was achieved for the coated alloy. Furthermore, the reduction of the corrosion current density i corr is approximately a quarter of the order of magnitude with respect to the uncoated Mg alloys, indicating a reduction of corrosion rate for the GEL-coated alloy. The corrosion rate was calculated according to Eq. (1):
 $$R = 3.27 \times {i_{{\rm{corr}}}} \times \left( {{{{E_{\rm{w}}}} / \rho }} \right)\quad ,$$
where r is the corrosion rate (in mm/year), i corr is the corrosion current (in μA cm2), E w is the equivalent weight or atomic weight, and ρ is a density of material.
It can be seen that the electrochemical corrosion rate of GEL-coated Mg and uncoated Mg alloys was much higher than that measured by the gravimetric method (measured after 7 days). The electrochemical corrosion rate measures the corrosion rate of the Mg-sample at time zero (approximately 60 min after the start), whereas the gravimetric corrosion rate measures the average corrosion rate for the exposure period. The gravimetric corrosion rate is changing continuously with time and reaches a steady state after 30–40 days, while the electrochemical method measures the maximum initial corrosion rate. With time, corrosion products accumulate on the surface of the sample specimen, which reduces the corrosion rate of the specimen progressively in the case of the gravimetric method (the obtained difference between corrosion rates is acceptable). From the potentiodynamic polarization curves, a fairly negative corrosion potential (E corr) for uncoated Mg alloy in SBF E corr = −1.53 V versus SCE can also be seen, which was shifted to about −1.50 V versus the SCE for the GEL-coated alloy. This minimal shift in the corrosion potential (versus SCE) indicates that the protective layer (GEL-coated alloy) acted by merely blocking the reaction sites of the surface without changing the anodic and cathodic reaction mechanisms.
2. EIS measurements
EIS is a powerful technique that can be used to study corrosion of metals or coated alloys. It can provide quantitative evaluation of the corrosion properties of the system that would have been difficult using conventional electrochemical measurements, such as potentiostatic or potentiodynamic techniques. By appropriate interpretation of the EIS data based on an equivalent electric circuit (model), the detailed information on the corrosion process at the electrolyte/electrode interface can be revealed. This technique works in the frequency domain and is based on the concept that an interface can be seen as a combination of passive electrical circuit elements, i.e., resistance, capacitance, and inductance. Moreover, it provides a rapid and convenient technique to evaluate the performance of organic coated metals. The coating system’s resistance generally degrades with time. This degradation is associated with ion and water penetration into the coating, and the subsequent electrochemical (corrosion) reaction at the coating/metal interface. It is well-known that the impedance spectra can be divided into three different parts: The high-frequency (HF) part represents the properties of the coating, the second segment is approximately within the middle frequency region, and the low-frequency (LF) part represents the reactions occurring at the bottom of the pores of the coating, or on the interfacial Mg oxide/hydroxide layer underneath the coating. For a metal covered by a polymer coating exposed to a corrosive solution, the resistance at the LF limit (10−2 Hz) obtained from the EIS measurement is often attributed to the resistive property of the coating, where a higher value means a more insulating coating (i.e., more effective barrier).
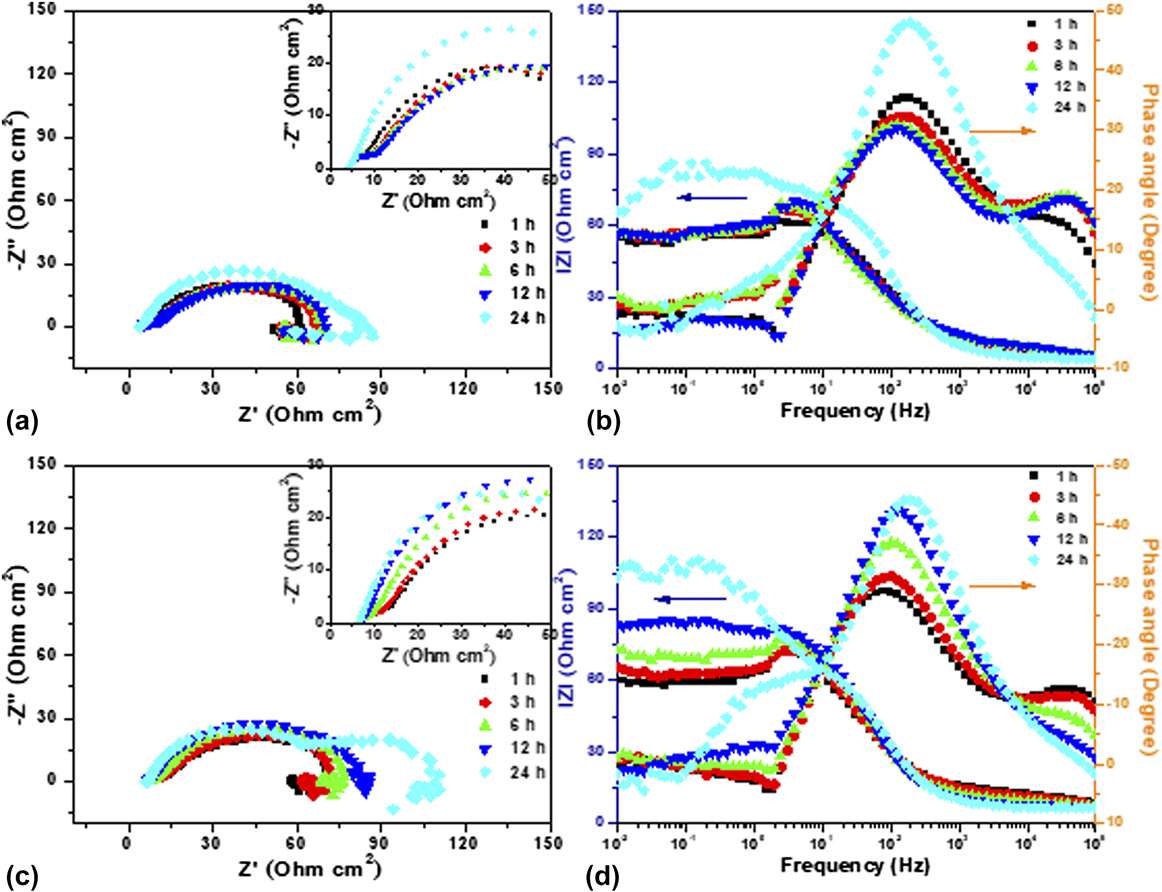
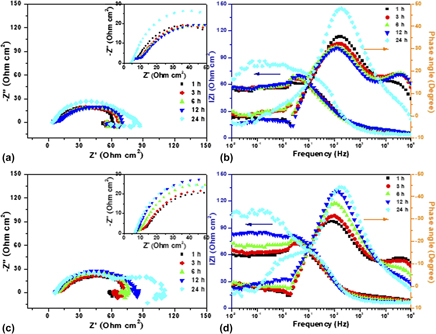
EIS studies as a nondestructive electrochemical technique were thus carried out for the uncoated and GEL-coated AZ91 Mg alloys as a function of immersion time in SBF solution to extract more information on their electrochemical corrosion behavior. The representative EIS spectra acquired from the AZ91 Mg alloys (untreated and coated alloys) as a function of immersion time is displayed in Fig. 7, where Figs. 7(a) and 7(b) represent the EIS Nyquist and Bode plots of uncoated, and Figs. 7(c) and 7(d) for the GEL-coated and AZ91 Mg alloys during 24 h of exposure.
Nyquist and Bode plots of (a and b) uncoated and (c and d) GEL-coated AZ91 Mg alloys as a function of time (1–24 h) in SBF solution (pH of 7.4 ± 0.2) at 37 ± 0.5 °C.

As can be seen from the Nyquist plots of the uncoated alloy [Fig. 7(a)], each of them consists of a capacitive loop, along with an inductive loop at the LF region. Interestingly, the GEL-coated alloy consisted of two capacitive loops (in the case of the 24 h test) and an inductive loop. The HF loop is attributed to the charge transfer between the alloy coating/electrolyte interfaces. The capacitive loop that appeared at the middle frequency region is attributed to the charge transfer process at the GEL-coating/alloy substrate interface of the coated alloy, and at the alloy substrate/electrolyte interface for uncoated alloy, respectively. While the shape and diameter of the capacitive loops indicate the corrosion process at the alloy/electrolyte interface, its change in diameter indicates the charge transfer-resistance. Furthermore, the middle-frequency loop diameter of the GEL-coated Mg alloy is relatively higher [Fig. 7(c)] than that of the uncoated alloy [Fig. 7(a)], indicating that the deposited GEL layer protected the underneath metal from the corrosion.
When the Mg alloy is exposed to the corrosion medium, chemical dissolution, together with electrolyte penetration, results in spontaneous corrosion on the entire surface, resulting in the formation of corrosion products. Therefore, the appearance of an inductive loop at the LF region can be attributed mainly to the adsorption of aggressive ions and severe localized attack of the Mg substrate. Usually, the LF region conveys important information about the electrode control process, as well as the contribution from localized defects to the overall impedance.Reference Baril, Blanc and Pébère50,Reference King, Birbilis and Scully51
It can also be seen from the figures that the diameter of the capacitive loop increased as the immersion duration was increased for uncoated, as well as the GEL-coated Mg alloy, indicating that the corrosion product formed on the surface in the SBF solution improved their corrosion resistance. In particular, the diameter of the capacitive loop was relatively high for the GEL-coated alloy compared with that of the uncoated alloy, which confirmed the effectiveness of the GEL coatings. The precipitation of carbonated calcium phosphate compounds and oxide layers (Figs. 2 and 3) onto the alloy surface could be the reason for the improved corrosion resistance.
Bode plots (Phase angle versus Frequency and IZI versus Frequency) of uncoated and GEL-coated AZ91 Mg alloys in SBF solution with varying exposure time are represented in Figs. 7(b) and 7(d), respectively. As may be seen from the plots, the phase angle maxima at about 102 Hz for the uncoated alloy slightly decreases as the exposure duration is increased up to 12 h and is getting further increased after 24 h of incubation. It can be presumed that as the exposure duration increased, the surface layer becomes weak for the uncoated alloy and the electrolyte penetrates easily through the layer, thereby accelerating the Mg ions’ dissolution. In addition to that, the corrosion rate increases when the precipitation rate of calcium phosphate ions is slower than the Mg dissolution rate. Hence, the capacitive behavior may last until severe damage in the surface layer has occurred. Decrease in phase angle maxima is one of the key parameters attributable to the degradation behavior. By contrast, in the case of GEL-coated alloy, the phase angle maxima was increasing as the exposure duration was increased, which confirms the capacitive behavior of the GEL-coating. It can be seen from the impedance magnitude at LF of Bode plots, that the IZI value increases as the exposure duration is increased, confirming the barrier behavior of the GEL-coatings. The deposition of calcium phosphate compounds from the SBF solution onto the GEL-layer further contributes to the increase of impedance values. It is understood from the results that the corrosion progress of the GEL-coated alloy is slow, thus allowing the precipitation of calcium phosphate compounds on the surface, which controls the penetration of aggressive ions to the substrate. However, a significant increase in IZI was not noticed up to 12 h for the uncoated alloy, and a marginal increase was noticed at 24 h, confirming that the corrosion product forming on the surface is not effective to control the corrosive ion penetration as in the case of GEL-coated alloy.
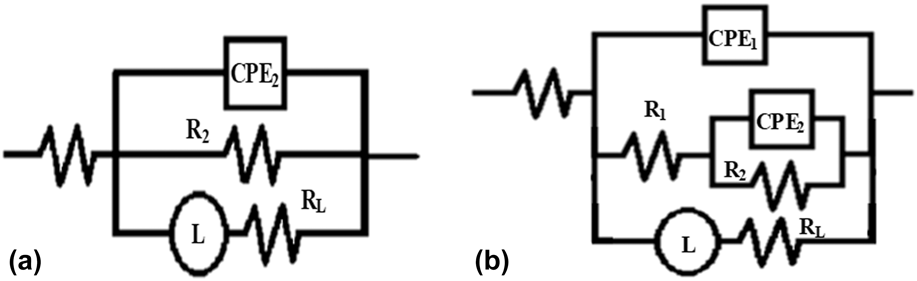
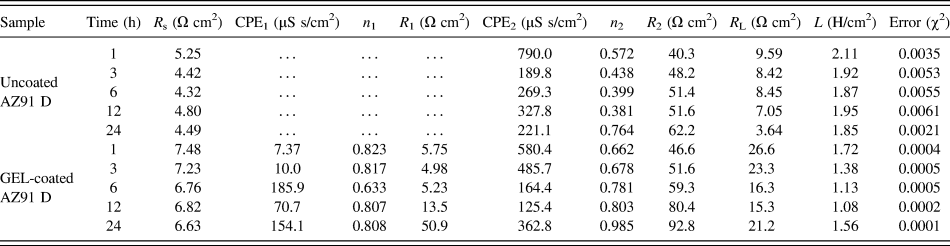
The fitting of experimental impedance spectra using the appropriate equivalent electric circuit (EEC) was applied further for better understanding the mechanisms of the corrosive processes which occurred at the surface of the samples studied. The impedance spectra in Fig. 7 were fitted with the EEC model using a combination of resistance (R), constant phase element (CPE), and inductance (L) in series with R s, as given in Fig. 8. The suggested models have the least error and the chi–square value (χ2), around 0.005 or less. The value of R s includes any ohmic resistance between the electrode surface and the reference electrode. The CPE was used in the equivalent circuits instead of the ideal electrical capacitance. This element describes the behavior of those coatings better, having heterogeneities within their microstructures. Impedance of CPE can be represented as Z CPE = Y 0−1(jω)−n, where Y 0 is the admittance, ω is the angular frequency, and n is an exponent of CPE. When n = 1 describes the ideal capacitor, while n = 0 pure resistor and n = 0.5 the Warburg element, in a real system, n values are observed between 0 and 1.Reference Hsu and Mansfeld52
Equivalent circuits used for curve fitting of obtained EIS results: (a) Uncoated and (b) GEL-coated AZ91 alloys (R s—solution resistance, R 1—electrolytic diffusion resistance, R 2—charge transfer resistance, CPE1/CPE2—CPEs of the newly formed layer/double layer capacitance, R L—inductive resistance, and L—inductance).

EEC consisted mainly of two-time constants, along with the inductive behavior for the coated alloy [Fig. 8(b)], and the uncoated alloy consisted of a single time constant with an inductive behavior [Fig. 8(a)].Reference Chen, Chen, Zhang, Zhao, Wang, Mao, Li, Zhao, Huanga and Wan53,Reference Lin, Hung, Jakfar and Yeh54 In other words, the surface states of the untreated and GEL-coated Mg alloy are greatly different from the physicochemical point of view, so two different models are used to fit the impedance spectra. In the EEC of the uncoated Mg-alloy, R 2 means the charge transfer resistance, CPE2 is the CPE of the electrical double layer, and R s is the solution resistance. The R 2 value is indicative of total corrosion resistance performance. The EEC of the untreated Mg alloy also includes the inductance resistance (R L) and the inductance (L) [Fig. 8(a)]. The Nyquist plots for the GEL-coated Mg alloy [Fig. 8(b)] were analyzed as follows: R 1 and CPE1 were applied to describe the properties of the GEL coating; the characterizations of the double layer were described the same as in the case mentioned above, i.e., by R 2 and CPE2 with including inductance resistance (R L) and the inductance (L) in parallel with it.
The experimental and fitted plots that are given in Fig. S1 of the Supplementary Material document show that the fitted values are in good agreement with that of the experimental results. The fitting parameters are summarized in Table II. As can be seen from the table, the R 1 values of the GEL-coated Mg alloy, which is attributed to the presence of GEL coating, were increased gradually as the exposure duration was increased. Moreover, the GEL-coated alloy exhibited higher R 1 after 24 h of incubation, due to the formation of the corrosion product layer consisting mainly of calcium phosphate compounds. CPE1 values were also minimal, and increased slightly with increasing time, which is attributed to the intake of the corrosive solution in the surface layer. The values that were obtained for R 1 and CPE1 provided information about the barrier properties of the GEL layer. As the R 1 value increased, with marginal change in CPE1 values as the immersion duration was increased, it indicates the barrier property of the GEL coating.Reference Córdoba, Montemor and Coradin55 The precipitation of calcium phosphate compounds also contributed to the improved corrosion resistance. The R 2 and CPE2 depict the charge transfer process at the interface layer. Increase in R 1 and R 2 values of the GEL-coated alloy indicated the improved corrosion resistance, and these results are in good agreement with the lower corrosion current densities (i corr) achieved in potentiodynamic polarization studies after 1 h (Table I). The stable surface GEL layer existing on the alloy surface effectively controls the penetration of aggressive ions, which is confirmed from the decrease of anodic and cathodic current densities in the polarization plots. Decrease of CPE values of GEL-coated alloys were also confirming the capacitive behavior and improved protection performance. Furthermore, corrosion rates measured from the weight loss method were found to be 2.08 and 1.19 mm/year, and these results also substantiated the EIS results.
Equivalent circuit parameters of uncoated and GEL-coated AZ91 alloys.

Furthermore, a gradual increase in R 2 value was noticed for the uncoated and GEL-coated alloys, indicating the higher charge transfer resistance. Besides, the GEL-coated alloy exhibited higher R 2 values, indicating its better charge transfer resistance in SBF solution. CPE2 values in both cases were also decreased with immersion time and are consistent with the R 2 values. These results indicate that the formed surface layer protected the underneath Mg alloy from corrosion. The R L and L values can be attributed to the inductive behavior of the uncoated and GEL-coated alloys. In the case of the uncoated alloy, the decrease in R L and L values was noticed up to 6 h, and a further increasing trend was noticed, which was attributed to the degradation of Mg. However, the GEL-coated alloy exhibited an opposite trend in R L and L values. It can be noted from Fig. S1 in the Supplementary Material document that the characteristic frequencies of the inductive loop diminish after 12 h of incubation, and another capacitive loop appeared, confirming the extended corrosion protection of the GEL coating in SBF solution.
IV. CONCLUSION
In situ cross-linking of gelatine (GEL) coating by carbodiimide chemistry was applied successfully on the surface of the Mg–9Al–1Zn-based (AZ91) Mg alloy by a dip-coating technique. The presence of GEL with dominant random coil conformation was confirmed by the FTIR spectroscopy and XRD studies, while SEM imaging depicts complete and uniform surface coverage and the formation of spongy, flower-like carbonate containing mineral structures after 30 days of immersion in SBF solution. Moreover, an extended (from 2.08 to 1.19 mm/year) corrosion protection of the GEL-coated AZ91 Mg alloy in SBF solution was confirmed by electrochemical studies, which also provided a bio-safer pH environment (pH 8.3) for potential in vivo application. The proposed GEL coating also implied an initiating phase of apatite layer formation, being guided by the GEL macromolecules’ orientation and conformation on the alloy surface and their interactions with Ca and P ions, which is expected to minimize the alloy resorption and, additionally, evoke positive biocompatibility impact in bone tissue regeneration applications.
Supplementary Material
To view supplementary material for this article, please visit https://doi.org/10.1557/jmr.2018.65.
ACKNOWLEDGMENT
This work was supported financially by the Erasmus Mundus Grant no. EMA2-2013-2540/001-001-EM-EUPHRATES.