NOMENCLATURE
- b
elastic strain vector
- c
chord length
- C n
Courant number
- F x
external forces
- I k
kinetic energy diffusivity
- I ω
specific rate diffusivity
- j
mass flux
- K
elasticity
- L
length of wing
- p
pressure
- S
elasticity
- Re
Reynolds number
- t
time
- v,
flow velocity
- V a
velocity magnitude
- X k
is turbulence kinetic energy generation by velocity gradient
- X ω
specific rate generation by velocity gradient
- Y k
external forces source terms for kinetic energy
- Y ω
external forces source terms for specific rate
- y +
dimensionless wall distance
Greek symbols
- Δt
time step
- Δx
mesh node interval
 $\theta$h
heave angle
- $\theta$p
pitch angle
- $\theta$p_initial
initial pitch angle
- $\theta$s
stroke angle
- $\rho$
density
- σ n
stress vector (n = x, y, z, xy, yz, xz)
- τ
stress tensor
- ∇
divergence


1.0 INTRODUCTION
Humans have always wanted to fly like a bird. However, until recently, advancements in aviation technologies have mainly matured through rigid-wing heavier-than-air aircraft where an external thrust is provided to induce relative wind on aerofoils and subsequently generate lift, as illustrated in Raymer.(Reference Raymer1) Due to the complexity of flapping-wing mechanisms, they may not be practical for application on a large scale, such as in the aviation industry. Even on a small scale, there are problems and challenges which need to be addressed to perform different flight manoeuvres such as hover and cruise flight, as described by Platzer et al.(Reference Platzer, Jones, Young and Lai2) Thus, flapping-wing mechanisms are only applied mainly on a smaller scale currently, for example in micro aerial vehicles (MAV).
Flapping-wing mechanisms generally rely on the kinematics of wings as inspired by insects or birds, but driven by mechanical parts, as illustrated in Abas et al.(Reference Bin Abas, Bin Mohd Rafie, Bin Yusoff and Bin Ahmad3) There are few such wing motion for cruise flight, for example the flapping wings described by Mazaheri and Ebrahimi,(Reference Mazaheri and Ebrahimi4) where a simple four-bar crank rocker is used to translate rotation into the one-dimensional harmonic flapping motion of the wings with a flexible membrane. Their experimental results showed that increasing the flapping frequency results in greater thrust. The lift could be increased by increasing the wind speed and angle-of-attack of the wings. Another type of wing motion is the pitch–plunge wing motion inspired by the dragonfly, which utilises rigid corrugated wings in tandem, as illustrated by Lian et al.(Reference Lian, Broering, Hord and Prater5) The pitching of the rigid corrugated wings allows the adjustment of the angle-of-attack against the relative wind due to the wing motion, which results in the generation of lift. The variation of the flapping phase angles of the fore and hind wings encourages interaction between their wake, resulting in efficient hover and forward flight motion. Another wing motion is the clap–fling type inspired by insects such as butterflies, as described by Shyy et al.(Reference Shyy, Aono, Chimakurthi, Trizila, Kang, Cesnik and Liu6) The clap–fling motion flings open the two wings after clapping them together. This motion can generate additional lift while flinging by creating air circulation around the wing. The advantage of clap–fling motion is a power reduction while increasing the lift performance. A more complex wing motion inspired by insects such as the dragonfly and hoverfly is the figure-of-eight motion, as reported by Sun and Shi(Reference Sun and Lan7) and Mou et al.(Reference Mou, Liu and Sun8) The figure-of-eight motion consists of three sub-motions, viz. stroking, pitching, and heaving (stroke deviation). The combination of these three sub-motions results in the figure-of-eight motion that allows hover flight for dragonflies and hoverflies.
The abovementioned flight motions can be generated using the wings of a MAV by a combination of mechanical movements. A few mechanical systems have been designed to generate figure-of-eight flapping motion, including the planar four-bar mechanism of Zbikowski et al.,(Reference Zbikowski, Galiński and Pedersen9) the spherical double Scotch yoke of Galinski and Zbikowski,(Reference GaliŃski and Zbikowski10) the one-degree-of-freedom out-of-stroke plane five-bar mechanism of Banala and Agrawal,(Reference Banala and Agrawal11) and the spherical four-bar mechanisms of Rehmat(Reference Rehmat12) and Rehmat et al.(Reference Rehmat, Lee, Trabia, Roll and Yim13) The planar four-bar mechanism can draw the pathway of the figure-of-eight wing motion on a plane. The mentioned planar four-bar mechanism can be enhanced by reconfiguring the links (to form a spherical double Scotch yoke), converting the flapping motion into a spherical figure-of-eight motion. The one-degree-of-freedom out-of-stroke plane five-bar mechanism can apply varying twists on the flapping motion. The spherical four-bar mechanism adopts the same concept as the planar four-bar mechanism, with the difference that all the links are in an arc shape, which converts the planar figure-of-eight motion into spherical figure-of-eight motion. The figure-of-eight motion derived from this spherical four-bar mechanism is investigated in this study.
Together with the development of advanced computers, Computational Fluid Dynamics (CFD) has often been used to simulate the fluid flow behaviour in many research works.(Reference Pourtousi, Ganesan, Sandaran and Sahu14–Reference Behroyan, Ganesan, He and Sivasankaran16) Frunzulica et al.(Reference Frunzulica, Dumitrache and Stoia-Desjka17) investigated the potential for using flapping-wing motion to harvest wind energy by using CFD Fluent. Coupled with Computational Structural Dynamics (CSD), Fluid–Structure Interactions (FSI) simulations have become popular for predicting the flapping-wing motions of insects. Dowell and Hall(Reference Dowell and Hall18) discussed the various kinds of physical models of unsteady fluid motions as well as nonlinear and linear models. Various methods such as harmonic balance, time marching and systems identification were discussed in ref. (Reference Dowell and Hall18) as well. Dowell and Hall(Reference Dowell and Hall18) presented the development of a reduced-order model based on the expansion of fluid modes and also extended the treatment of the modal character of time-dependent flows in their study. Sotiropoulos and Yang(Reference Sotiropoulos and Yang19) reviewed various existing fundamentals and solution algorithms applied in FSI simulations. A discussion on the dynamic immersed boundary as well as strong and loose FSI coupling was presented by Sotiropoulos and Yang,(Reference Sotiropoulos and Yang19) which involved solving the incompressible fluid flow equations, namely the Navier–Stokes equations. Applications of the mentioned methods on various FSI problems such as flying insects and vibrations were also discussed by Sotiropoulos and Yang.(Reference Sotiropoulos and Yang19) A very good example of applying FSI to solve problems is presented by Wang et al.,(Reference Wang, Avital, Bai, Ji, Xu, Williams and Munjiza20) where the immersed boundary method was used to connect finite-volume fluid and finite-element solid solvers in an effort to solve the FSI of turbine blades and submerged vegetation. The FSI results presented by Wang et al.(Reference Wang, Avital, Bai, Ji, Xu, Williams and Munjiza20) revealed the effect of the flexibility of vegetation stems on the fluid flow as well as the effect of blade flexibility on the performance of a turbine. FSI also plays a significant role in flapping-wing research, where it has mainly been used to predict flight performance and analyse the fluid and structural dynamics during flapping motion. Wang et al.(Reference Wang, Goosen and van Keulen21) presented an FSI model to optimise a twistable flapping wing, consisting of a quasi-steady aerodynamic model as well as an analytical twist model. The authors claimed that their proposed FSI model is efficient and can be used for the optimisation and parametric study of flapping wings. Shahzad et al.(Reference Shahzad, Tian, Young and Lai22) investigated the effect of the flexibility of wings with different shapes and aspect ratios on the performance during hover flight. The FSI model used by Shahzad et al.(Reference Shahzad, Tian, Young and Lai22) consists of an interface immersed boundary (IBM) solver and finite elements with discrete Kirchhoff triangular (DKT) plate elements for the structural solver. Nakata and Liu(Reference Nakata and Liu23) conducted an FSI study on the hover flight motion of a hawkmoth, considering the flexibility of the wings as well as the morphology. The FSI predictions showed that the flexibility of the insect wings is crucial for improving their flight performance. A Three-Dimensional (3D) FSI simulation of a rectangular wing in hover flight was conducted by Dai et al.(Reference Dai, Luo and Doyle24) Parameters such as the stiffness, pitching phase angle, Reynolds number and mass ratio were investigated in their study. Dai et al.(Reference Dai, Luo and Doyle24) showed that the lift efficiency can be improved when the aerodynamic torque supports the inertial pitching torque. The abovementioned examples show that FSI modelling is a cost-effective method for analysing figure-of-eight flapping motion.
The objective of the present study is to investigate the aerodynamics of a wing under figure-of-eight flapping motion using FSI CFD simulations. The kinematics of a wing undergoing figure-of-eight motion creates a condition with a variable angle-of-attack. The effects of using different angles of attack at the initial condition, namely initial pitch angles, and the spatial size of the figure-of-eight motion, namely the input link angle, are investigated. This study is expected to provide insights into the lift and stability of the wing under these flight conditions.
2.0 METHODOLOGY
2.1 Wing geometry modelling
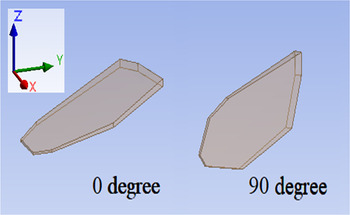
The geometry of the wing used was adopted from the experimental investigation carried out by Rehmat(Reference Rehmat12) and Rehmat et al.(Reference Rehmat, Lee, Trabia, Roll and Yim13) The wing thickness tapers from the base (4mm) to the tip (1mm), as shown in the plan view of the wing in Fig. 1. The spanwise and chordwise location (0, 0) indicates the anchoring point of the wing. The horizontal axis at chordwise 0mm is the rotation axis for the wing, and the pitch angle of the wing is based on this axis; see for example Fig. 2, which shows a 3D view of the wing at 0° and 90° initial pitch angle,  $\theta$p_initial. The wing base is located at spanwise 60.55mm, and the wingtip at 188.5mm. The length of the wing is 138mm.
Plan view of the edges and cross-sections of the proposed wing represented by red, blue, and green lines, where (0, 0) is the centre of rotation and L denotes the length of the wing.

3D view of the wing at initial pitch angle  $\theta$p_initial of 0° and 90°.

2.2 Governing equations for two-way FSI and data analysis
The mass conservation equation for incompressible flow (density = constant) is given as follows:
 \begin{equation}\nabla \cdot\vec v =0\end{equation}
where ∇ is divergence and $\;\vec v$ is velocity. The momentum conservation equation is as follows:
 \begin{equation}\rho \frac{{\partial \vec v}}{{\partial t}} + \rho \left( {\vec v\cdot\nabla } \right)\vec v = - \nabla p + \mu {\nabla ^2}\vec v + \rho \overrightarrow {{F_x}},\end{equation}
where  $\rho$ is density, t is time, p is pressure,
 $\mu $ is viscosity and F x represents the external forces. The Shear Stress Transport (SST) k–ω turbulence model was used as compromise between accuracy and computation cost, and this model is recommended in various similar previous studies.(Reference Frunzulica, Dumitrache and Stoia-Desjka17,Reference Aftab, Rafie, Razak and Ahmad25–Reference Radermacher27) The SST k–ω turbulence model transport equations are as follows:
 \begin{equation}\frac{\partial }{{\partial t}}\left( {\rho k} \right) + \frac{\partial }{{\partial {X_i}}}\left( {\rho k{u_i}} \right) = \frac{\partial }{{\partial {X_j}}}\left( {{D_k}\frac{{\partial k}}{{\partial {X_j}}}} \right) + {X_k} - {I_k} + {Y_k},\end{equation}
 \begin{equation}\frac{\partial }{{\partial t}}\left( {\rho \omega } \right) + \frac{\partial }{{\partial {X_i}}}\left( {\rho \omega {u_i}} \right) = \frac{\partial }{{\partial {X_j}}}\left( {{D_\omega }\frac{{\partial \omega }}{{\partial {X_j}}}} \right) + {X_\omega } - {I_\omega } + {Y_\omega },\end{equation}
where X k and X ω are the turbulence kinetic energy and specific rate generation due to the velocity gradient, I k and I ω are the k and ω diffusivity and Y k and Y ω are external forces.
The stress–strain matrix equation for the structural dynamics is as follows:
 \begin{equation}\lfloor{\sigma _x}{\sigma _y}{\sigma _z}{\sigma _{xy}}{\sigma _{yz}}{\sigma _{xz}}\rfloor^T = \left[ S \right]\left\{ {{b^v}} \right\}\end{equation}
where σ n is the stress vector (n=x, y, z, xy, yz, xz), S is the elasticity, and b is the elastic strain vector.
The equations used for the data analysis are presented below. The normalisation of the results in this study was based on the following equation:
 \begin{equation}{R_{norm}} = \frac{{{R_{org}} - {R_{min}}}}{{{R_{max}} - {R_{min}}}},\end{equation}
where R norm is the normalised data, R org is the original data, R max is the maximum value of the data and R min is the minimum value of the data. The lift coefficient C L is defined as
 \begin{equation}{C_L} = \frac{{{F_L}}}{{0.5\rho S{{\left( {{U_{tip\_max}}} \right)}^2}}}\end{equation}
where F L is the lift force,  $\rho$ is the density of air, S is the wing area and U tip_max is the maximum wingtip velocity. The Reynolds number Re of the wing undergoing figure-of-eight motion is calculated using the following equations based on refs. (Reference Hope, DeLuca and O’Hara28) and (Reference Bhat, Zhao, Sheridan, Hourigan and Thompson29), respectively:
 \begin{equation}{\rm{Re}} = \frac{{4\rho \left( {2{\theta _s}} \right)fhR}}{{\mu {A_R}}}\end{equation}
 \begin{equation}{A_R} = \frac{h}{\bar{c}}\end{equation}
where  $\theta$s is the stroke angle as defined in section 2.3, f is the frequency, R is the length measured from the (0, 0) anchoring point to the wingtip referred to in section 2.1, μ is the dynamic viscosity of air, A R is the wing aspect ratio, h is the wingspan and
 $\bar{c}$ is the average wing chord length, which is the ratio of the wing area to the wingspan. The maximum Reynolds numbers is 25,391, 38,086 and 50,781, respectively, for input link angles of 30°, 45°, and 60°.
2.3 Input and boundary conditions
We consider a 3D domain with height, width and length of 40cm, 30cm and 50cm, respectively, as shown in Fig. 3, which illustrates the outlines of the wing and the fluid domain and highlights the boundary conditions applied at the inlet, outlet and walls. The position of the centre of rotation of the wing is located at 10cm offset from the centre of the fluid domain towards the negative X-axis direction. The inlet value is set to 0m/s due to the hovering motion of the wing, which does not induce any free-stream velocity against itself. The outlet is set to the default pressure outlet. The figure-of-eight motion for the wing model in the CFD simulations is based on the formulations and mechanism described by Duffy(Reference Duffy and Roth30) and Rehmat et al.(Reference Rehmat, Lee, Trabia, Roll and Yim13) Briefly, the spherical four-link mechanism and the angles between each link are translated into spherical trigonometry. The base of the wing is set to move in three different directions, described using the stroke angle  $\theta$s, heave angle
 $\theta$h and pitch angle
 $\theta$p. The change in the angles over a flapping cycle are converted into angular speeds, and these values are provided as boundary inputs to the wing. Figure 4a illustrates the stroke
 $\theta$s, heave
 $\theta$h, and pitch
 $\theta$p, angles of the wing for an initial pitch angle of
 $\theta$p_initial = 0°, while Fig. 4b–d shows the stroke, heave and pitch angles and angular speed per cycle. The maximum velocity of the wing tip is 7.253m/s, 10.258m/s and 21.729m/s for the input link angles of 30°, 45°, and 60°. These maximum velocities for the wing tip were calculated based on the angular speeds as shown in Fig. 4b–d. Figure 5a shows the wing tip trajectories for input link angles of 30°, 45°, and 60°; Basically, the use of a higher input link angle increases the spatial size of the figure-of-eight motion. Figure 5a and b shows the change of the pitch angle of the wing (cross-sectional view at 75% L of the wing) over the cycle, namely from 1/16 to 16/16, for the case with
 $\theta$p_initial = 0° and 90°, respectively.
Fluid domain and wing outlines showing the inlet (yellow), outlet (green) and wall (white) boundary conditions. The centre of rotation of the wing is marked with an “x,” while the centre of the fluid domain is marked with an “o.”

(a) Illustration of the stroke ( $\theta$s), heave (
 $\theta$h) and pitch (
 $\theta$p) angles of the wing with an initial pitch angle of
 $\theta$p_initial = 0°. The stroke (
 $\theta$s), heave (
 $\theta$h) and pitch (
 $\theta$p) angles and the angular speed are shown for one cycle for input link angles of (b) 30°, (c) 45° and (d) 60°.

(a) Wingtip trajectories for input link angles of 30°, 45° and 60° at 75% L wing section from cycles 1/16 to 16/16 viewed along the negative x-axis for  $\theta$p_initial values of (b) 0° and (c) 90°.

The fluid is stagnant at the initial condition as there is no wing motion. The properties of air, such as the density and kinematic viscosity, are considered to be constant, being obtained from the work of McCormick(Reference McCormick31) at 15°C. The wing material is set to balsa wood to allow benchmarking against a condition similar to the experimental work of Rehmat.(Reference Rehmat12) The detailed properties of dry balsa wood, e.g., the Young’s moduli along the three axes, the density, the Poisson’s ratio, the flexural strength, and the compressive strength, were obtained from Forest Products Laboratory, USDA(32) (Table 1). Based on the wood grain properties shown in the wing prototype surface of Rehmat(Reference Rehmat12) and Rehmat et al.,(Reference Rehmat, Lee, Trabia, Roll and Yim13) it is assumed that model-grade balsa wood sheet was a tangent cut, so the longitudinal Young’s modulus is set spanwise (with the wood grain direction parallel to the span) while the radial and tangential Young’s moduli are set along the chordwise and flapwise direction, respectively.
Properties of wing and air

2.4 Numerical method
The solver used in the numerical analysis of this study is based on unsteady simulations together with dynamic mesh features. The FSI model in Ansys–Fluent commercial software(Reference Fluent33) is used in this study. The model is based on two-way system coupling between the fluid and structural parts. For the pressure–velocity coupling, the pressure-implicit with splitting of operators (PISO) scheme is used.(Reference Sohail and Ullah34,Reference Wan and Huang35) For comparison, we also tested the coupled pressure–velocity scheme, finding no significant difference. The pressure field is solved by using the second-order discretisation scheme, while the momentum is solved by the second-order upwind scheme. The least-squares cell-based method is applied in the spatial discretisation schemes. First-order upwind schemes are used to discretise the turbulent kinetic energy and specific dissipation rate. The Courant–Friedrichs–Lewy (CFL) condition is set to be lower than unity using the equation
 \begin{equation}{C_n} = \frac{{{V_a}\Delta t}}{{\Delta x}} < 1\end{equation}
where C n represents the Courant number, V a is the velocity magnitude, Δt is the time step and Δx is the mesh node interval. A constant time step of 5 × 10⁻⁴s is used. Residual values of 10−4 is set as the convergence criterion.
2.5 Simulation cases
There are two main types of simulation cases. In the first type, the initial pitch angle of the wing  $\theta$p_initial is varied from 0° to 360° in steps of 30°; For these cases, the input link angle is fixed at 45°. For the second type, three different input link angles are compared, i.e., 30, 45° and 60°, for
 $\theta$p_initial = 0° and 90°. The rotation speed in all cases is 12.25Hz (4.89s per cycle). For validation and benchmarking, the results from our CFD case with
 $\theta$p_initial = 0° and input link angle of 45° are compared with a similar experimental investigation by Rehmat.(Reference Rehmat12)
2.6 Meshing, grid-independence test and validation
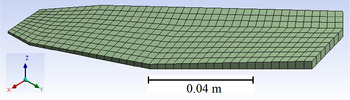
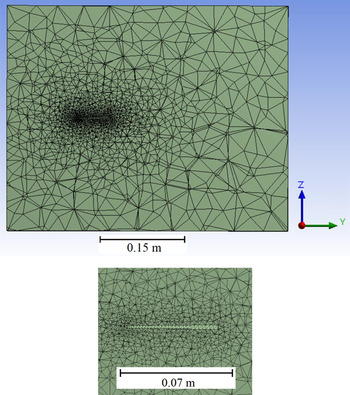
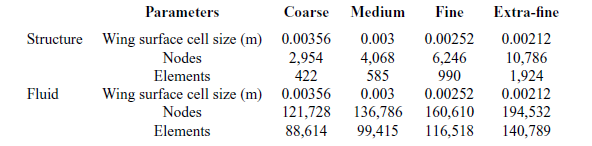
The ANSYS meshing module was used for the meshing process. The mesh cell shape for the fluid domain is tetrahedral, while prisms were adopted in the structural mesh domain. Inflation layers were not generated due to the complex figure-of-eight motion, as the inclusion of such layers would require a long time for remeshing the fluid domain, thereby increasing the computational time tremendously. The high cell aspect ratio of the inflation layers would also favour divergence of the solution, thus increasing the probability of negative cell volumes during remeshing. Despite the lack of prism layers, the average dimensionless wall distance was kept at y + < 5. A wing surface y + below 5 is acceptable to resolve the boundary layer according to the Fluent user guide.(Reference Fluent33) To reveal the effect of mesh refinement and the magnitude of the error on the predicted results, a grid independence test and solver validation were conducted. Figures 6 and 7 show the intermediately refined meshing for the fluid and structural domains. The mesh properties of the fluid and structural mesh domain are presented in Table 2. The authors acknowledge the importance of adding prism layers at the boundary to predict the viscous layer near the wing surface. However, given the complex nature of the flapping motion (figure of eight), which consists of rotations, heave and flapping motions, together with the limited computational power available, the current numerical code cannot be run with the prism layers preserved during the dynamic meshing of the flapping motion. This is due to the deficiency of the available dynamic meshing scheme that can be used to preserve the mentioned prism layers at large simulation time steps. Under this condition, the authors can only apply one mesh cell type, which is tetrahedral, to ensure the optimal mesh quality of the FSI simulations throughout all the time steps. However, to strengthen the reliability of the results presented herein, the current mesh is further refined by setting the wing surface cell size to extra fine (0.00212m). The results presented in the next section show that there are no significant differences in the results obtained using the extra-fine versus fine mesh, thus indicating that the fine mesh is adequate for this study.
Intermediate refinement meshing for the wing in the transient structural solver.

Intermediate refinement mesh slice of the fluid domain.

Coarse, medium, fine and extra-fine mesh properties

The “dynamic meshes” setting of the transient structural solver includes the implementation of the fluid–solid interface on the surface meshes of the wing and also turning on the “large deflection” feature, which predicts the stiffness variation due to deformation. To preserve the quality of the fluid domain meshes throughout the simulation period, the Laplace smoothing and local cell remeshing methods were adopted. In the Laplace smoothing settings, a spring constant factor of 1, a convergence tolerance of 0.001, 20 iterations, and a Laplace node relaxation of 1 are defined. In the local cell remeshing settings, the default minimum and maximum length scale of the tetrahedral domain meshes are based on the smallest and largest mesh sizes of the fluid domain, and the maximum cell skewness is set to 0.7. The system coupling function is set in Fluent, which allows the transfer of force and displacement data between the transient mechanical solver and the Fluent solver through the mentioned fluid–solid interfaces. Therefore, no user-defined function (UDF) is required to enable the dynamic mesh motion.
3.0 RESULTS AND DISCUSSION
The results in this study are converted into dimensionless values by normalisation using the minimal and maximal values. Lift coefficients are plotted based on the lift coefficient equation in section 2.2 and the maximum wing tip speed in section 2.3. The drag coefficients are not plotted since the current study focuses on hovering flight, indicating that there is no translational motion (relative wind) of the wing in terms of the global coordinates. Regarding the power, due to the complicated, figure-of-eight motion, the downwash air velocity varies at each position of the wing. Since for hovering the power is equal to the product of the thrust force and the air velocity in the downward direction, given the limited computational resources, the current model cannot predict the power due to the difficulty of quantifying the average downwash air velocity. Thus, only lift coefficients are presented herein.
3.1 Validation
From the grid independence test, it is deduced that the intermediate mesh refinement is sufficient to converge the numerical solutions, while the validation shows that the predicted results are comparable to the experimental results, especially for the wing normal forces. The normal force plot shows that the simulation results confirm the experimental results, except for a certain time period where the experimental normal forces show lower dips than the simulation results. The amplitude of the normal force predicted by the simulation cases is approximately 3.7% lower than the experimental values on average. The amplitude of the chordwise force predicted by the simulation cases is approximately 26% lower than the experimental values on average. These under-predictions may be caused by inconsistency of equipment, mechanism or methodology, which would generate these extra dips which are not expected for symmetrical flapping-wing patterns. The Fluent solver was not validated because the instantaneous lift of the micro flier wing is not available in the work of Rehmat.(Reference Rehmat12) However, a grid independence test is conducted for the Fluent results, revealing that all the mesh configurations result in overlapping lift curves over one flapping cycle. This indicates that the lift force is not mesh sensitive, hence intermediate mesh refinement is adopted for all the simulation cases. Figures 8 and 9 show the grid independence test and validation results for the normal and chordwise forces and lift coefficient. There is no clear explanation by Rehmat Reference Rehmat12 regarding the differences in amplitude during each stroke. Due to the symmetrical motion and wing position of the figure-of-eight motion, as shown in Fig. 8, the normal forces at each stroke are expected to have the same amplitude given the same tip speed for the up- and downstroke. It can be concluded that the cause of the variation in the amplitude between the up and downstrokes in the experimental data may be caused by a deficiency of the mechanical parts used in the experiment; for example, the figure-of-eight trajectory may have a slight deformation due to the deformation of one of the links. The reason why the computations did not capture this phenomenon is that the numerical simulations in the current study do not take into account such experimental flaws that may arise in the input from the four-link mechanism, as reported by Rehmat.(Reference Rehmat12) A temporal independence test was conducted with resolutions of 0.0004s, 0.0005s, 0.0006s and 0.0007s to deduce the sensitivity to varying the size of the time step. Figure 10 shows the temporal resolution independence test results for the normal and chordwise forces when using the transient structural solver, while Fig. 11 shows the temporal resolution independence test results for the lift coefficient when using the Fluent solver. These results reveal that the solver is not sensitive to the designated range of temporal resolution, as all the curves overlap each other. Thus, considering the computational power available, it is reasonable to adopt a time step of 0.0005s for predicting the performance of the flapping motion of the wing.
Grid independence test and validation results of normal and chordwise forces for the transient structural solver.

Grid independence test results of lift coefficient for Fluent solver.

Temporal resolution independence test results of normal and chordwise forces for the transient structural solver.

Temporal resolution independence test results of lift coefficient for Fluent solver.

3.2 Effect of different initial pitch values $\theta$p_initial on the lift

The effect of different initial pitch  $\theta$p_initial values in the range from 0° to 360° on the lift in one flapping cycle is investigated. The results show that the lift coefficient curve in all cases has a polynomial shape with two peaks and two dips (Fig. 12). The lift coefficient curve with
 $\theta$p_initial = 0° is mainly in the negative region with approximately level peaks near zero lift. The lift coefficient curve with
 $\theta$p_initial = 90° also shows two approximately level peaks, but at positive lift. The lift coefficient curves for
 $\theta$p_initial = 30° and 60° show one peak higher than another. The shape of the lift coefficient curves for
 $\theta$p_initial = 120° and 150° is a mirror image of the lift coefficient curves for
 $\theta$p_initial = 30° and 60°, with one peak being higher than the other. For
 $\theta$p_initial values from 180° to 330°, the lift coefficient curves are similar to those obtained for
 $\theta$p_initial values from 0° to 150°. The peak lifts for the case with
 $\theta$p_initial = 90° are located at 0.2 and 0.7 cycles, where the wing is approximately at the middle of its figure-of-eight motion, while the dips in the case with
 $\theta$p_initial = 0° are located at 0 and 0.5 cycles, where the wing is approximately at the far left and right sides of its figure-of-eight motion. This indicates that the case with
 $\theta$p_initial = 90°, despite having a lower lift magnitude than the case with
 $\theta$p_initial = 0°, will give the micro flyer better stability by inducing lower pitching moments on the fuselage. Figure 12 further illustrates the lift coefficient curve patterns for different
 $\theta$p_initial values. The maximum average lift coefficient of 0.393 occurs for
 $\theta$p_initial = 90°, while the minimum average lift coefficient of –0.507 occurs for
 $\theta$p_initial = 0°. The magnitude of the lift is highest for
 $\theta$p_initial = 0°, which indicates that the highest lift is obtained if the whole flapping micro aerial vehicle is flipped over. Figure 12 illustrates the average lift coefficient for different values of the initial pitch angle
 $\theta$p_initial. These results indicate that, in the configuration with
 $\theta$p_initial = 0°, the lift forces will induce alternating pitching moments around an axis perpendicular to the stroke and heave axes (X-axis in Fig. 4) during one cycle. These alternating moments may cause excessive vibration of the micro flyer. The configuration with
 $\theta$p_initial = 90° has very low lift-induced moments about the X-axis (Fig. 13). The maximum and minimum moments are 0.0432Nm and 0.0499Nm for
 $\theta$p_initial = 0° but 0.0024Nm and 0.00209Nm for
 $\theta$p_initial = 90°. The maximum lift-induced moments for
 $\theta$p_initial = 90° are only 5.55% of those for
 $\theta$p_initial = 0°, indicating that the configuration with
 $\theta$p_initial = 90° has better stability than the case with
 $\theta$p_initial = 0° due to the low pitching moments induced by the flapping motion. The moments about the Y- and Z-axis at the origin of the wing show that both cases exhibit a comparable rolling moment, while the case with
 $\theta$p_initial = 90° exhibits a greater yawing moment.
Lift in one flapping cycle for different initial pitch angle  $\theta$p_initial values and average lift for different initial pitch angle
 $\theta$p_initial values.

Moments about the X, Y and Z axes for  $\theta$p_initial = 0° and 90°.

3.3 Global pressure in the vicinity of the wing
The flow pressure contour plots in the vicinity of the wing for the cases with  $\theta$p_initial = 0°, 30°, 60° and 90° are plotted to visualise the interaction of the relative wind and the wing. Figure 14 shows the pressure contour plots on a slice section at 75% of the wing length for flapping cycles from 2/16 to 16/16 with
 $\theta$p_initial values of 0°, 30°, 60° and 90°. The slice sections of the fluid domain are designated at 75% of the length of the wing section, located at 156.5mm according to Fig. 5, being perpendicular to the horizontal plane and wingspan projection on a horizontal plane. For the case with
 $\theta$p_initial = 0°, the most adverse pressure gradient occurs at the 8/16 and 16/16 cycle positions, where the wing section is horizontal. The least adverse pressure gradient occurs at the 4/16 and 12/16 cycle positions, where the wing section is inclined at about 45° to the horizontal. These results confirm that the highest aerodynamic forces occur at the 8/16 and 16/16 cycle positions and the lowest at the 4/16 and 12/16 cycle positions for the case with
 $\theta$p_initial = 0°. For the case with
 $\theta$p_initial = 30°, the most adverse pressure gradient occurs at the 8/16 and 16/16 cycle positions where the wing section is at 30° to the horizontal. The least adverse pressure gradient occurs at the 10/16 and 14/16 cycle positions. These results confirm that the highest aerodynamic forces occur at the 8/16 and 16/16 cycle positions and the lowest at the 10/16 and 14/16 cycle positions for the case with
 $\theta$p_initial = 30°. For the case with
 $\theta$p_initial = 60°, the most adverse pressure gradient occurs at the 12/16 cycle position. The least adverse pressure gradient occurs at the 14/16 cycle position. These results confirm that the highest aerodynamic forces occurs at the 12/16 cycle position and the lowest at the 14/16 cycle position for the case with
 $\theta$p_initial = 60°. For the case with
 $\theta$p_initial = 90°, the most adverse pressure gradient occurs at the 2/16 and 10/16 cycle positions, where the wing section is horizontal. The least adverse pressure gradient occurs at the 8/16 and 16/16 cycle positions, where the wing section is inclined about 45° to the horizontal. These results confirm that the highest aerodynamic forces occur at the 2/16 and 10/16 cycle positions and the lowest at the 8/16 and 16/16 cycle positions for the case with
 $\theta$p_initial = 90°. Note that the positive pressure is always concentrated at the wing surface where the relative upwind wind is located, and the negative pressure always downstream. Thus, the flow pressure contours confirm the characteristics of the lift force line plots for the wing.
Pressure contour plot with slice section at 75% of wing length at flapping cycles 2/16 to 16/16 for  $\theta$p_initial values of (a) 0°, (b) 30°, (c) 60° and (d) 90°. Arrows indicate direction of movement.

3.4 Local pressure distribution on the wing surface
The pressure distribution at the blade section with 32.025mm chord at 75% of the wing length (Fig. 1) is generated to further relate the pressure on the wing surface to the generated lift. Generally, the initial pitch angle  $\theta$p_initial, affects the angles of attack of the wing sections at different flapping cycle positions. Two extreme cases corresponding to
 $\theta$p_initial = 0° and 90° are shown and discussed. Based on the flight sequence in Fig. 5 and the lift coefficient plot in Fig. 12, the position with maximum lift and minimum drag is illustrated in Fig. 5. The flight sequence shows that the case with
 $\theta$p_initial = 0° has the highest lift at the two ends of the figure-of-eight motion, while the case with
 $\theta$p_initial = 90° occurs at the middle of the figure-of-eight motion. This again confirms the previous finding that the case with
 $\theta$p_initial = 90° shows better stability due to the low pitching moments induced by the lift. This shows that
 $\theta$p_initial = 90° is the optimised angle and should be adopted when designing a flapping-wing MAV for use in hover flight. The blade surface pressure line plots further confirm the previous findings. Figures 15 and 16 show the pressure line plots of the wing section from cycles 2/16 to 16/16 for the cases with
 $\theta$p_initial = 0° and 90°.
Pressure line plots of upper surface of wing section from cycles (a) 2/16, (b) 4/16, (c) 6/16 and (d) 8/16 for the cases with  $\theta$p_initial = 0° and 90° with c = 32.025mm.

Pressure line plots of bottom surface of wing section from cycles (a) 2/16, (b) 4/16, (c) 6/16 and (d) 8/16 for the cases with  $\theta$p_initial = 0° and 90° with c = 32.025mm.

3.5 Structural stresses in the wing
The von Mises stress on the wing is predicted to determine whether the strength of the material is adequate to accommodate the stress induced by the aerodynamic and inertial forces. This structural analysis is done for the cases with  $\theta$p_initial = 0° and 90°, assuming that the effect of changing
 $\theta$p_initial is negligible. From the transient structural analysis, a wing surface contour plot of the von Mises stress is generated. Based on the wing surface von Mises stress contour plot, it is observed that the maximum stress is located at the base of the wing, which is expected as flapping wings can be considered to represent cantilever structures. The instantaneous maximum von Mises stress for the cases with input link angles of 30°, 45°, and 60° at all time steps within one flapping cycle is also plotted to identify the highest stress value and also the stress patterns through time. The highest von Mises stress is around 7.2MPa or the case with an input link angle of 60°, remaining below the flexural strength of balsa wood, which is approximately 21.6MPa. This indicates that there is still room for improvement by reducing the thickness of the wing to decrease the weight of the wing and enhance the flight performance. It was observed that, in all cases, the von Mises stress curve resembles of series of polynomial curves with four peaks and four dips within one flapping cycle. The peak stress at the mentioned specific cycles is caused by the rapid change of the direction of motion, which increases the inertial forces, while the dips, especially those near zero stress, occur when the direction of motion is constant. These findings can be further confirmed by tracing the wing tip trajectories, as shown in Fig. 5. Figures 17 and 18 show the maximum von Mises stress line plots for the different
 $\theta$p_initial values of 0°, 30°, 60° and 90° and different input link angles of the wing in one flapping cycle. Note that the case with
 $\theta$p_initial = 90° exhibits a smaller number of peaks and dips compared with the cases with other
 $\theta$p_initial values (Fig. 18). Given that the maximum stresses are almost the same for all the
 $\theta$p_initial values, the configuration with
 $\theta$p_initial = 90° is preferable due to the lower vibrational stresses, which can minimise the fatigue load.
Maximum von Mises stresses of the cases with  $\theta$p_initial values of (a) 0° and (b) 90° for the wing in one flapping cycle with input link angles of 30°, 45° and 60°.

Maximum von Mises stresses of the cases with  $\theta$p_initial values of 0°, 30°, 60° and 90° for the wing in one flapping cycle for an input link angle of 45°.

3.6 Effect of different input link angles on the lift
The effect of changing the input link angle on the lift coefficient is also predicted. The lift distribution in one flapping cycle with input link angle of 30°, 45° and 60° is predicted. It was observed that the input link angle of 60° resulted in the highest lift at  $\theta$p_initial = 0° and 90°, while the input link angle of 30° resulted in the lowest lift. This shows that, for given input rotational speed, a higher input link angle will generate more lift. The lowest and highest average lift is –0.34N and 0.20N for the input link angle of 60° with
 $\theta$p_initial = 0° and 90°, respectively. Figure 19 shows the lift coefficient distribution within one flapping cycle with a given initial pitch angle, while Fig. 20 shows the average lift coefficient for initial pitch angles of
 $\theta$p_initial = 0° and 90° at input link angles of 30°, 45° and 60°. The average lift coefficient with the input link angle of 45° dips when
 $\theta$p_initial = 0° but peaks when
 $\theta$p_initial = 90°. A higher lift coefficient means higher efficiency. Thus, these results indicate that the input link angle of 45° is the most efficient among the values considered in this study.
Lift coefficient distribution in one flapping cycle with an initial pitch angle  $\theta$p_initial value of (a) 0° and (b) 90° at input link angles of 30°, 45° and 60°.

Average lift coefficient with initial pitch angle  $\theta$p_initial values of (a) 0° and (b) 90° at input link angles of 30°, 45° and 60°.

4.0 CONCLUSIONS
FSI CFD simulations are carried out for flight based on a complex figure-of-eight flapping motion, investigating the effect on the flight performance of the initial pitch angle of the wing from 0° to 330° in steps of 30° and input link angles of 30°, 45° and 60°. The findings of the study can be summarised as follows:
-
• The effect of different initial pitch angle
$\theta$p_initial values on the lift generated by the flapping wing is investigated. The results show that the maximum average lift of 0.393 occurs for $\theta$p_initial = 90°, while the minimum average lift of 0.507 occurs for $\theta$p_initial = 0°. The maximum lift-induced moments for $\theta$p_initial = 90° are only 5.55% of those for $\theta$p_initial = 0°, indicating that the $\theta$p_initial = 90° configuration is more stable as the flapping motion induces lower pitching moments. -
• The flow pressure distribution in the vicinity of the flapping wing undergoing figure-of-eight motion can be correlated with the lift patterns of the wing. The changing angle-of-attack due to the different
$\theta$p_initial vaules will affect the performance of the flapping wing. The results confirm that the configuration with $\theta$p_initial = 90° is the best. -
• The von Mises stress results also confirm the finding that the configuration with
$\theta$p_initial = 90° is the best, having a smaller number of peaks and dips. The low maximum stresses also indicate that there is room for improvement of the current wing geometry by further reducing its thickness to decrease the total weight. -
• The effect of the input link is straightforward: the higher the input link angle, the higher the lift force, due to the larger size of the figure-of-eight trajectory. However, the lift coefficient generated for an input link angle of 45° is the highest among the input link angles with an initial pitch angle of
$\theta$p_initial = 90°. -
• The results of this preliminary study indicate that the figure-of-eight hovering motion of the proposed dragonfly-inspired wing model has potential for use in MAV wing design.


Acknowledgements
This research was financially supported by the MOSTI-Science Fund (grant no. SF002-2017) and the Universiti Malaya Impact-oriented Interdisciplinary Research Grant (IIRG005A-2020IISS).