





The word malnutrition refers to both overnutrition and undernutrition; in this study, we focus on undernutrition, which is more prevalent worldwide. One of the long-term causes of undernutrition is poverty, especially in sub-Saharan Africa, including Ethiopia. Undernutrition occurs when people consume insufficient amounts of food that does not meet their caloric needs for growth and energy(Reference Koethe and Heimburger1).
Sub-Saharan Africa is home to most nutritionally insecure communities in the world. Poor infrastructure, limited resources, conflict, HIV, and lack of access to health services are the main factors contributing to the malnutrition challenge on the continent(Reference Johnson2). Globally, over 805 million people are undernourished, the majority from developing countries, influenced by seasonal variation(3). Poor nutrition and HIV disease progression form a vicious cycle that contributes to further deterioration of patients’ health and ultimately leads to death. Adequate nutrition is necessary to manage opportunistic infections, maintain the immune system, optimise response to medical treatment and support optimal quality of life for PLWHA(Reference Ivers and Cullen4,5) .
HIV and nutrition are interrelated; as antiretroviral drugs become increasingly available in the poorest parts of the world, critical questions emerge about how well the drugs work in people who are short of food, and for those already receiving treatment, side effects such as body fat changes are a daily concern(Reference Bartlett6).
Nutrition counselling for HIV-positive individuals is ideally an interactive process between the patient and a trained counsellor, individualised using information from nutrition assessments to prioritise actions to improve nutritional status. Nutrition counselling can assist in identifying patients’ individual preferences, barriers to behaviour change and possible solutions to overcome these barriers(Reference Mahan and Escott-Stump7,8) . Ethiopia has one of the world’s highest incidences of undernourished individuals. Approximately 49 % of the population lacks adequate nutrition(9). In health behavioural education research, the Health Belief Model (HBM) is one of the most established and commonly used theories(Reference Glanz and Bishop10,Reference Painter and Borba11) .
The Joint United Nations Programme on HIV/AIDS reports confirm that mortality related to HIV/AIDS is high in developing countries where the application of existing national guidelines on nutritional care and support for PLWHA seems inadequate(12). Hence, nutrition education interventions aimed at providing adequate nutritional knowledge to adult PLWHA on antiretroviral treatment (ART) are needed for healthy dietary practices(13).
Despite the availability of national nutritional care guidelines for PLWHA in Ethiopia, there remains a significant gap in evidence regarding the effectiveness of theory-based nutrition education interventions in improving dietary practices among adults on ART. While nutrition counselling is recommended as part of routine HIV care, the integration of behavioural change theories such as the Health Belief Model (HBM) has not been systematically evaluated in Ethiopian ART settings. The HBM is the theory most commonly used in health education and health promotion to explain change and maintenance of health-related behaviours and to guide interventions(Reference Smith14). This study aims to address this gap by designing a theory-based nutrition education programme and evaluating its implementation among adult PLWHA receiving ART in selected health facilities in the Ilu Abbabor Zone. The findings from this research will provide evidence to inform national HIV care guidelines and strengthen nutritional counselling services.
Experimental methods
Study design, allocation procedure and bias control
A facility-based quasi-experimental study with a control group was conducted from September 2019 to May 2020 among adults receiving ART in the Ilu Abbabor Zone, southwest Ethiopia. From the fifteen health facilities providing ART services in the zone, six facilities were selected using simple random sampling to ensure representativeness and reduce selection bias at the facility level. Following selection, the facilities were allocated into intervention and control arms (three facilities each). This allocation was performed at facility level to avoid contamination between study arms, as patients within the same facility frequently interact during ART follow-up visits and health education sessions.
To minimise allocation bias, all eligible adults on ART within each selected facility were listed from the ART registration logbook. Proportional allocation to size was applied based on the number of active ART clients in each facility. Study participants were then selected using simple random sampling from these lists until the required sample size per facility was obtained. This procedure ensured that recruitment was random and representative within each cluster. Exactly 192 participants per arm were achieved through proportional allocation across the three facilities in each arm and random selection from the sampling frame. Because allocation occurred at cluster (facility) level rather than individual level, baseline socio-demographic differences between groups were anticipated. These differences were statistically controlled during analysis using difference-in-difference regression modelling. Contamination between intervention and control participants was minimised because nutrition education sessions were conducted separately within facilities and participants attend routine follow-ups only at their assigned ART clinic.
Sample size determination
A G-Power model with the following assumptions was used: estimated prevalence of inadequate dietary diversity among adult PLWHA = 28·7 %(Reference Weldegebreal15) with a 2·26 odds ratio, 80 % power and 5 % margin of error. This gave n 320. With 20 % non-response rate to account for potential attrition, incomplete data and participant withdrawal—a rate commonly used in similar longitudinal studies in Ethiopian settings(Reference Weldegebreal15,Reference Tadesse, Debebe and Habte19) —the final sample was 384 (192 per group).
Sampling technique
First, out of fifteen health facilities providing ART, six were selected via simple random sampling. Second, the health facilities were purposively allocated into intervention and control groups (three each). Finally, study participants were selected via simple random sampling, considering proportional allocation to size within each facility.
Data collection instruments and procedures
Data were collected via a structured questionnaire adapted from the literature and modified to local situations. The interview included socio-demographic questions and dietary diversity practices. HBM items were measured on a five-point Likert scale (strongly agree = 5 to strongly disagree = 1). The Likert items within each HBM construct were averaged to obtain a mean score for each construct. Dietary diversity was assessed using the 24-h recall method with the FAO/FANTA 12-food-group classification: cereals; oils/fats; sweets/sugars; legumes; white roots and tubers; fruits; vegetables; meat and meat products; milk and milk products; eggs; fish and seafood and spices, condiments and beverages(8). It is important to note that the FAO/FANTA Individual Dietary Diversity Score (IDDS) is designed to measure dietary variety rather than overall diet quality or healthfulness of individual food groups. Some food groups included in the tool, such as oils/fats and sweets/sugars, are not necessarily indicative of healthy dietary patterns when consumed in excess. However, within the context of IDDS, these groups contribute to the assessment of dietary diversity, which is considered a proxy indicator of micronutrient adequacy, particularly in resource-limited settings. In this study, the objective was to assess dietary diversity practices rather than adherence to specific dietary guidelines or healthy food choices. Therefore, the FAO/FANTA 12-food-group classification was applied as recommended for low-income settings and for studies involving people living with HIV, where dietary variety is strongly associated with improved nutritional adequacy. Participants received 1 point if they consumed any food within a subgroup in the last 24 h and 0 otherwise. The IDDS was the sum of food groups consumed. Scores were categorised as low (1–3), medium (4–5) or high (≥6) and then dichotomised into poor (0–4) and good (≥5) diversity(Reference Weldegebreal15).
Data quality control
The questionnaire was prepared in English, translated into Afaan Oromo and back-translated. Three days of training were given to data collectors and supervisors. Pretesting was done on 5 % of the sample outside the study facilities. Data were monitored daily for completeness and consistency.
Nutrition education intervention
Nutrition education was given to adult PLWHA with 1 to 4 months of follow-up on ART at baseline. Education was given every 15 days for four consecutive months (eight sessions total) to the intervention group, based on the following HBM constructs:
-
a. Susceptibility to malnutrition due to inappropriate nutrient intake;
-
b. Severity of malnutrition (wasting/thinness and overweight/obesity);
-
c. Beneficial effects of proper dietary practices;
-
d. Barriers to appropriate dietary practices;
-
e. Self-efficacy in following appropriate practices;
-
f. Cues to action.
Trained nutritionists using theoretical sessions, posters, brochures, flip charts and whiteboards delivered the education. Relevant references support this approach(Reference Glanz and Bishop10,Reference Painter and Borba11,Reference Diddana21) . For the control group, trained health extension workers following the standard nutritional counselling approach provided nutrition education at baseline for five consecutive days. The effects of poor nutrition on immune status and causes of malnutrition were briefly explained. No additional nutrition education was given to the control group during the five-month follow-up.
Data processing and statistical analysis
Data were coded and entered into SPSS version 23. Descriptive statistics (mean, sd and percentages) were used to summarise variables. Because this was a quasi-experimental study with baseline differences and repeated measurements over time, the primary analysis was conducted using a difference-in-difference (DID) regression approach to compare changes in dietary diversity practices between intervention and control groups from baseline to endline. A binary logistic regression model was fitted with dietary diversity practice (good v. poor) as the outcome variable. The model included group (intervention/control), time (baseline/endline) and the interaction term (group × time), which represents the DID estimator. To control for baseline imbalance, covariates that significantly differed between groups at baseline (age, occupation and monthly income) were included in the model. This modelling approach allowed estimation of the intervention effect while accounting for clustering and confounding factors. Independent t-tests and χ 2 tests were used only for descriptive baseline comparisons. Statistical significance was declared at P < 0·05.
Ethical approval
This study was conducted according to the guidelines laid down in the Declaration of Helsinki, and all procedures involving human subjects were approved by the Institutional Review Board of Jimma University (Ref. No. IHRPGD/394/2019). Written informed consent was obtained from all participants; for participants unable to read/write, the information sheet was read aloud, and consent was confirmed by fingerprint in the presence of a witness. Confidentiality was maintained.
Results
Socio-demographic and economic characteristics
A total of 384 adult PLWHA (192 interventions, 192 control) were included in the analysis, representing a 100 % response rate with no loss to follow-up. Greater proportions (68, 35·4 %) of the intervention group were aged 15–24 years; the majorities (70, 36·5 %) of controls were ≥45 years. Sex, education status, marital status and household number did not significantly differ (P > 0·05) between groups. However, age, occupation and monthly income were significantly different (P < 0·05) (Table 1).
Socio-demographic and economic characteristics of adult PLWHA in the Ilu Abbabor Zone, southwest Ethiopia, 2020

Table 1. Long description
A table comparing socio-demographic and economic characteristics of adult PLWHA in the Ilu Abbabor Zone, southwest Ethiopia, 2020. The table has 10 rows and 7 columns. Column headers are Variable, Category, Intervention (n 192), Control (n 192), Test statistics, χ2, and P. Row labels include Age (years), Sex, Education, Marital status, Household number, Occupation, and Monthly income (ETB). Each row provides the number and percentage of individuals in each category for both intervention and control groups, along with test statistics and P-values. Notable trends include significant differences in age, occupation, and monthly income between the groups, while sex, education status, marital status, and household number do not significantly differ.
PLWHA, people living with HIV/AIDS.
* Ever married includes currently married, divorced, separated and widowed.
Health belief model constructs
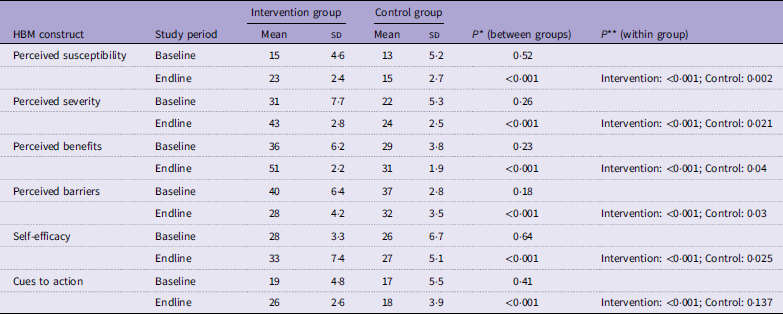
The mean scores of all HBM constructs significantly improved from pre- to post-intervention in the intervention group (paired t-test, P < 0·001), except perceived barriers. Independent t-tests showed no significant differences between groups at baseline (P > 0·05), but significant differences after the intervention (P < 0·001) (Table 2).
Health belief model construct scores of adult PLWHA in the Ilu Abbabor Zone, southwest Ethiopia, 2020 (n1 = n2 = 192)

Table 2. Long description
A table comparing health belief model construct scores between intervention and control groups over a study period. The table has 6 rows and 7 columns. Column headers are HBM construct, Study period, Intervention group Mean, Intervention group SD, Control group Mean, Control group SD, P* (between groups), and P** (within group). Row labels include Perceived susceptibility, Perceived severity, Perceived benefits, Perceived barriers, Self-efficacy, and Cues to action. Each construct is measured at Baseline and Endline. Notable trends include significant improvements in the intervention group for all constructs except perceived barriers, with significant differences between groups after the intervention.
PLWHA, people living with HIV/AIDS.
* P value for independent t‑test (intervention v. control at each time point).
** P value for paired t‑test (pre‑ v. post‑intervention within each group).
Dietary diversity practices
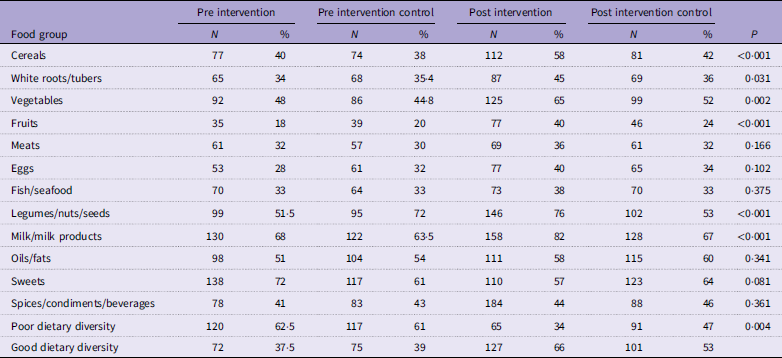
Except for sweets, consumption of all food groups increased in both groups. At baseline, no food group differed significantly except sweets. At endline, consumption of cereals, fruits, legumes/nuts/seeds was significantly higher in the intervention group (P < 0·001), as were white roots/tubers and vegetables (P < 0·05). At baseline, dietary diversity did not differ between groups (P = 0·375). After intervention, the proportion with good dietary diversity was 13 % higher in the intervention group (66 % v. 53 %, P = 0·004). The DID estimate of 9 % (95 % CI: 0·05 to 0·13; β = 0·09; P < 0·001) indicated that the improvement was statistically significant and attributable to the intervention (Tables 3 and 4).
Dietary diversity practices of adult PLWHA in the Ilu Abbabor Zone, southwest Ethiopia, 2020

Table 3. Long description
The table presents data on dietary diversity practices of adult PLWHA in the Ilu Abbabor Zone, southwest Ethiopia, 2020. It includes four main columns: Pre intervention, Pre intervention control, Post intervention, and Post intervention control, each with N and percent values. The food groups listed are Cereals, White roots/tubers, Vegetables, Fruits, Meats, Eggs, Fish/seafood, Legumes/nuts/seeds, Milk/milk products, Oils/fats, Sweets, Spices/condiments/beverages, Poor dietary diversity, and Good dietary diversity. Row 1: Cereals, Pre intervention N 77, Pre intervention percent 40, Pre intervention control N 74, Pre intervention control percent 38, Post intervention N 112, Post intervention percent 58, Post intervention control N 81, Post intervention control percent 42, P <0.001. Row 2: White roots/tubers, Pre intervention N 65, Pre intervention percent 34, Pre intervention control N 68, Pre intervention control percent 35.4, Post intervention N 87, Post intervention percent 45, Post intervention control N 69, Post intervention control percent 36, P 0.031. Row 3: Vegetables, Pre intervention N 92, Pre intervention percent 48, Pre intervention control N 86, Pre intervention control percent 44.8, Post intervention N 125, Post intervention percent 65, Post intervention control N 99, Post intervention control percent 52, P 0.002. Row 4: Fruits, Pre intervention N 35, Pre intervention percent 18, Pre intervention control N 39, Pre intervention control percent 20, Post intervention N 77, Post intervention percent 40, Post intervention control N 46, Post intervention control percent 24, P <0.001. Row 5: Meats, Pre intervention N 61, Pre intervention percent 32, Pre intervention control N 57, Pre intervention control percent 30, Post intervention N 69, Post intervention percent 36, Post intervention control N 61, Post intervention control percent 32, P 0.166. Row 6: Eggs, Pre intervention N 53, Pre intervention percent 28, Pre intervention control N 61, Pre intervention control percent 32, Post intervention N 77, Post intervention percent 40, Post intervention control N 65, Post intervention control percent 34, P 0.102. Row 7: Fish/seafood, Pre intervention N 70, Pre intervention percent 33, Pre intervention control N 64, Pre intervention control percent 33, Post intervention N 73, Post intervention percent 38, Post intervention control N 70, Post intervention control percent 33, P 0.375. Row 8: Legumes/nuts/seeds, Pre intervention N 99, Pre intervention percent 51.5, Pre intervention control N 95, Pre intervention control percent 50, Post intervention N 146, Post intervention percent 76, Post intervention control N 102, Post intervention control percent 53, P <0.001. Row 9: Milk/milk products, Pre intervention N 130, Pre intervention percent 68, Pre intervention control N 122, Pre intervention control percent 63.5, Post intervention N 158, Post intervention percent 82, Post intervention control N 128, Post intervention control percent 67, P <0.001. Row 10: Oils/fats, Pre intervention N 98, Pre intervention percent 51, Pre intervention control N 104, Pre intervention control percent 54, Post intervention N 111, Post intervention percent 58, Post intervention control N 115, Post intervention control percent 60, P 0.341. Row 11: Sweets, Pre intervention N 138, Pre intervention percent 72, Pre intervention control N 117, Pre intervention control percent 61, Post intervention N 110, Post intervention percent 57, Post intervention control N 123, Post intervention control percent 64, P 0.081. Row 12: Spices/condiments/beverages, Pre intervention N 78, Pre intervention percent 41, Pre intervention control N 83, Pre intervention control percent 43, Post intervention N 184, Post intervention percent 96, Post intervention control N 88, Post intervention control percent 46, P 0.361. Row 13: Poor dietary diversity, Pre intervention N 120, Pre intervention percent 62.5, Pre intervention control N 117, Pre intervention control percent 61, Post intervention N 65, Post intervention percent 34, Post intervention control N 91, Post intervention control percent 47, P 0.004. Row 14: Good dietary diversity, Pre intervention N 72, Pre intervention percent 37.5, Pre intervention control N 75, Pre intervention control percent 39, Post intervention N 127, Post intervention percent 66, Post intervention control N 101, Post intervention control percent 53, P 0.004.
PLWHA, people living with HIV/AIDS.
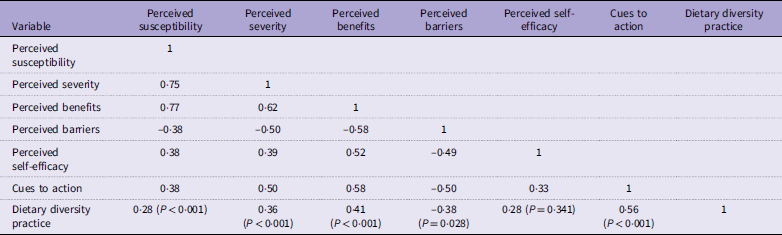
Correlation of health belief model constructs with dietary diversity practices of adult PLWHA in the Ilu Abbabor Zone, Southwest Ethiopia, 2020 (n1 = n2 = 192)

Table 4. Long description
A table with seven rows and seven columns showing the correlation between various health belief model constructs and dietary diversity practices. The columns are labeled as Perceived susceptibility, Perceived severity, Perceived benefits, Perceived barriers, Perceived self-efficacy, Cues to action, and Dietary diversity practice. The table includes correlation values between these constructs. Row 1: Perceived susceptibility, 1, 0.75, 0.77, -0.38, 0.38, 0.38, 0.28 (P < 0.001). Row 2: Perceived severity, 0.75, 1, 0.62, -0.50, 0.39, 0.50, 0.36 (P < 0.001). Row 3: Perceived benefits, 0.77, 0.62, 1, -0.58, 0.52, 0.58, 0.41 (P < 0.001). Row 4: Perceived barriers, -0.38, -0.50, -0.58, 1, -0.49, -0.50, -0.38 (P = 0.028). Row 5: Perceived self-efficacy, 0.38, 0.39, 0.52, -0.49, 1, 0.33, 0.28 (P = 0.341). Row 6: Cues to action, 0.38, 0.50, 0.58, -0.50, 0.33, 1, 0.56 (P < 0.001). Row 7: Dietary diversity practice, 0.28 (P < 0.001), 0.36 (P < 0.001), 0.41 (P < 0.001), -0.38 (P = 0.028), 0.28 (P = 0.341), 0.56 (P < 0.001), 1.
Correlation of Health Belief Model constructs with dietary diversity practices
Except for perceived self-efficacy, all HBM constructs were significantly correlated with dietary diversity practices. Perceived barriers were negatively correlated. Perceived benefits showed a significant positive correlation (r 0·413, P < 0·001), while perceived self-efficacy did not (r 0·275, P = 0·341) (Table 5).
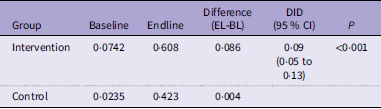
Difference‑in‑differences (DID) estimate

Table 5. Long description
A table comparing intervention and control groups at baseline and endline. The table has four rows and five columns. The columns are labeled Group, Baseline, Endline, Difference (EL-BL), DID (95% CI), and P. The rows are labeled Intervention and Control. For the Intervention group, the Baseline value is 0.0742, the Endline value is 0.608, the Difference (EL-BL) is 0.086, the DID (95% CI) is 0.09 (0.05 to 0.13), and the P value is less than 0.001. For the Control group, the Baseline value is 0.0235, the Endline value is 0.423, the Difference (EL-BL) is 0.004, the DID (95% CI) is not provided, and the P value is not provided.
Discussion
This study evaluated the effectiveness of an HBM-based nutrition education intervention on dietary diversity practices among adults on ART using a quasi-experimental design. Because allocation occurred at facility level, baseline socio-demographic differences were observed; these were statistically controlled using DID regression modelling, allowing a more robust estimation of the intervention effect.
At baseline, fewer than 40 % of participants in both groups had good dietary diversity, consistent with findings from Nigeria among PLWHA(Reference Akwivu and Akinbile16). However, studies from Uganda and Kenya reported higher diversity(Reference Nanziri17,Reference Mbithe and Fawzi18) , likely due to contextual differences in food availability, socio-economic status and behavioural education approaches. Following the intervention, the proportion with good diversity increased to 66 % in the intervention group v. 53 % in the control group. The DID analysis confirmed that this improvement was attributable to the intervention rather than temporal changes or baseline differences. The 9 % absolute difference-in-differences represents a clinically meaningful improvement, particularly given the resource-constrained setting and the vulnerable population studied. The use of quasi-experimental design with DID analysis strengthens the causal inference compared to previous cross-sectional studies(Reference Akwivu and Akinbile16–Reference Mbithe and Fawzi18), which could only demonstrate associations rather than intervention effects.
The use of the FAO/FANTA IDDS tool in this study was intended to assess dietary variety rather than diet quality. Although food groups such as sweets and oils are not markers of healthy diets, their inclusion aligns with the purpose of IDDS as a proxy for micronutrient adequacy in low-income settings(8,Reference Weldegebreal15) . This distinction is important when interpreting the findings.
Changes in specific food group consumption were observed. Milk and milk products were among the most commonly consumed groups, contrasting with other Ethiopian studies where cereals predominated(Reference Tadesse, Debebe and Habte19,Reference Worku20) . Meat consumption remained low, likely reflecting economic constraints, consistent with previous reports(Reference Worku20).
The significant improvement in HBM construct scores and their correlation with dietary diversity practices support the theoretical basis of the intervention. Perceived susceptibility, severity and cues to action showed strong positive associations, indicating that participants who better understood their nutritional risk were more likely to diversify their diets. Similar findings have been reported in other HBM-based studies(Reference Diddana21,Reference Tavakoli22) . Interestingly, perceived benefits showed a significant positive correlation (r 0·413, P < 0·001), while perceived self-efficacy did not demonstrate a statistically significant association (r 0·275, P = 0·341). This contrasts with some previous reports(Reference Sharifirad, Tol and Mohebi23) and may reflect contextual differences in how participants interpret benefits and confidence, or that other constructs such as susceptibility and cues to action played a more dominant role in this population.
Strengths and limitations
A key strength is the application of a behavioural theory (HBM) within a real-world ART clinic setting and the use of DID regression to control for baseline imbalances inherent in quasi-experimental designs. Cluster-level implementation minimised contamination. Several limitations should be acknowledged. First, dietary diversity was assessed using a 24-h recall, which may not capture usual dietary patterns and is subject to recall bias and day-to-day variation in food intake. Second, the IDDS measures variety rather than diet quality or nutritional adequacy; while dietary diversity is a validated proxy for micronutrient adequacy in resource-limited settings, it does not provide information on portion sizes, nutrient composition or overall diet healthfulness(8,Reference Weldegebreal15) . Third, allocation at facility level resulted in baseline socio-demographic differences between groups; although these were statistically controlled using DID regression, residual confounding cannot be completely excluded. Fourth, the 4-month follow-up period may not capture longer-term sustainability of dietary changes. Fifth, the study was conducted in a single zone of Ethiopia, which may limit generalisability to other settings with different cultural, economic and food environments. Sixth, the use of self-reported dietary data may be subject to social desirability bias, particularly in the intervention group receiving nutrition education.
Implications for practice and policy
The findings demonstrate that integrating theory-based nutrition education into routine ART services can significantly improve dietary practices. Incorporating models such as the HBM into national nutritional counselling guidelines for HIV care may enhance programme effectiveness in resource-limited settings. Specifically, we recommend: (1) training healthcare providers at ART clinics in HBM-based counselling approaches; (2) developing standardised HBM-based nutrition education materials for PLWHA; (3) integrating HBM constructs into routine nutritional assessment and counselling protocols and (4) establishing monitoring and evaluation frameworks to track nutrition-related outcomes within ART programmes.
Conclusions
In this study, sex, education status, marital status and household number did not significantly differ between groups. However, age, occupation and monthly income were significantly different. The mean scores of all HBM construct significantly improved from pre- to post-intervention except perceived barriers. At baseline, dietary diversity did not differ; after the intervention, good dietary diversity was 13 % higher in the intervention group. Perceived barriers were negatively correlated with dietary diversity. National guidelines should incorporate HBM in HIV/AIDS prevention, care and support.
Data availability statement
Data are available upon reasonable request to the corresponding author.
Acknowledgements
We express our gratitude to study participants, data collectors, supervisors, Jimma University and the Ilu Abbabor Zonal Health Department. Our appreciation also extends to all health facilities and their professionals in the zone. We also Thank Mattu University
This research received no specific grant from any funding agency, commercial or not-for-profit sectors.
Conceptualisation, E.N.G., T.B.L. and K.H.A.; methodology, E.N.G., T.B.L. and K.H.A.; validation, T.B.L. and K.H.A.; formal analysis, E.N.G.; investigation, E.N.G., T.B.L. and K.H.A.; resources, E.N.G., T.B.L. and K.H.A.; data curation, E.N.G., T.B.L. and K.H.A.; writing – original draft, E.N.G.; writing – review and editing, T.B.L. and K.H.A.; visualisation, T.B.L. and K.H.A.; supervision, E.N.G., T.B.L. and K.H.A.; project administration, T.B.L. and K.H.A.; funding acquisition, E.N.G., T.B.L. and K.H.A. All authors read and agreed to the published version.
The authors declare no conflicts of interest.


 Open access

