I. INTRODUCTION
34CrNiMo is a kind of typical medium carbon Cr–Ni–Mo alloyed steel, which is widely used to manufacture spindle part in machines. This steel is being recommended to manufacture spindle in the high power wind turbine. Reference Jin, Rong and Zhong1,Reference Tsai and Chiang2 It demands the spindle possessing a homogeneous microstructure and excellent mechanical properties. The addition of Cr, Ni, Mo alloying elements makes it possible to obtain the ideal microstructure and properties. In addition to the alloying method, optimizing the microstructure by controlling the hot working process is urgently required.
Due to the low stacking fault energy (SFE) preserving in the austenite phase, 34CrNiMo steel has a high tendency to the occurrence of dynamic recrystallization (DRX) during hot deformation. Reference Zhang, Zhang, Shen, Liu, Xia and Li3 But restricted by the load limit of machine, especially for the product with large dimensions, it is difficult to ensure the occurrence of complete DRX during each deformation step. If the deformation is interrupted suddenly at high temperature, when the DRX grains have not enough time to grow, the recrystallized grains would continue to grow during the interval period. This process is usually termed as metadynamic recrystallization (MDRX), which is originally proposed by Jonas and his co-workers. Reference Sakai, Ohashi, Chiba and Jonas4,Reference Petkovic, Luton and Jonas5 Compared with the conventional static recrystallization (SRX), MDRX is more rapid because of the elimination of incubation time required for the formation of new grains. Reference Elwazri, Essadiqi and Yue6–Reference Elwazri, Wanjara and Yue8 The occurrence of MDRX will affect the microstructural evolution and deformation resistance significantly during hot deformation. Therefore, clarifying the kinetics and microstructural evolution during MDRX will be beneficial for optimizing the microstructure of spindle by taking advantage of MDRX.
Numerous previous researches have focused on investigation of DRX and SRX of metals. But, relatively fewer attentions have been paid on MDRX. Lin et al. have investigated the MDRX behavior of an alloyed 42CrMo steel and modeled the softening kinetics and grain size evolution. Reference Lin, Chen and Zhong9,Reference Lin and Chen10 In the development of an ultra high-strength steel 300M, Li et al. have studied the recrystallization behaviors and established the kinetics equation of MDRX. Reference Liu, Liu, Li and Lin11–Reference Liu, Liu, Lin and Li13 Chen et al. established the kinetics of MDRX of ultra-super-critical rotor steel 30Cr2Ni4MoV and analyzed the microstructural evolution. Reference Chen, Cui, Sui and Fu14 These works confirm the significant effects of MDRX on the microstructure and mechanical properties of steels. Besides, Sommitsh, Reference Sommitsch, Huber and Stockinger15 Medeiros, Reference Medeiros, Prasad, Frazier and Srinivasan16 Bianchi, Reference Bianchi and Karjalainen17 Zhou, Reference Zhou and Baker18 Zhang Reference Zhang, Zhang, Shen, Liu and Xia19 et al. have investigated the MDRX behavior of superalloys. By comparison, the kinetics of MDRX of steels is much faster than that of superalloys. However, higher Cr and Ni contents preserving in 34CrNiMo steel as compared with 42CrMo or 300M steels, the information about the MDRX of this kind of medium carbon steel is still rare.
The purpose of this work is to investigate the MDRX behaviors of medium carbon Cr–Ni–Mo alloyed steel 34CrNiMo. The effects of the processing parameters including hot deformation temperature, strain rate, and interval time on the MDRX were discussed through analyzing the stress–strain curves and microstructure observation. The kinetics of MDRX behavior of the tested steel is attempted to be established.
II. EXPERIMENTAL PROCEDURES
The tested material is a 34CrNiMo steel, in which the chemical compositions are detailed in Table I. The ingot was fabricated through melting and casting. Then bar with the diameter of 200 mm was obtained after hot forging.
Chemical compositions of the tested steel (in wt%).

Cylindrical specimens with the dimension of Φ8 × 12 mm were machined from the same regions in the bar to obtain homogeneous initial microstructure. Two-stage compression tests were conducted on a Gleeble 1500 thermal-mechanical simulator (Dynamic Systems Inc., Poestenkill, New York). The specimens were heated to 1473 K at a heating rate of 10 K/s and held for 180 s to obtain equiaxed and homogeneous microstructure before compression. After that the specimens were cooled to 1273, 1323, 1373, and 1423 K at a cooling rate of 10 K/s and held for 30 s to eliminate the temperature gradients. Then two-stage compressions were performed. The strain rates of 0.1, 1.0, 5.0 s−1 and the interval times of 0.5, 1, 2, 5 s were selected. The strain rates for both of the stages of compression kept same for one compression test. The deformation strain of first stage of compression (ε1) was set as 0.4 to ensure the occurrence of DRX (critical strain for the occurrence of DRX (εc) is estimated as 0.14–0.18 at the tested strain rates and temperatures, which has been determined from isothermal compression test before Reference Zhang, Zhang, Xu, Xia and Shen20 ). A true strain of 0.1 was applied to the second stage of compression. After two-stage compression, the specimens were rapidly cooled to room temperature by quenching. The specimens for optical microstructure observation were sectioned parallel to the compressing axis. After being polished, the specimens were etched in an abluent solution of saturated picric acid. The region with a half radius from the compressing axis at center layer was examined using an optical microscope.
III. RESULTS
A. Characterization of the stress–strain curves
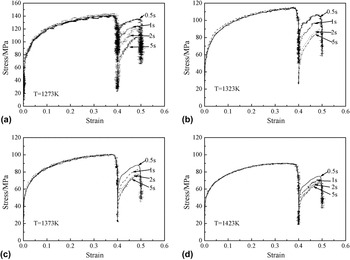
The flow stress–strain curves obtained in two-stage compression of the tested steel at a strain rate of 1.0 s−1 are shown in Fig. 1. It can be seen that the yield stresses at the second stage of compression for all conditions were higher or equal to those at the first stage of compression. The increasing of yield stress in the second stage of compression as compared with the first stage of compression is caused by the strain hardening effect from the first stage of compression. Meanwhile, the stresses of the second stage of compression decreased with increasing interval time. This indicates that some softening taken place during the interval period.
The stress–strain curves in the two-stage compressions at strain rate of 1.0 s−1. (a) 1273 K, (b) 1323 K, (c) 1373 K, (d) 1423 K.

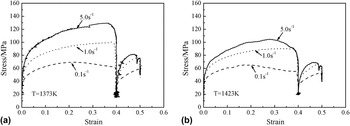
Figure 2 shows the stress–strain curves of the specimens deformed at 1373 and 1423 K with different strain rates at an interval time of 5 s. Restricted by the automation control of Gleeble machine, the curves with strain rate 5.0 s−1 show unloading phenomenon before reaching aimed strains. Since the DRX is easier to be happened at higher temperatures and lower strain rates, the curves with strain rate of 0.1 s−1 represent a peak stress. It is observed that some softening occurred during the interval time. And the kinetics of the softening seems different with strain rates. This will be quantitatively determined using the softening calculation equation in Sec. IV. B.
The stress–strain curves in the two-stage compressions with different strain rates at interval time of 5 s. (a) 1373 K, (b) 1423 K.

The critical strain for the occurrence of DRX has been determined in previous work. Reference Zhang, Zhang, Xu, Xia and Shen20 The deformation strain of 0.4, which exceeds the critical strain, facilitates the occurrence of DRX during the first stage of compression. However, the DRX grains have not enough time to grow. Therefore, it is estimated that MDRX occurred during interval period in the two-stage compression test.
B. Characterization of the microstructural evolution
To observe the initial austenite grain size before compression, a specimen was heated to 1473 K and held for 180 s followed by rapid cooling. Microstructure observation indicates that the specimen was composed of equiaxed austenite grains with homogeneous distribution before quenching. The average grain size (D 0) was detected by linear intercept method and estimated to be about 240 μm.
To confirm the softening mechanism during interval period, the microstructures of specimens were observed. Because of the small deformation strain of 0.1 performing on the second stage of compression, which is much less than the critical strain for DRX, it is supposed that the morphology of microstructure after two-stage compression test is similar to that before second hit except exhibiting a little elongated morphology.
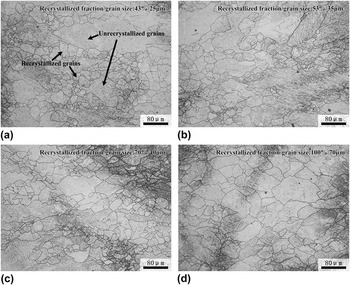
Figure 3 shows the microstructures of specimens deformed at 1273 K and a strain rate of 1.0 s−1 with different interval times. The recrystallized fraction was measured by image software through the analysis of area fraction, as being marked in the figure as well as the recrystallized average grain size. Inhomogeneous microstructure was obtained for the specimen with interval time of 0.5 s, as shown in Fig. 3(a). There exist some big and elongated unrecrystallized grains surrounded by many fine and equiaxed recrystallized grains at grain boundaries. With the interval time increasing from 1 s to 2 s, the recrystallized grain grew from 35 to 40 μm and the recrystallized fraction increased from 53 to 70%. When the interval time increased to 5 s, complete recrystallized grain microstructure was obtained. The recrystallized grains grew to 70 μm and shown some elongated morphology caused by the second stage of compression. The microstructural evolution clearly indicates the increases of recrystallized fraction and recrystallized grain size with increasing interval time. This confirms the occurrence of MDRX during the interval period in further.
Optical microstructures of the specimens deformed with different interval times when deformed at 1273 K and 1.0 s−1. (a) 0.5 s, (b) 1 s, (c) 2 s, (d) 5 s.

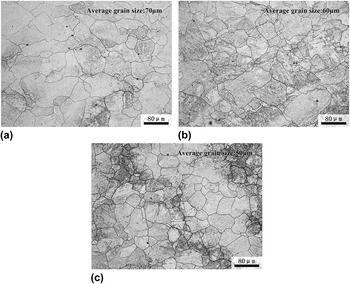
Figure 4 shows the microstructures of specimens deformed at 1373 K with different strain rates. It can be seen that complete recrystallization was obtained for all the specimens with the interval time of 5 s. By comparisons, it is found that the recrystallized grain size decreased from 70 to 50 μm with the strain rate increased from 0.1 to 5.0 s−1.
Optical microstructures of the specimens deformed with different strain rates at 1373 K with interval time of 5 s. (a) 0.1 s−1, (b) 1.0 s−1, (c) 5.0 s−1.

IV. DISCUSSIONS
A. Conditions for the occurrence of MDRX
Both recovery and recrystallization (SRX and MDRX) are possible softening mechanisms for metals or alloys during the intervals in high temperature compressions. Generally, the softening caused by recovery is limited and rather less than the softening caused by recrystallization. Reference Sakai, Belyakov, Kaibyshev, Miura and Jonas21 The critical condition for the occurrence of MDRX or SRX is usually determined by the deformation degree. Reference Petkovic, Luton and Jonas5 Once the deformation degree exceeds the critical strain for the occurrence of DRX, namely DRX has been initiated, MDRX can take place during the holding period after deformation. In MDRX process, the DRX grain will continue to grow after deformation stops. Contrarily, SRX usually occurs during interval while the deformation is the absence of DRX. Due to the elimination of incubation time to nucleate new grains like SRX, the kinetics of MDRX is supposed to be much more rapid than that of SRX.
The equilibrium phase diagram of the tested steel has been calculated by Thermal-Calc before. Reference Zhang, Zhang, Shen, Liu, Xia and Li3 It is found that austenite is the main phase for the tested steel when deformed at the evaluated temperatures. The austenite has low SFE, possessing a high occurrence tendency of DRX during hot deformation. The deformation strain of 0.4 at the first stage of compression facilitates the occurrence of DRX. But, complete DRX can be only obtained when the deformation strain is higher than 0.5–0.6 for the tested steel. Reference Zhang, Zhang, Xu, Xia and Shen20 Therefore, before the interruption, the recrystallized grains have not enough time to grow. Parts of the deformation energy are stored in specimens. During the interval period, the stored energy is consumed for further growth of the recrystallized grains, as observed in Figs. 3 and 4.
B. Effects of deformation parameters on the MDRX softening
The observations of stress–strain curve and microstructure declare that the yield stress at high temperature is a sensitive measure of microstructural changes. In previous researches, some softening measurement methods were put forward to evaluate the softening caused by SRX and/or MDRX from flow stress curves, such as offset method, back extrapolation method, average stress method, and strain-recovery method. Reference Elwazri, Essadiqi and Yue6,Reference Lin, Li and Xia22,Reference Laasraoui and Jonas23 In this work, the offset method, which has been utilized widely, is selected to estimate the softening faction X m. Reference Elwazri, Essadiqi and Yue6
 $${X_{\rm{m}}} = {{{\sigma _{\rm{m}}} - {\sigma _2}} \over {{\sigma _{\rm{m}}} - {\sigma _1}}}\quad ,$$
where σm is the flow stress at the end of first stage of compression, σ1 and σ2 are the 0.2% offset stresses at the first and second deformations, respectively.
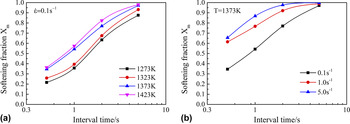
The softening fractions (X m) were plotted against the interval times for different conditions, as shown in Fig. 5. It can be found that the calculated softening fractions are consistent with the quantitative metallographic, while the quantitative metallographic data are a little higher than the calculated ones. It is supposed that the recrystallized fraction observed in the micrographs is composed of DRX fraction and MDRX fraction. Therefore, the recrystallized fractions in the micrographs are higher than the calculated ones.
Variation of MDRX softening fraction with interval time at (a) different temperatures and (b) strain rates.

For all of the curves in Fig. 5, the softening fraction increases with increasing interval time. It can be seen that most of the softening curves are of sigmoidal type with increasing interval time. This indicates that the kinetics of MDRX for the tested material followed the Avrami equation. Furthermore, it should be noted that the softening fraction reaches 100% after interval time of 5 s at evaluated conditions. This implies that the influence of static recovery is limited within this short period. The kinetics of MDRX for the tested steel is similar to some other medium carbon steels like 42CrMo steel and 300M steel, but is much faster than that for other alloys like superalloys. Reference Lin, Chen and Zhong9,Reference Liu, Liu, Lin and Li13,Reference Zhang, Zhang, Shen, Liu and Xia19,Reference Gu, Zhang, Zhang and Shen24 In addition, the tested steel has no addition of Nb or Ti micro-alloying elements which would have retardation effect on MDRX. Reference Roucoules, Yue and Jonas25 Fast MDRX kinetics would cause a big deviation for predicting the microstructural evolutions when designing or finite element (FE) modeling without considering the MDRX. It has such a big influence on the microstructural evolutions for medium carbon steels during hot forming which cannot be neglected.
Obviously, the effects of deformation temperature on MDRX softening are significant, as shown in Fig. 5(a). For a fixed interval time, the MDRX softening fraction increases with increasing temperature. The effects of temperature on MDRX softening behavior are attributed to the following two reasons. On the one hand, the critical strain for the occurrence of DRX decreases with increasing temperature. Higher fraction of DRX will be obtained in the first compression at higher temperatures, supplying more growth possible sites for MDRX. On the other hand, the growth of recrystallized grains is thought to be thermal activated. With the increasing of temperature, the migration of grain boundary and dislocation become fast, which is beneficial for the growth of dynamically formed grain.
The effect of strain rate on the MDRX softening fraction at deformation temperature of 1373 K is shown in Fig. 5(b). It is found that the MDRX softening fraction increases with increasing strain rate at a certain interval time. For instance, the MDRX fraction is 54.3% at strain rate of 0.1 s−1, while the MDRX softening fraction increases to 86.8% as the strain rate increases to 5.0 s−1. These experimental results would be related to high dislocation density obtained at high strain rates. More deformation energy is stored in the deformed grain at high strain rates, accelerating MDRX. At the same time, it supplies more nucleation sites for the growth at high strain rates. Reference Lin, Chen, Chen, Zhou, Wen and He26 This makes grains finer with increasing strain rate. As shown in Fig. 4, the average grain size decreases from 70 to 50 μm while the strain rate increase from 0.1 to 5.0 s−1 at the temperature of 1373 K.
The effect of initial grain size on MDRX softening fraction also has been addressed in previous researches. Lin et al. have demonstrated that the MDRX softening fraction increases with decreasing initial grain size. Reference Lin, Chen, Chen, Zhou, Wen and He26,Reference Shen, Semiatin and Shivpuri27 However, compared with other process parameters, the effect of initial grain size is less pronounced. Reference Zahiri, Byon, Kim, Lee and Hodgson28 Only a single grain size was therefore used in the two-stage compression test in this work. Besides, it is reported that the MDRX softening behavior is strain independent. Once a certain pre-strain which is beyond the critical strain of DRX is obtained, the kinetics of MDRX is more or less the same for different pre-strains. The works conducted by Dehghan-Manshadi, Reference Dehghan-Manshadi, Jonas, Hodgson and Barnett29 Uranga, Reference Uranga, Fernández, López and Rodriguez-Ibabe7 Elwazri, Reference Elwazri, Essadiqi and Yue6,Reference Elwazri, Wanjara and Yue8 Lin, Reference Lin, Chen and Zhong9 and Liu Reference Liu, Liu, Lin and Li13 have confirmed this.
C. Modeling the kinetics of MDRX
The kinetics of MDRX generally can be characterized by a modified Avrami equation. Reference Shen, Semiatin and Shivpuri27,Reference Sellars and Whiteman30
 $${X_{\rm{m}}} = 1 - \exp \left[ { - 0.693{{\left( {{t \over {{t_{0.5}}}}} \right)}^n}} \right]\quad ,$$
where X m is the volume fraction of MDRX (%) and its value is assumed to be same as the MDRX softening fraction while softening by recovery is neglected, t is the interval time (s), n is the material dependent constant, and t 0.5 is the time for the MDRX softening fraction of 50% (s). For a given initial grain size, t 0.5 is mainly affected by strain rate and deformation temperature, which can be expressed as follows. Reference Lin and Chen10
 $${t_{0.5}} = A{\dot \varepsilon ^p}\exp \left( {{{{Q_{\rm{m}}}} \over {RT}}} \right)\quad ,$$
where Q m is the apparent activation energy for MDRX (J/mol), T is the absolute deformation temperature (K), R is the gas constant [8.314 J/(mol K)], and p and A are the material dependent constants.
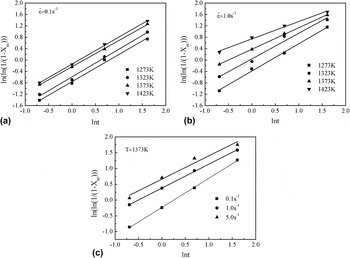
To calculate the material constant n, taking the natural logarithm on both sides of Eq. (2) twice gives,
 $$\ln \left( {\ln \left( {{1 \over {1 - {X_{\rm{m}}}}}} \right)} \right) = \ln 0.693 + n\ln t - n\ln {t_{0.5}}\quad .$$
The plots of ln(ln (1/(1 − X m))) versus ln t were drawn to calculate the value of n as shown in Fig. 6. By using linear regression method, the average value of n is obtained as 0.894.
Relationships between ln(ln(1/(1 − X m))) and ln t with different (a, b) temperatures and (c) strain rates.

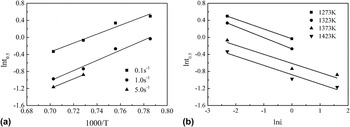
Taking the natural logarithm on both sides of Eq. (3), we can get:
 $$\ln {t_{0.5}} = \ln A + p\ln \dot \varepsilon + {{{Q_{\rm{m}}}} \over {RT}}\quad .$$
Equation (5) indicates that for a fixed strain rate, a linear relationship between ln t
0.5 and 1/T exists. While for a fixed temperature, a linear relationship between ln t
0.5 and
 $\ln \,\dot \varepsilon$
exists. The variations of ln t
0.5 with 1/T and
 $\ln \,\dot \varepsilon$
are drawn in Fig. 7, indicating that ln t
0.5 has a good linear relationship with 1/T or
 $\ln \,\dot \varepsilon$
. It is concluded that the values of Q
m and p are 93, 240 J/mol and −0.23, respectively. The constant A can be obtained as 1.55 × 10⁻⁴ based on the above calculated values. Then under the evaluated compression conditions, the kinetics equations of MDRX of the tested steel can be written as:
 $${X_{\rm{m}}} = 1 - \exp \left[ { - 0.693{{\left( {{t \over {{t_{0.5}}}}} \right)}^{0.894}}} \right]\quad .$$
 $${t_{0.5}} = 1.55 \times {10^{ - 4}}{\dot \varepsilon ^{ - 0.23}}\exp \left( {{{93240} \over {RT}}} \right)\quad .$$
Relationships between ln t 0.5 and 1/T with different (a) strain rates and (b) temperatures.

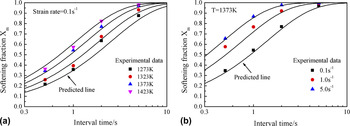
To evaluate the accuracy of the established equations of MDRX, the values of MDRX softening fraction X m predicted using the kinetics equations and the ones calculated from experimental data are illustrated in Fig. 8. Individual points are the experimental data calculated from the stress–strain curves using the offset method. The solid line shows the predicted values using the equations Eqs. (6) and (7). It shows that some experimental data deviate from the predicted curves. This is supposed to be caused by rapid MDRX kinetics for the tested steel. Some experimental deviation of the interval time would affect the flow stress curves at the second stage of compression. However, most of the predicted softening factions X m are in a good agreement with the experimental ones. This confirms that the equations obtained in this work can be applied to predict the MDRX softening behavior of 34CrNiMo steel in the interval period during high temperature deformation.
Comparisons of the experimental data and the predicted MDRX softening fractions with (a) different temperatures and (b) strain rates.

V. CONCLUSIONS
Two-stage hot compression tests were conducted in the temperature range of 1273–1423 K and strain rate range 0.1–5.0 s−1 to investigate the kinetics and microstructural evolutions during MDRX of medium carbon Cr–Ni–Mo alloyed steel 34CrNiMo. The main conclusions are summarized as follows.
-
(1) The occurrence of MDRX during interval time after hot compression at 1273–1423 K is confirmed through analysis of the stress–strain curves and microstructure observations.
-
(2) The softening effects resulted from MDRX increase with increasing deformation temperature, strain rate, and interval time at the evaluated conditions. The recrystallized grain size decreases with increasing strain rate.
-
(3) The kinetics of MDRX softening in the interval period during two-stage compression test of 34CrNiMo can be expressed as follows. The apparent activation energy of MDRX in the two-stage compression test of 34CrNiMo steel is evaluated as about 93 kJ/mol.
 $${X_{\rm{m}}} = 1 - \exp \left[ { - 0.693{{\left( {{t \over {{t_{0.5}}}}} \right)}^{0.894}}} \right]\quad .$$
 $${t_{0.5}} = 1.55 \times {10^{ - 4}}{\dot \varepsilon ^{ - 0.23}}\exp \left( {{{93240} \over {RT}}} \right)\quad .$$
ACKNOWLEDGMENTS
This work was supported by the National Natural Science Foundation of China (Nos. 51604058), the Fundamental Research Funds for the Central Universities of China, the Scientific Research Fund of Liaoning Provincial Education Department under Grant No. L2015120, the Open Research Fund from the State Key Laboratory of Rolling and Automation, Northeastern University (2015003).