



INTRODUCTION
The importance of vegetables to smallholder farmers in sub-Saharan Africa (SSA) not only lies in their potential of raising nutritional levels but also of increasing farmers’ cash income. Smallholder vegetable production has become a fast expanding enterprise due to the increasing demand from the rapidly growing human population (Kuntashula et al., Reference Kuntashula, Sileshi, Mafongoya and Banda2006). Rape (Brassica Napus L.) is one of these major vegetables. Rape is grown for its leaves which compare favourably with other leaf vegetables such as cabbage in its content of protein, vitamin A, vitamin C and iron (Nyakudya et al., Reference Nyakudya, Jimu, Marashe and Katsvanga2010). However, low soil fertility has been recognized as the fundamental biophysical constraint for increasing vegetable production among small-scale farmers in the region (Nziguheba et al., Reference Nziguheba, Merckx, Palm and Mutuo2002).
Traditionally, soil fertility management relied largely on long natural fallow periods and the incorporation of leaf litter from woodlands, cattle manure, crop residues and anthill soil (Mugwira et al., Reference Mugwira, Nyamangara and Hikwa2002). With the advent of inorganic fertilizers, sustained increases in per capita food production were recorded and in SSA, the greatest increase was on commercial farms (Sanchez et al., Reference Sanchez, Shepherd, Soule, Place, Buresh, Izac, Mokwunye, Kwesiga, Ndiritu, Woomer, Buresh, Sanchez and Calhoun1997). Since its adoption, fertilizer use had been growing annually at a rate around 6.7% in SSA (Mafongoya et al., Reference Mafongoya, Bationo, Kihara and Waswa2006) but growth in application rates per hectare have slowed down since the 1990 s (Rusike et al., Reference Rusike, Monaco, Heinrich and Wadddington2003). With the removal of fertilizer subsidies by most governments in SSA during the 1990 s, the prohibitive costs and general lack of availability positioned fertilizers beyond the reach of resource poor farmers (Kwesiga et al., Reference Kwesiga, Akinnifesi, Mafongoya, McDermott and Agumya2003). This has resulted in dominantly low-input agricultural systems, which unfortunately cannot sustain household food requirements (Mtambanengwe et al., Reference Mtambanengwe, Mapfumo and Vanlauwe2006).
Nitrogen (N) is one of the major nutrients that often limit crop production (Samborski et al., Reference Samborski, Tremblay and Fallon2009). The use of leguminous leafy biomass to supply N has been promoted to overcome soil fertility constraints (Akinnifesi et al., Reference Akinnifesi, Makumba, Sileshi, Ajayi and Mweta2007). Kuntashula et al. (Reference Kuntashula, Sileshi, Mafongoya and Banda2006) reported increased yields of cabbages grown on soils amended with leafy biomass of Gliricidia of between 85 and 167% relative to no soil amendment. Similarily, Mafongoya and Nair (Reference Mafongoya and Nair1997) reported that the application of 5 t dry matter (DM) ha−1 of leaves of Cajanus cajan and L. leucocephala gave mean maize grain yields of 5.6 t ha−1 compared with 1.1 t ha−1 on control plots with no organic inputs.
The relative profitability of using leaf biomass from leguminous trees and shrubs depends on the synchrony between N released from the decomposing organic materials with the demand for N by the crop (Myers et al., Reference Myers, Palm, Cuevas, Gunatilleke, Brossard, Woomer and Swift1994). Decomposition and N release of prunings is determined by climatic, edaphic and resource quality factors (Palm et al., Reference Palm, Myers, Nandwa, Buresh, Sanchez and Calhoun1997). The importance of these factors depends on the spatial and temporal scale at which they operate. Indices of predicting N release patterns of leguminous biomass that have been used by researchers include ratios of carbon-to-nitrogen, lignin-to-nitrogen (Palm and Sanchez, Reference Palm and Sanchez1991), polyphenol-to-nitrogen (Oglesby and Fownes, Reference Oglesby and Fownes1992), and (polyphenol+lignin)-to-nitrogen (Fox et al., Reference Fox, Myers and Vallis1990). All of the indices are apparently valid but depend on the time course under consideration and the type of materials.
It is known that the use of high quality materials releases N too quickly resulting in relatively large losses (Palm et al., Reference Palm, Giller, Mafongoya and Swift2001), while low quality prunings release nutrients too slowly to meet crop demand (Mafongoya and Nair, Reference Mafongoya and Nair1997). However, information on crop-nutrient interactions necessary for maximizing N availability and N use efficiency by crops for both low and high quality organic resource management is only beginning to emerge (Okonkwo et al., Reference Okonkwo, Mbagwu and Egwu2008). Supplementation of leguminous leaf biomass with inorganic fertilizer has also been advocated as this prolongs the availability of nutrients in the soil and may increase nutrient use efficiency by the crop (Akinnifesi et al., Reference Akinnifesi, Makumba and Kwesiga2006). In addition, synergistic effects of combining tree leaf biomass and inorganic fertilizers has been reported. In a study by Akinnifesi et al. (Reference Akinnifesi, Makumba, Sileshi, Ajayi and Mweta2007) a 38% increase in maize yields was attributed to the synergistic effect of combining prunings of Gliricidia and half the recommended N and P rates, relative to Gliricidia prunings alone. However, these evaluations have largely been on cereal crops, with little attention to soil nutrient management with the same resources for other important enterprises such as vegetable production. The objective of this study was, therefore, to determine biomass accumulation and nitrogen recovery rates of rape as influenced by different legume tree prunings and the effect of combining these prunings with inorganic N fertilizer.
MATERIALS AND METHODS
Study area
The experiment was conducted at the Hatfield Experimental Farm of the University of Pretoria, South Africa (28° 45′ S and 28° 16′ E and 1372 masl). The experimental site is situated in a region with an average annual rainfall of 670 mm, mainly in the summer season (during the months of October to March), and monthly average maximum and minimum temperatures of about 30 °C (in January) and 1.5 °C (in July), respectively (SAWS, 2008). The main soil type is a Hutton (South African Soil Classification Working Group, 1991), with a sandy-clay-loam texture and its characteristics are similar to a Ferric Luvisol (FAO-ISS-ISRIC, 1998).
Cultural practices
Two to three seeds of rape [Brassica napus L. cv. English Giant (Afrigro Seed Company, South Africa)] were planted in 200 cavity seedling trays containing a peat based potting medium, Hygromix (Hygrotech Seed Company, South Africa) in a glasshouse. Seedlings were irrigated once a day with a nutrient solution made by dissolving 2.5 g of Multiseed Classic soluble fertilizer (N:P:K ratio of 190: 82: 158; Gouws and Scheepers Limited, South Africa) in one litre of tap water. For every litre of nutrient solution used for irrigation 0.48, 0.21 and 0.39 g of N, P and K, respectively, was availed. Thinning out of the seedlings was done in ten days after planting ensuring that one healthy seedling remained in each cavity. The seedlings were transplanted to the field in 28 days after germination. In the southern African context leaves of English Giant are normally harvested from week-4 after transplanting through to maturity (90 days).
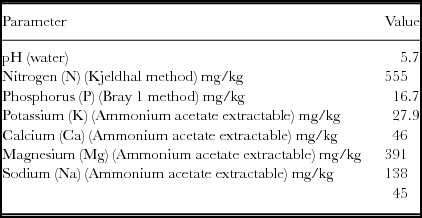
Before transplanting and following the soil analysis results presented in Table 1, and based on the local long term fertilizer trials conducted at the Hatfield Experimental Farm, single super phosphate (34 kg ha−1), potassium chloride (31 kg ha−1) and lime (5 t ha−1,) were applied during land preparation. Upon transplanting, seedlings were sprayed for aphids with Methomex (active ingredient: methomyl) once every two weeks. Experimental plots were kept weed free through hand hoeing at three and six weeks after transplanting. Supplementary irrigation, using a sprinkler system, was used to supply water to meet the crop water requirements and the amount varied with weather conditions and crop growth stage. Two separate experiments were conducted, the first between March–May 2009 and the second between March–May 2010, being the local autumn season of each year.
Soil chemical properties of the top 0.3 m soil layer of the experimental site, Hatfield Experimental Farm, Pretoria, SA.
Treatments and design
The field experiment was arranged in a randomised complete block design with three blocks in both seasons. Each of the three blocks consisted of eleven plots, each measuring 3.2 m × 3.15 m. Eight rows of four week old seedlings were planted with an inter-row spacing of 0.4 m and intra-row spacing of 0.35 m, giving a plant density of 71 400 plants ha−1. For plots amended solely with prunings and plots where prunings were supplemented with a quarter of the recommended rate of inorganic N (37.5 kg N ha−1) sun-dried prunings of L. leucocephala, C. calothyrsus, A. angustissima and A. karoo were applied at 5 t DM ha−1 a week before the seedlings were transplanted. These legume tree species were chosen for their ability to grow on a wide range of soil types in medium to high rainfall zones of South Africa (500–800 mm year−1); have ability to coppice and therefore have potential to produce high biomass.
Incorporation of the prunings was achieved by applying the mulch on the surface and mixing it within the 0–0.15 m layer of the soil using hand hoes. There were two inorganic N treatments applied at 37.5 and 150 kg N ha−1 being a quarter of the recommended N and the conventional recommendation for rape, respectively. A true control where no N was applied was also included. The inorganic N was applied as limestone ammonium nitrate (28% N) in three equal dressings at planting, 3 and 6 weeks after transplanting. The eleven treatments were divided into four categories namely sole prunings (denoted as L. leucocephala, C. calothyrsus, A. angustissima and A. karoo), prunings in combination with inorganic N (denoted as L. leucocephala+¼N, C. calothyrsus+¼N, A. angustissima+¼N and A. karoo+¼N), inorganic N treatments (denoted as 37.5 N and 150 N) and the control denoted as 0 N.
Decomposition and N release from the prunings were studied using litter bags. Sun-dried prunings of L. leucocephala, C. calothyrsus, A. angustissima and A. karoo (25 g) were placed into litter bags and buried at a depth of 0.15 m with their placement coinciding with the time of establishing the vegetable crop in the field. The experimental layout was a randomized complete block design. Seven replicate litter bags for each pruning material were placed in each of the three blocks.
Measurements
Biomass accumulation
For the determination of biomass accumulation and N recovery, two rape plants per plot were randomly selected for destructive sampling from the two rows next to each outer border row at 2, 4, 6, 8 and 9 weeks after transplanting. The plants were removed from moist plots using a garden folk, and excess soil was removed with a fine water spray, care being taken to avoid loss of small and fine roots. Following the removal of excess soil adhering to the root system, the uprooted plants were separated into shoot and root and the components were weighed separately. The shoot and root components were then oven dried at 60 °C to constant weight for determination of dry matter. The dried shoot and root samples were ground to pass through a 2 mm sieve and kept for laboratory analysis. The total accumulated biomass of rape was calculated by combining weight of the shoots and roots for each plot for each harvest converted to t ha−1. The final yields were obtained by harvesting three plants from each of the three middle rows (total of nine plants). Linear regression of the weekly biomass changes as a function of time provided an estimate of the mean relative growth rates (RGR) per week (Debaeke et al., Reference Debaeke, Rouet and Justes2006).
Pruning decomposition, N release and recovery
At each interval of litter bag recovery (1, 2, 3, 5, 7, 9 and 13 weeks of incubation in the soil) one litter bag, each for the four pruning materials, was recovered from each of the three blocks. Adhering soil was brushed from the recovered litter bags before they were oven-dried to constant weight at 60 °C. Upon removal from the oven, the litter bags were weighed to determine the remaining dry mass. The prunings remaining in each bag were ground to pass through a 2 mm sieve and kept for laboratory analysis.
Rates of N recovery
Rates of N recovery by rape following each destructive sampling were calculated using the difference method (Jokela and Randall, Reference Jokela and Randall1992) but modified as follows:
 $$\begin{equation*}
\% N\,{\rm Recovery = }\frac{{N\,{\rm uptake}({\rm treatment}) - N\,{\rm uptake}\,({\rm control}) \times 100}}{{{\rm rate}\,{\rm of}\,N\,{\rm release} \times {\rm total}\,N\,{\rm applied} \times {\rm time}\,({\rm weeks})}}.
\end{equation*}$$
The modification was motivated by the fact that potentially available N from prunings is dependent on decomposition and N release rates. Soon after crop establishment very little of the potentially available N would have mineralized and made available to the plant for uptake. Thus rates of N recovery calculated using the total N in prunings applied would yield low recoveries. The modified calculation took into account the amount of N released by prunings up to the time being considered (based on the N release patterns) or the cumulative N applied through the split applications.
Chemical analysis
Leguminous prunings were analysed for initial C, N, P, S, soluble condensed tannins and lignin. The initial N content of prunings, residual N content of prunings from the staggered recovery of litter bags, and the N content of the dried vegetable shoot and root samples at the various stages of growth, were all acid digested for total Kjeldahl N according to Wolf (Reference Wolf1982). The butanol-HCl assay as described by Makkar (Reference Makkar1995) without the Fe3+ in the reagent was used to determine soluble condensed tannins. The concentrations of the soluble condensed tannins in the extracts were estimated from the regression equation
 $$\begin{equation*}
{\rm Y} = 0.793{\rm X} - 0.022;\,{\rm r}^2 = 0.996,
\end{equation*}$$
(where Y is the absorbance units read at 550 nm; and X is the concentration of quebracho in mg ml−1). The results for the soluble condensed tannins were expressed as g kg−1 DM Quebracho Tannin Equivalent. Lignin was determined by the acid detergent fibre method (Goering and van Soest, Reference Goering and Van Soest1970).
Soil samples were analysed for pH, N, C, K, Ca, Mg and Na. The soils’ C and P contents were determined using the Walkley Black and Bray 1 methods, respectively, while K, Ca, Mg and Na were determined using the ammonium acetate extractable method.
Statistical analysis
Olsons’ (Reference Olson1963) negative exponential model.
 $$\begin{equation*}
Y_t = Y_0 e^{ - kt}
\end{equation*}$$
(where Yt is the remaining fraction of initial dry weight or nitrogen at time t in weeks), was used to calculate the decomposition constant (kD ) and N release constant (kN ). The constant k refers to percentage rate of weekly decomposition or N release. The decomposition and N release constants were subjected to analysis of variance (ANOVA). Data collected for root and shoot dry mass, total biomass, RGR, and rates of N recovery on all sampling dates were also subjected to ANOVA. Treatment means were compared using the least significant difference (LSD) test at 0.05 probability level. All statistics were conducted using SAS Procedures (SAS, 2010).
RESULTS
The main chemical properties of the 0–0.3 m soil layer are presented in Table 1.
Weather
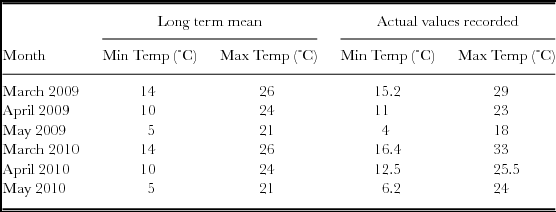
The mean monthly minimum and maximum temperatures during the experimental periods are presented in Table 2. The average monthly temperatures recorded in 2009 for March, April and May were 22, 17 and 11 °C, respectively, compared to 24.7, 19 and 15.1 recorded for the same months in 2010, respectively. Autumn was therefore warmer in 2010 than 2009. Rape is a cool season vegetable and is generally very sensitive to high growing temperatures and light intensity and therefore its best vegetative growth would be under cool weather.
Average maximum and minimum temperatures during March–May of the 2009 and 2010 seasons, mirrored against the long term means recorded at the Hatfield Experimental Farm, Pretoria, SA.
Chemical composition of prunings
The chemical composition of the initial set of prunings is presented in Table 3. There were significant differences among the prunings with respect to content of N, lignin and soluble condensed tannins, indicative of differences in organic resource quality. The general ranking of prunings based on their N contents was L. leucocephala > A. angustissima > C. calothyrsus > A. karoo; and the range for N content was 25.00–39.80 g N kg−1 DM. Lignin content ranged from 206.29–283.17 g kg−1 DM for the different prunings, and was lowest for L. leucocephala (151.10 g kg−1 DM). Prunings of A. angustissima and L. leucocephala had the lowest soluble condensed tannin content, with no significant difference (p < 0.05) between them. Prunings of C. calothyrsus and A. karoo had soluble condensed tannin contents >150.00 g kg−1 DM (quebracho tannin equivalent).
Chemical composition of legume tree prunings applied as soil ameliorants during March–May of the 2009 and 2010 growing seasons at the Hatfield Experimental Farm, Pretoria, SA.

*Means in the same row followed by different letters differ significantly (P < 0.05) using the LSD test.
Decomposition and nitrogen release of prunings
During the 13-week litter bag incubation period, the various prunings showed three significant patterns of mass loss and cumulative N mineralization. The first was a slow pattern, exemplified by prunings of A. karoo. These had very little N mineralization during the first seven weeks of incubation and by week 5, litter bags had only lost 15% of their original mass (Figure 1). For the second pattern, prunings of A. angustissima and C. calothyrsus steadily released N during the course of the experiment. Prunings of L. leucocephala had an even faster pattern of N release. By week 5, litterbags containing prunings of L. leucocephala had lost about 50% of their original mass and cumulative N mineralization of the prunings was rapid from the onset of the experiment.
Leucaena leucocephala, Acacia angustissima, Calliandra calothyrsus and Acacia karoo prunings remaining in litter bags incubated in the soil on several retrieval times over a 13-week period at the Hatfield Experimental Farm, Pretoria, SA.

The calculated decomposition rate (kD ) and N release rate (kN ) constants for the four prunings differed significantly (p < 0.05), indicative of the differences in mass loss of the recovered litter bags and cumulative net N mineralization patterns (Table 4). Prunings of A. karoo had the lowest (kD ) and (kN ) constants suggesting very little decomposition and cumulative net N mineralization. The general ranking of prunings based on kD and kN constants was: L. leucocephala > A. angustissima > C. calothyrsus > A. karoo.
Decomposition rate (kD , percentage rate of weekly decomposition) and N release (kN , percentage rate of weekly N release) constants for the different legume tree prunings used as soil ameliorants at the Hatfield Experimental Farm, Pretoria, SA.
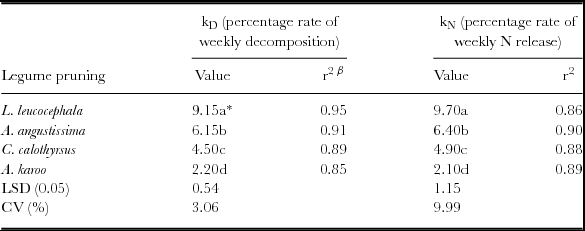
*Means in the same column followed by different letters differ significantly (p < 0.05) using the LSD test.
β = r2 denotes coefficient of determination after fitting the negative exponential model.
Decomposition and N release rates were negatively correlated with lignin (r = 0.85), soluble condensed tannins (r = 0.78), lignin-to-N ratio (r = 0.88), soluble condensed tannins-to-N ratio (r = 0.89) and the (lignin+soluble condensed tannin)-to-N ratio (r = 0.90). Regression of the (lignin+soluble condensed tannin)-to-N ratio on kD and kN gave coefficients of determination of 0.95 and 0.98, respectively (Figure 2). This indicated that in legume tree prunings, lignin and polyphenols play a major role in determining decomposition and N release.
The relationship between decomposition rate (kD) and nitrogen release rate (kN) constants and the (lignin+soluble polyphenol)-to-N-ratio of the four leguminous prunings. The straight lines were fitted by regression using data from all prunings.

Biomass yields
Application of the different prunings and inorganic fertilizer, alone or combined, increased total biomass yields of rape relative to the true control (0 N) during both seasons (Table 5). Treatment means for all variables measured were averaged across the two seasons. The general ranking of treatments based on total biomass yields was: 150 N > L. leucocephala+¼N > L. leucocephala > A. angustissima+¼N > C. calothyrsus+¼N > A. karoo+¼N > A. angustissima = 37.5 N > C. calothyrsus > A. karoo > 0 N. The trend for biomass accumulation for all treatments was generally linear and increased with time, even for the non-fertilised plots (Figure 3).
Partitioning of biomass of rape at week 9 after transplanting at the Hatfield Experimental Farm, Pretoria, SA. Each value is an average of the two growing seasons, March–May 2009 and 2010.

*Means in the same column followed by different letters differ significantly (p < 0.05) using the LSD test.
Total biomass yield of rape following soil amendment with legume tree prunings with or without inorganic N at Hatfield Experimental farm, Pretoria, SA. Lines extending beyond bar graphs denote standard error of the mean.

Soil amelioration with sole prunings of A. karoo increased the total biomass yield of rape by 1.09 t DM ha−1 relative to the yields of the non-fertilized plots (Table 5). The corresponding increases in biomass yield of rape following soil amelioration with sole prunings of C. calothyrsus, A. angustissima and L. leucocephala were 2, 3.2 and 7.5 fold, respectively. The total biomass increases over the true control plots following supplementation of prunings with a quarter of the recommended inorganic N were 13.31, 9.49, 6.81 and 5.23 t DM ha−1 for L. leucocephala+¼N, A. angustissima+¼N, C. calothyrsus+¼N and A. karoo+¼N, respectively.
The total biomass yields of 37.5 N treatment (5.67 t DM ha−1, Table 5) was higher than for the C. calothyrsus and A. karoo treatments by 1.43 and 3.18 t DM ha−1, respectively, but lower than the L. leucocephala treatment by 6.29 t DM ha−1. Treatment means obtained from the sole application of prunings of A. angustissima and the 37.5 N treatments were not statistically different from each other (p < 0.05). Supplementing N availability of prunings of A. karoo and C. calothyrsus through the addition of inorganic N increased the total biomass yields of rape by 0.96 and 2.54 t DM ha−1, respectively, relative to the yields of 37.5 N. The increases in biomass yields for L. leucocephala+¼N and A. angustissima+¼N over the 37.5 N were 9.04 and 5.02 t DM ha−1, respectively.
Plants from the 150 N treatment had total biomass yields which were 14.79, 13.04, 11.39 and 5.32 t DM ha−1 higher than yields realized following soil amelioration with prunings of A. karoo, C. calothyrsus, A. angustissima and L. leucocephala, respectively. Though the supplementation of prunings with inorganic N still gave biomass yields that were less than those realized for plants receiving the recommended N the deficit range narrowed to 2.57 (L. leucocephala+¼N) – 10.65 t DM ha−1 (A. karoo+¼N). There were apparently little additional increases in biomass when prunings of L. leucocephala were supplemented with inorganic N with the average increase in biomass being 2.75 t DM ha−1. In contrast average increases in biomass of 5.00 and 4.14 t DM ha−1 were realized for A. angustissima and A. karoo, respectively, following supplementation with inorganic N.
Plants from the 150 N treatment had the highest biomass accumulation at each sampling date throughout the course of the experiments (Figure 3). Although plants grown in soils ameliorated with prunings of A. karoo and the non-fertilized plants had comparable biomass yields up to week 4 during both seasons, the differences in biomass yields widened with time and by week 9 the absolute yields were statistically different (p < 0.05). A constant shoot to root ratio was observed across all treatments and averaged 11.40 (Table 5).
RGR values presented in Table 6 were obtained following the regression of the changes in biomass over time for the different treatments. The total, shoot and root growth rates were significantly different (p < 0.05) and the treatments ranked: 150 N > L. leucocephala+¼N > L. leucocephala > A. angustissima+¼N > C. calothyrsus+¼N > A. karoo+¼N > A. angustissima > 37.5 N > C. calothyrsus > A. karoo > 0 N. Total growth rates ranged from 2.34–26.70 g plant−1 week−1. Soil amelioration with prunings of A. karoo, C. calothyrsus, A. angustissima and L. leucocephala resulted in shoot growth rates of 3.21, 5.61, 8.24, and 16.32 g plant−1 week−1, which were lower than 23.49 g plant−1 week−1realized for the 150 N treatment. Shoot growth rates for treatments that were supplemented with inorganic N remained lower than for the 150 N treatment but the margin in differences narrowed to 3.40 (L. leucocephala+¼N)–14.03 g plant−1 week−1 (A. karoo+¼N) compared to 7.17 (sole prunings of L. leucocephala) and 20.28 g plant−1 week−1 (sole prunings of A. karoo). The shoot growth rate of plants from the 37.5 N treatment of 6.76 g plant−1 week−1 was higher than for plants from plots ameliorated with prunings of C. calothyrsus and A. karoo by 1.15 and 3.55 g plant−1 week−1, respectively. The corresponding increases in shoot growth rates over the 37.5 N treatment for plots ameliorated with prunings of A. angustissima and L. leucocephala were 1.48 and 9.56 g plant−1 week−1, respectively.
Mean weekly growth rates of the different plant tissues of rape at the Hatfield Experimental Farm, Pretoria, SA.

*Means in the same column followed by different letters differ significantly (p < 0.05) using the LSD test.
The general ranking of treatments for root growth rates was similar to that of shoot growth rates. Soil amelioration with sole prunings of A. karoo increased the root growth rate of rape by 0.14 g plant−1 week−1, relative to the root growth rate of the non-fertilized plots. The corresponding increases in root growth rates of rape following soil amelioration with sole prunings of C. calothyrsus, A. angustissima and L. leucocephala were 1.4, 2.6 and 6.4 fold, respectively. These were increased further following supplementation of prunings with a quarter of the recommended inorganic N. Just as for the shoot, supplementation of prunings with inorganic N narrowed the margin of differences in root growth rates relative to 150 N.
Nitrogen content of the shoot
The shoot N content of rape increased with time for all the other treatments except 0 N (Figure 4). End of season shoot N content for the eleven treatments ranged from 5.00–51.00 g N kg−1 DM. Plants from the 150 N had the highest shoot N content at each sampling date, throughout the course of the experiment. The nitrogen content of 0 N treatment reached its peak at week 4 (7.10 g N kg−1DM), thereafter, N content declined steadily and by week 9 it had dropped to 5.00 g N kg−1DM.
Patterns of biomass accumulation by rape during March--May of the 2009 and 2010 growing seasons at the Hatfield Experimental Farm, Pretoria, SA. Bars extending beyond symbols denote standard error of the mean.

The total shoot N content of plants from plots amended solely with prunings of A. karoo, C. calothyrsus, A. angustissima and L. leucocephala were 19.70, 25.00, 29.00 and 41.00 g N kg−1 DM, respectively, compared to 27.00 for 37.5 N and 51.00 g N kg−1 DM for 150 N (Figure 5). The addition of inorganic N to prunings increased N availability and plant uptake and narrowed the differences in shoot N content relative to the 150 N plants. Supplementation of prunings with inorganic N increased the shoot contents to 31.00, 34.00, 39.00 and 49.00 g N kg−1 DM for A. karoo+¼N, C. calothyrsus+¼N, A. angustissima+¼N and L. leucocephala+¼N, respectively.
Shoot nitrogen concentration of growing rape at Pretoria, SA. Each point is an average of the two growing seasons, March--May 2009 and March–May 2010. Bars extending beyond symbols denote standard error of the mean.

Rates of nitrogen recovery
Nitrogen recovery rates increased with time for all treatments. Figure 6 illustrates these increases for L. leucocephala (high N recovery) and A. karoo (low N recovery) with and without inorganic N. The general ranking of treatments based on N recovery rates was: 150 N > L. leucocephala+¼N > L. leucocephala > A. angustissima+¼N > C. calothyrsus+¼N > A. karoo+¼N > A. angustissima > 37.5 N > C. calothyrsus > A. karoo. The nitrogen recovery rates at week 2 after transplanting ranged from 1.0–16.3% and the cumulative N recovery at week 9 ranged from 21.0–66.1% (Table 7).
Mean rates of nitrogen recovery (%) by rape from week 2 to 9 after transplanting at the Hatfield Experimental Farm, Pretoria, SA.

*Means in the same column followed by different letters differ significantly (p < 0.05). using the LSD test.
Changes in the nitrogen recovery rates by rape following soil amendment with prunings of L. leucocephala and A. karoo with and without inorganic N mirrored against recovery rates from plants that received inorganic N at 37.5 and 150 kg N ha−1 during the 2009 growing season at Pretoria, SA. Bars extending beyond symbols denote standard error of the mean.

Differences in the amounts of available N during the course of the experiment led to rates of N recovery that were significantly different. Plants from the 150 N treatment had the highest rates of N recovery through to week 9. Most of the N was recovered between weeks 4 and 9 for all treatments. At week 4 after transplanting the nitrogen recovery rate of rape grown in soil amended solely with prunings of A. karoo were 4.5% of the total N recovered. The corresponding nitrogen recovery rates from plots amended solely with prunings of C. calothyrsus, A. angustissima and L. leucocephala were 9.7, 13.4 and 23.0%, respectively. Increased N availability following the supplementation of A. karoo prunings with inorganic N increased end of season N recovery rates by 26.1% relative to the recovery rates realized with sole prunings of A. karoo (Table 7). The corresponding end of season increases in N recovery rates for C. calothyrsus+¼N, A. angustissima+¼N and L. leucocephala+¼N were 10.9, 9.9 and 4.5%, respectively.
DISCUSSION
Biomass yield responses
Differences in biomass yields among the different legume pruning treatments could be explained by differences in chemical composition which ultimately resulted in different rates of kD and kN . The productivity of rape was governed by N availability, with an early supply of N crucial in crop establishment, plant vigour and therefore final yield. Vegetable crops require adequate supply of nutrients throughout the growing season to avoid reductions in yield and quality (Burns and Hammond, Reference Burns and Hammond2010). Interruptions in N supply for as little as six days shortly after transplanting has been reported to cause significant reductions in biomass and marketable yield of mature plants (Grant et al., Reference Grant, Flaten, Tomasiewicz and Sheppard2001). Thus, consistently high nutrient concentrations around the root zone are required for young plants to sustain growth rates during the exponential phase before their root system becomes large enough to explore the soil extensively.
The higher biomass yields of rape grown in soils ameliorated solely with the different legume prunings over the non-fertilized plants is evidence that the prunings can be used as sources of N for vegetable production. The results that we are reporting are comparable to those reported by Makumba and Phiri (Reference Makumba and Phiri2008), where soil amendment with Gliricidia sepium and Tephrosia candida biomass increased cabbage yields by 7.48 and 12.60 t ha−1, respectively, relative to the yield of the true control. Mtambanengwe et al. (Reference Mtambanengwe, Mapfumo and Vanlauwe2006) also reported a nine fold increase in maize grain yield following soil amendment with prunings of Clotalaria juncea applied at 7.50 t C ha−1. The higher biomass yields realized following the supplementation of prunings with inorganic N reflected improved nutrient availability and recovery by the rape.
The marginal positive benefits realized when prunings of L. leucocephala were supplemented with inorganic N could be attributable to poor N utilization due to excessive N loading and resultant leaching. Conversely, the addition of inorganic N to low quality prunings of A. karoo could have enhanced the decomposition and mineralization processes through the supply of N to the soil decomposer community, thus directly improving uptake of pruning-N by the vegetable crop (Vanlauwe et al., Reference Vanlauwe, Aihou, Aman, Iwuafor, Tossah, Diels, Sanginga, Lyasse, Merckx and Deckers2001).
Shoot nitrogen content
The different leguminous tree prunings used as soil ameliorants had different decomposition and N release rates. The linear trends in N content are an indication of the continuous release of N by prunings over time, which in turn supported different rates of biomass accumulation. Total N in the prunings varied and ultimately supported different nutrient recovery rates, explaining the different shoot N contents of treatments. The sharp increase in shoot N content of plants that received inorganic N at 150 kg N ha−1 from weeks 2 through to 8 corroborated the increased N availability in the soil following the split fertilizer applications. The decline in the shoot N content of the non-fertilized plants was due to non-replenishment of nutrients. Our findings on different rates of decomposition and N release supporting different rates of biomass accumulation and plant N content are consistent with the results of Kamara et al., (Reference Kamara, Akobundu, Sanginga and Jutzi2000). They reported that the incorporation of L. leucocephala prunings contributed more nitrogen to the soil and increased dry matter yield and N concentration in maize relative to 13 other leguminous prunings used.
Nitrogen uptake
The efficiency of N recovery by rape primarily hinged on early season N release potentials of the leguminous leafy biomass used in amending the soil. The significant differences in biomass accumulation of rape that was evident by week 4 after transplanting indicated the high N requirement of rape seedlings during this period of active growth. An early and consistent supply of N from the time of transplanting to week 4 is crucial as it is during this period that yield potentials seem to be set (Burns and Hammond, Reference Burns and Hammond2010). Leguminous leaf biomass with low lignin and soluble condensed tannins decomposes rapidly (Teeklay, Reference Teeklay2007) and this was evident in the N recovery rates of rape grown in plots amended with prunings of L. leucocephala compared to the other leguminous amendments. Soil amendment with leaf biomass of A. karoo (which was high in lignin and polyphenols and had a low N release constant) on the other hand resulted in relatively low N recovery rates. The improved N recovery rates following supplementation of prunings with inorganic N follows that inorganic N increased the efficiency with which rape extracted N from the soil. This resulted from increased growth due to readily available N, which promoted stronger and more rapid root development, allowing these plants to exploit both existing soil N, pruning-N as well as from the split applications of inorganic N.
The greater part of SSA is covered by the Miombo eco-region and among the recognised woodland types is the Acacia/Combretum woodland (WWF, 2002). Acacias are coppicing species and have the ability to produce more biomass following pruning (Mafongoya et al., Reference Mafongoya, Bationo, Kihara and Waswa2006). Thus the marked increases in N recovery rates of the A. karoo+¼N treatment implied that if farmers in low input agricultural systems combine inorganic N with low quality leguminous prunings, which are often readily available, they may be able to significantly increase crop productivity through maximizing N availability and N use efficiency by crops. The incorporation of prunings in agricultural soils has also been reported to be a useful means of sustaining the soils’ organic matter content (Palm et al., Reference Palm, Giller, Mafongoya and Swift2001).
CONCLUSION
The study has shown the agronomic feasibility of biomass transfer technologies for the production of vegetables. The production of rape was governed by N release patterns of prunings which were in turn controlled by the prunings’ lignin and polyphenol contents. Soil amendment with sole prunings of L. leucocephala gave significantly higher biomass yields relative to the true control but marginal positive benefits were realized when L. leucocephala prunings were supplemented with inorganic N. The addition of inorganic N to low quality prunings of the Acacia species with high lignin and polyphenol contents significantly improved N recovery and biomass yields of rape, a management option which may be desirable to smallholder farmers who characteristically have access to low quality prunings.
Acknowledgments
We are grateful to Mimosa Extract Company (Pty) Ltd, Pietermaritzburg, South Africa for supplying us with the quebracho used in tannin analysis.



