Introduction
The chemistry of nepheline solid solutions has attracted considerable interest for nearly a century because of its compositional variation in diverse rock types (e.g. Bannister and Hey, Reference Bannister and Hey1931; Miyashiro, Reference Miyashiro1951; Smith and Sahama, Reference Smith and Sahama1954; Tilley, Reference Tilley1954; Barth, Reference Barth1963; Velde and Yoder, Reference Velde and Yoder1978; Henderson and Gibb, Reference Henderson and Gibb1983; Wilkinson and Hensel, Reference Wilkinson and Hensel1994; Blancher et al., Reference Blancher, D'Arco, Fonteilles and Pascal2010). Consequently, it is well established that natural nephelines are not restricted to the ‘ideal composition’ Na3KAl4Si4O16 (cf. Hålenius et al., Reference Hålenius, Hatert, Pasero and Mills2018) as they usually contain some excess Si′ (e.g. Henderson, Reference Henderson2020). In addition, small amounts of Ca2+ (up to 3.5 wt.% CaO) might occur with the alkali atoms in the cavity cation ‘Na-sites’ (see Antao and Hovis, Reference Antao and Hovis2021) and some Fe3+ commonly replaces Si4+ and Al3+ in the tetrahedral framework. It also has been proposed that ‘small’ divalent cations (mainly Mg, but also Fe2+) could occur in the tetrahedral sites according to the coupled substitution 2Al3+ = (Mg, Fe)2+ + Si4+ (see Henderson, Reference Henderson2020 and references therein).
In general, it is expected that very low contents of Mg (and Mn) occur in most natural nephelines (see Deer et al., Reference Deer, Howie, Wise and Zussman2004; table 6). Indeed, Henderson (Reference Henderson2020) pointed out that Mg tends to be the most important ‘small’ divalent cation reported for this mineral based on a new database of 310 published analyses. Henderson (Reference Henderson2020) also assumed that the Fe3+/Fe2+ ratio is relatively high (see below). However, prior to the development of the electron microprobe, small amounts of Mg, Mn, Fe and Ti were commonly reported in the classical ‘wet-chemical’ analysis of nepheline and kalsilite grain separates (Bannister and Hey, Reference Bannister and Hey1931; Reference Bannister and Hey1942; Sahama, Reference Sahama1954; Neuvonen, Reference Neuvonen1956). Subsequently these have been considered to reflect the presence of alteration products or mineral impurities (Dollase and Thomas, Reference Dollase and Thomas1978). Hence, the presence of Mg in natural nephelines and kalsilites has not been systematically investigated. Nonetheless, while investigating the composition of nepheline and kalsilite in mafic potassic volcanic rocks from central Brazil, the first author observed that relatively large amounts of Mg (average ~0.3 wt.% MgO) occur in these minerals and that a strong positive correlation exists between Mg and Fe contents. The companion paper by Henderson and Oliveira (Reference Henderson and Oliveira2022) has established how ‘small’ divalent cations (e.g. Mg, Mn, Fe2+, etc) are incorporated in the calculation of nepheline/kalsilite atomic formulae.
In this work, we present and discuss some examples that reveal the significance of the Mg (and Fe) contents in nepheline and kalsilite. These observations are based on recently assembled databases of published and new wavelength-dispersive spectroscopy (WDS) electron microprobe analyses of these minerals, taken exclusively from alkaline ultrabasic volcanic rocks (see below). Additionally, we verify the significance of the higher amounts of Mg (and Fe) for the calculation of nepheline/kalsilite end-member components using the revised equations presented in our companion paper (Henderson and Oliveira, Reference Henderson and Oliveira2022).
Magnesium as an important minor element in nepheline and kalsilite
Roedder (Reference Roedder1951) was the first to suggest that the occurrence of Mg could be important in natural kalsilite, and its hexagonal counterparts nepheline and kaliophilite, mainly when they have crystallised from Mg-rich alkaline magmas. At that time, though, there was only one ‘wet-chemical’ analysis of a kalsilite-rich mineral separate (i.e. Bannister and Hey, Reference Bannister and Hey1942) with 3.7 wt.% MgO and 5.0 wt.% CaO, elements which were generally attributed to inclusions of phlogopite and diopside. The compositions shown in the larger dataset of Deer et al. (Reference Deer, Howie, Wise and Zussman2004; table 7) indicate that kalsilite from volcanic rocks can actually have significant amounts of MgO (average ~0.4 wt.%). As far as we are aware, that work is the most extensive compilation of kalsilite compositions published. While researching the composition of nepheline and kalsilite in strongly SiO2-undersaturated mafic potassic volcanic rocks (i.e. feldspar-free assemblages), the first author assembled comprehensive databases of 168 kalsilite compositions (137 published and 31 new electron microprobe WDS data) and 315 nepheline analyses (144 published; 171 unpublished) taken only from feldspar-free volcanic rocks (i.e. foidites). These databases were compiled at the Institute of Geosciences, University of Brasília, and have been used in the current papers.
It has long been recognised that variations in the composition of natural nephelines are related intimately to their igneous paragenesis and crystallisation conditions (see Miyashiro, Reference Miyashiro1951; Tilley, Reference Tilley1954; Barth, Reference Barth1963; Edgar, Reference Edgar and Brown1984; Wilkinson and Hensel, Reference Wilkinson and Hensel1994). However, almost all previous studies of nepheline composition have dealt with ‘common’ alkaline igneous rocks (e.g. nepheline syenites, phonolites, alkali basalts, etc) where nepheline is associated with feldspars. Thus, as many of these feldspar-bearing rocks represent late-stage products of magmatic differentiation, it can be anticipated that nepheline crystallised from such Mg-poor residual magmas will only contain minor amounts of MgO. This might have led to a biased view of the small concentrations of MgO (usually <0.1 wt.%; Henderson, Reference Henderson2020) so far reported in most natural nephelines.
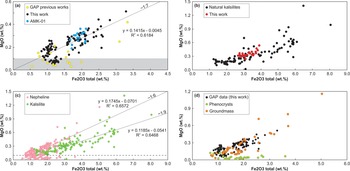
K-rich nepheline, rather than kalsilite, is the main leucocratic mineral of strongly porphyritic (olivine- and clinopyroxene-phyric) mafic potassic volcanic rocks of the Goiás Alkaline Province, central Brazil (e.g. Brod et al., Reference Brod, Barbosa, Junqueira-Brod, Gaspar, Diniz-Pinto, Sgarbi, Petrinovic, Comin-Chiaramonti and Gomes2005; Oliveira et al., Reference Oliveira, Brod and Junqueira-Brod2021). The fine-grained groundmass of some of these rocks include both nepheline and kalsilite occurring interstitially as individual, well separated crystals, together with abundant clinopyroxene, magnetite and perovskite. Leucite (commonly replaced by analcime), and rarely melilite, might or might not be present. Post-magmatic, secondary phases, are mainly analcime and other zeolites. The Mg content of these K-rich nephelines varies from 0.05 to 0.51 wt.% MgO (average 0.22 wt.%; n = 120). In addition, there is a good positive correlation (R 2 = 0.62) between the Mg and Fe contents, even in a single rock sample (see Fig. 1a, sample AMK-01). In comparison with nepheline, kalsilite has consistently higher amounts of Mg, ranging from 0.24 to 0.54 wt.% MgO (average 0.35 wt.%; n = 31), and also shows a positive correlation between Mg and Fe contents.
Plot of MgO vs total Fe2O3 (wt.%) of reliable data (see text) for nepheline and kalsilite from alkaline ultrabasic volcanic rocks (i.e. feldspar-free assemblages) in the two new databases reported in this work. (a) Groundmass nepheline from Goiás Alkaline Province (GAP) potassic foidites. The correlation between MgO and total Fe (as Fe2O3) is close to a 1:7 ratio (n = 120), suggesting that for every ~3.5 Fe atoms there is one Mg2+ cation in the structure of these nephelines (NB. atom/cation numbers corrected for atoms per formula unit). Also note that >80% of compositions have MgO contents >0.1 wt.% (grey area); this is in marked contrast to most values reported for igneous nephelines (cf. Henderson, Reference Henderson2020). (b) Groundmass kalsilite from Goiás Alkaline Province potassic foidites compared to natural kalsilites worldwide (database compiled by ILO). All plotted data are from EMP analysis except for one reliable ‘wet-chemical’ analysis (Sahama, Reference Sahama1954). (c) A comparison between the new nepheline and kalsilite databases. All data points plot above 0.5 wt.% total Fe2O3 and most of them (~80%) have MgO contents >0.1 wt.% (dashed line). The correlation between MgO and total Fe (as Fe2O3) is ~1:9 for all kalsilites (n = 121) and ~1:6 for groundmass nephelines (n = 187); phenocrysts of nepheline were not included because they follow a very distinct trend (see Fig. 1d). (d) Nepheline database compositions grouped according to their mode of occurrence. Groundmass nepheline, including this work data, show a positive correlation between MgO and total Fe. In contrast, nepheline phenocrysts plot in a trend almost parallel to the horizontal axis, being enriched in total Fe, but poor in MgO. The statistics of the most relevant linear trends mentioned above are displayed in their respective charts (see Figs 1a, 1c). See text for further explanation of (a–d) panels.

The unusually high concentrations of MgO found in nepheline and kalsilite from the Goiás Alkaline Province can also be observed in our new ‘global’ databases (Fig. 1c). Nephelines with MgO contents as high as 0.25 wt.% are not uncommon, and values with up to 0.59 wt.% (Gurenko and Sobolev, Reference Gurenko and Sobolev2018), 0.80 wt.% (Céline Baudouin, Reference Baudouin2016), and 1.16 wt.% (Prelevic et al., Reference Prelević, Foley, Romer, Cvetković and Downes2005) have occasionally been reported for nepheline in the groundmass of other olivine-rich foidites. Groundmass kalsilites from K-rich volcanic rocks have Mg and total Fe contents that can reach up to 1.41 wt.% MgO and 8.05 wt.% Fe2O3 (e.g. Tappe et al., Reference Tappe, Foley and Pearson2003). It is evident that kalsilite has a wider range of MgO and total Fe2O3 in comparison to nepheline (see Fig. 1c). As both minerals occur essentially as late magmatic phases in the groundmass of these alkaline volcanic rocks, a possible explanation could be that kalsilite, in general, is derived from more Mg-rich magmas. However, this explanation is not straightforward. There are examples of kalsilite and nepheline coexisting in the groundmass of the same rock sample with very contrasting Mg and Fe values (e.g. Andersen et al., Reference Andersen, Elburg and Erambert2012); thus, their sample A2274 has kalsilite with 0.40 wt.% MgO and 4.71 wt.% Fe2O3, on average, and nepheline with 0.07 wt.% MgO and 0.76 wt.% Fe2O3, on average. A similar example is evident for our new EMP data for sample AMK-1. These patterns suggest that the magmatic compositions are not the only controlling factor for Mg and Fe incorporation in these two minerals (see below). In addition, the iron content of nepheline seems to be related to the Fe oxidation state and the amount of alkalis in the system (Edgar, Reference Edgar and Brown1984); however, the case of kalsilite is more complicated as the Fe content appears to be independent of the composition of the parental magma.
The positive correlation between Mg and Fe contents is shown by the compositions in both the nepheline and kalsilite databases (see Fig. 1c), however, the occurrence of Mg-rich nepheline seems to be restricted to groundmass nephelines (see Fig. 1d). In contrast, nepheline phenocrysts tend to have lower MgO contents (usually <0.15 wt.%), regardless of their high amounts of total Fe (up to 3.6 wt.% Fe2O3). It should be emphasised, though, that most of the groundmass compositions used in Fig. 1d are from nephelines associated with kalsilite in strongly Si-undersaturated mafic potassic/ultrapotassic volcanic rocks, whereas the phenocrysts data are exclusively from Mg-poor nephelinites (see Dawson, Reference Dawson1998; Platz et al., Reference Platz, Foley and André2004; Baudouin et al., Reference Baudouin, Parat, Denis and Mangasini2016), suggesting the Mg-content of nepheline is dependent on magma composition. However, it is evident that more systematic investigations and a greater number of nepheline/kalsilite analyses that have reliably analysed MgO data are required before any conclusive interpretation can be established.
It is clear that the positive correlation of Mg and Fe contents in nepheline and kalsilite described in this work is the opposite of the ‘normal’ magmatic trend, where Fe/Mg increases (or Mg/Fe decreases) with differentiation driven by the crystallisation of ferro-magnesian minerals. In this context it is useful to refer to the work of Gurenko and Sobolev (Reference Gurenko and Sobolev2018) where their whole-rock and mineral databases show increasing Fe/(Fe+Mg) with fractionation in the parent rocks, increasing Fe/(Fe+Mg) in phenocrystic olivine, phenocryst and groundmass clinopyroxene and groundmass mica. In contrast, their data for groundmass nepheline and kalsilite compositions show a coupled Fe and Mg trend leading to a fairly constant Fe/(Fe+Mg) ratio within the rock series. These relationships are comparable to those found in the Goiás Alkaline Province feldspar-free volcanic rocks and their mineral data (Brod et al., Reference Brod, Barbosa, Junqueira-Brod, Gaspar, Diniz-Pinto, Sgarbi, Petrinovic, Comin-Chiaramonti and Gomes2005). It is probable, therefore, that the strong positive correlation between Mg and Fe observed for nepheline and kalsilite can be explained, at least in part, by a combination of mineral crystal-chemical properties and geochemical affinities; thus, cations with similar ionic sizes and valences (i.e. Fe3+, Fe2+, Mg2+ and Mn+2) can enter the same crystallographic site in the stuffed-tridymite framework (Henderson, Reference Henderson2020). On the basis of the prevalence of Mg-rich nepheline and kalsilite in the groundmasses of Mg-rich alkaline volcanic rocks, it is reasonable to assume that significant amounts of Mg might be incorporated preferentially by the nepheline and kalsilite structure when these minerals crystallised during rapid cooling to form the groundmass phases. Under these conditions, more Mg2+ cations would be available for all the crystallising phases and the high-temperatures would make the mineral structures more expanded and able to accept ‘small’ divalent cations into the tetrahedral framework sites. Indeed, we suggest that the amount of Mg incorporated might depend on the cooling rate of the particular lava pulse, with faster quenching locking-in the earlier high-temperature Mg-rich compositions. We emphasise, again, that further research, including experimental petrology studies, are required before any reliable interpretation can be established for the detailed nepheline and kalsilite relations in the strongly Si-undersaturated alkaline volcanic rocks.
The recognition of Mg as an important minor element in natural nepheline and kalsilite leads to numerous avenues of possible research. In this context, it is worth mentioning recent studies on the existence of a high-pressure compound (i.e. the NAL phase) that can be recrystallised to composite inclusions of a low-pressure assemblage of Mg-rich nepheline–kalsilite solid solution and (Mg,Fe)Al2O4-rich spinel during the exhumation of diamond-bearing, super-deep mantle to the Earth's surface (Walter et al., Reference Walter, Kohn, Araujo, Bulanova, Smith, Gaillou, Wang, Steele and Shirey2011; Thomson et al., Reference Thomson, Kohn, Bulanova, Smith, Araujo and Walter2014; Zedgenizov et al., Reference Zedgenizov, Kagi, Shatsky and Ragozin2014; Kimura et al., Reference Kimura, Kojitani and Akaogi2021).
Data reliability
At the outset, we recommend that all EMP studies of nepheline and kalsilite should include rigorous determination of all the divalent cations (i.e. Mg, Mn, Ca, Sr and Ba). In addition, care should be taken to avoid loss of Na under the electron beam (i.e. if possible using a beam current 2–5 nA with a spot size 5–20 μm; Morgan and London, Reference Morgan and London2005; Campbell et al., Reference Campbell, Charnock, Dyer, Hillier, Chenery, Stoppa, Henderson, Walcott and Rumsey2016; and/or using a rastered beam). According to Henderson (Reference Henderson2020), high quality nepheline data should have: (1) values for both ΔAlcc and ΔTcharge parameters within ±0.6; (2) values for the ΔAlcc/ΔTcharge ratio between 1.0 and 1.25; (3) CaO contents <3.5 wt.%; (4) the sum of tetrahedral cations within the range 15.9–16.1; and (5) only limited differences between the excess Si′ parameters (see Henderson Reference Henderson2020 for further details). In this study, we also extend this approach to kalsilite data. Hence, all data presented here (Fig. 1), and their interpretations, are based exclusively on the most reliable K-rich nepheline and kalsilite analyses.
Regardless of the high contents of MgO and total Fe2O3 noted in the previous section, a wider range of values have occasionally been reported in the literature (see Prelević et al., Reference Prelević, Foley, Romer, Cvetković and Downes2005; Andersen et al., Reference Andersen, Elburg and Erambert2014; Isakova et al., Reference Isakova, Panina and Stoppa2017) and their reliability should be assessed. Firstly, a large number of nepheline analyses are considered unreliable because of their high totals of tetrahedral cations (i.e. the sum of T-cations > 16.1). This is undoubtedly a consequence of unsuitable analytical conditions, involving significant Na loss (also see Henderson, Reference Henderson2020). Secondly, K-rich nepheline and kalsilite from feldspar-free volcanic rocks generally contain much smaller CaO contents (usually <0.5 wt.%) than most natural nephelines reported to date. Thus, we evaluate the CaO contents for individual spot analyses compared to the average composition for a single sample; any outlier with an unusually high CaO content can be rejected. About 70 nepheline analyses have been considered unreliable on the basis of their unacceptable stoichiometric parameters combined with our ‘new’ ‘Ca-rich’ approach. In addition, the nepheline data for exsolved nepheline–kalsilite phenocrysts (see Andersen et al., Reference Andersen, Elburg and Erambert2012) were omitted as they represent a post-magmatic, subsolidus process. Within the kalsilite database, 21 analyses do not report MgO contents; 16 analyses are unreliable on the basis of at least one of the five criteria above (most are from a single sample from Andersen et al., Reference Andersen, Elburg and Erambert2014); and 6 analyses have been considered anomalously rich in CaO. In addition, the four ‘acceptable’ analyses from Isakova et al. (Reference Isakova, Panina and Stoppa2017) were rejected because of their low analytical totals (95.0–98.2 wt.%), which probably result from the ‘robust’ analytical conditions employed. Even so, the extremely high values of total Fe (up to 12.6 wt.% FeO; Isakova et al., Reference Isakova, Panina and Stoppa2017) reported for kalsilites, which occur as daughter phases of primary melt inclusions, merit further consideration.
A direct consequence of the use of the ‘new’ Spreadsheet 1 (see Henderson and Oliveira, Reference Henderson and Oliveira2022) for data reliability is that a much narrower range of ΔAlcc/ΔTcharge ratios has been obtained for reliable analyses when compared with the range established by Henderson (Reference Henderson2020). In the case of the nepheline database used in this study, when considering only the reliable analyses, this parameter varies from 1.125 to 1.147 (average 1.140; n = 217). For reliable kalsilite analyses, the ‘new’ ΔAlcc/ΔTcharge ratio shows an even narrower range of values (1.137 to 1.146, with an average of 1.142; n = 127). Hereafter, we recommend that ΔAlcc/ΔTcharge ratios between 1.1 and 1.2 should be accepted as indicating high quality microprobe nepheline and kalsilite analyses.
Application of the revised spreadsheets
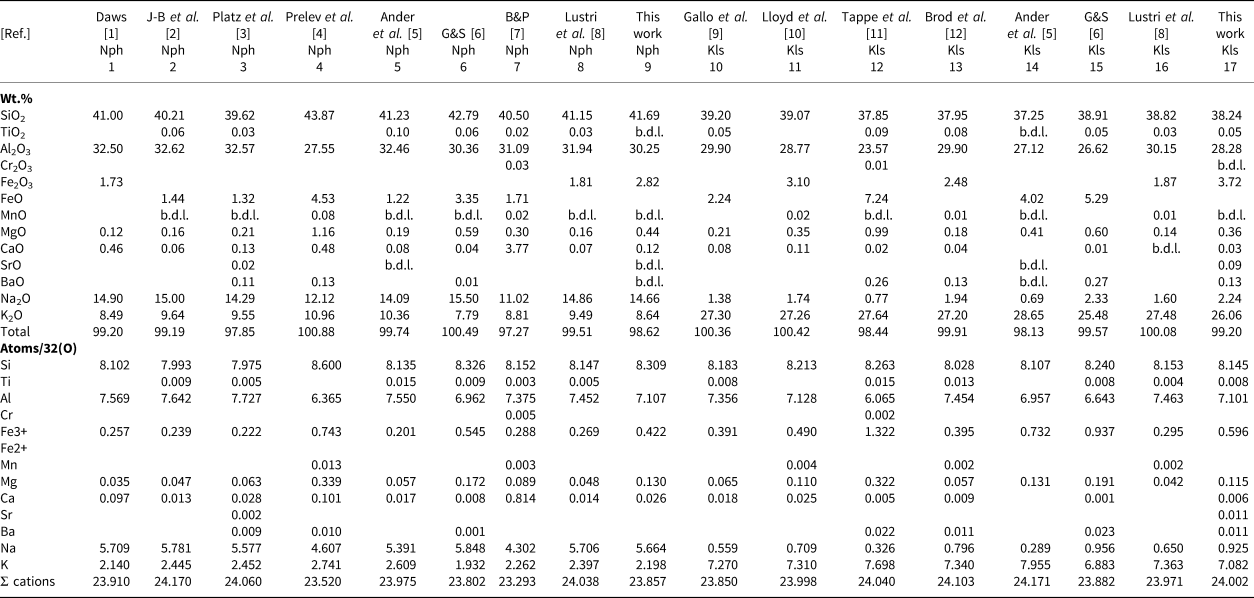
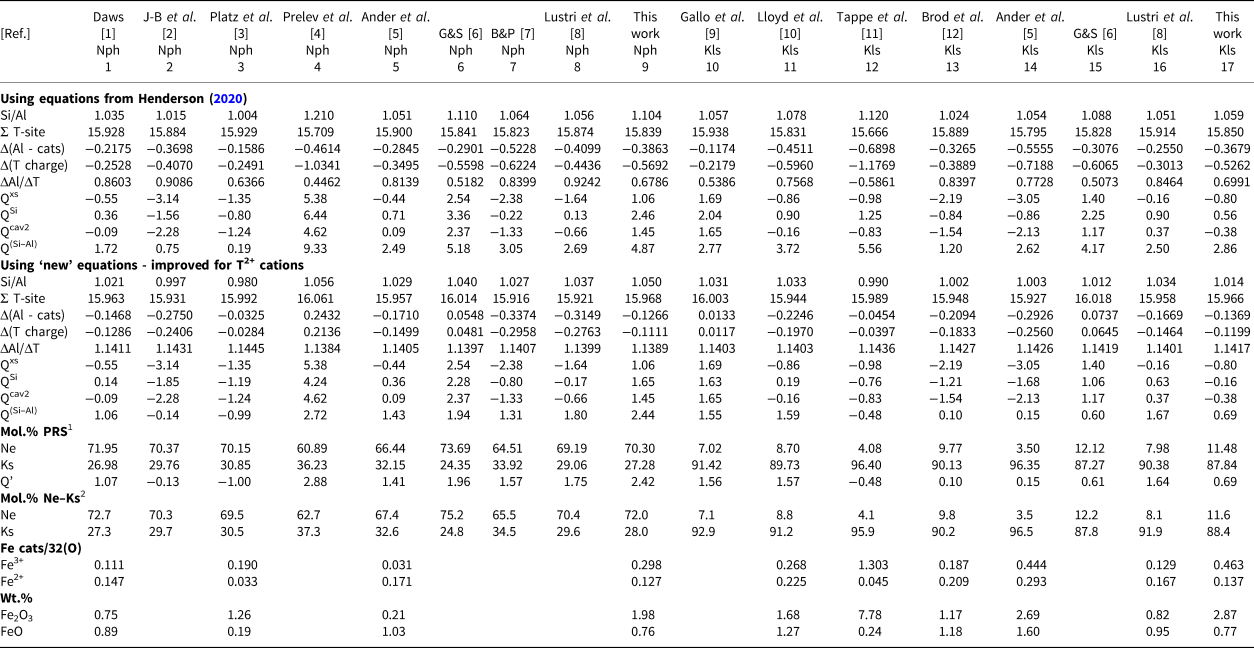
As noted by Henderson and Oliveira (Reference Henderson and Oliveira2022), the revised Spreadsheet 1 for calculation of nepheline-group minerals atomic formulae and stoichiometry parameters including the T2+ cations (e.g. Mg2+) gives more sensible compositional parameters for analyses which report MgO contents, particularly for the ΔAlcc/ΔTcharge ratio. In Table 1, we show a comparison between the values obtained for published representative Mg-rich nepheline and kalsilite compositions using both the earlier ‘old’ equations as defined by Henderson (Reference Henderson2020) and the revised spreadsheets. The analysed Fe-oxide components reported are those given in the original publications, however note that the choice of using Fe2O3 or FeO values for these EMP data is a personal choice of the analyst; in all cases the atomic formulae are given here in Table 1 with all iron as Fe3+. The atomic formulae, stoichiometry parameters, and end-member compositions are calculated with the revised spreadsheet 1 (Henderson and Oliveira, Reference Henderson and Oliveira2022) and the data for the sample set are attached here as the version denoted Spreadsheet 1A; in this spreadsheet we also show how the Fe valence could be assessed on the basis of Fe calculated as both Fe3+ or Fe2+ ‘end-members’ (see Henderson and Oliveira, Reference Henderson and Oliveira2022). Note that Spreadsheet 1A is attached to this paper as a supplementary file together with an additional file explaining how to use the EXCEL file.
Stoichiometry parameters calculated for Mg-rich nepheline and kalsilite compositions using the ‘old’ and the ‘new’ spreadsheets (see text).


1 PRS refers to Petrogeny's Residua System Ne–Ks–Quartz.
2 Ne–Ks refers to nepheline–kalsilite binary system Ne–Ks.
Abbreviations in top rows: b.d.l. below detection limit; Nph – nepheline; Kls – kalsilite.
References and sample ID: [1] Dawson (Reference Dawson1998), table 2, sample WN4421; [2] Junqueira-Brod (Reference Junqueira-Brod1998), table A4.3, 96AE08; [3] Platz et al. (Reference Platz, Foley and André2004), table 6, #96.660; [4] Prelevic et al. (Reference Prelević, Foley, Romer, Cvetković and Downes2005), suppl. dataset KAG, NV01/6; [5] Andersen et al. (Reference Andersen, Elburg and Erambert2012), suppl. table 5, S80 – nepheline / A2274 – kalsilite; [6] Gurenko and Sobolev (Reference Gurenko and Sobolev2018), suppl.2 table C1.7, #11529 – nepheline / #11497 – kalsilite; [7] Baudouin and Parat (Reference Baudouin and Parat2020), suppl. table A1, Kw5; [8] Lustrino et al. (Reference Lustrino, Ronca, Caracausi, Bordenca, Agostini and Faraone2020), suppl. table 1e, SAV8 – nepheline / SAV6 – kalsilite; [9] Gallo et al., (Reference Gallo, Giammetti, Venturelli and Vernia1984), table 1, SV16; [10] Lloyd et al. (Reference Lloyd, Huntingdon, Davies, Nixon, Kampunzu and Lubala1991), table 11, S23,160; [11] Tappe et al. (Reference Tappe, Foley and Pearson2003), table 4, C4793gm; and [12] Brod et al. (Reference Brod, Barbosa, Junqueira-Brod, Gaspar, Diniz-Pinto, Sgarbi, Petrinovic, Comin-Chiaramonti and Gomes2005), table 5, sabM01.
Table 1 shows that all ‘previous’ values of the ΔAlcc/ΔTcharge ratio are <1.0, which implies that all these analytical data should be considered unreliable. However, the ‘revised’ delta values have an average ΔAlcc/ΔTcharge ratio of 1.141 for both nepheline and kalsilite showing that these Mg-rich analyses are, actually, all reliable. It is clear that the contrasting values mentioned above are not due to the high amounts of MgO, but simply reflect the importance of correctly incorporating data for Mg (and other T2+ cations) in the stoichiometry calculation. For instance, assuming that Mg had not been specifically analysed in all previous cases, both the original and the new spreadsheets will give acceptable ΔAlcc/ΔTcharge ratios (i.e. within the 1.0–1.25 range). However, when considering the coupled substitution 2Al3+ = Mg2+ + Si4+, the excess Si′ is affected significantly if the MgO concentrations are not given (compare the values of the Q(Si–Al) parameter in Table 1, particularly for columns 4, 6, 9 and 15). The Sitotal is related directly to this coupled substitution as demonstrated by Henderson and Oliveira (Reference Henderson and Oliveira2022; table 1). Thus, robust analyses of T2+ cations (mainly Mg, though also Mn and reliably-estimated Fe2+) are essential to determine more realistic values of excess Si′, particularly, for K-rich nepheline and kalsilite crystallised from Mg-rich alkaline ultrabasic magmas (i.e. feldspar-free assemblages).
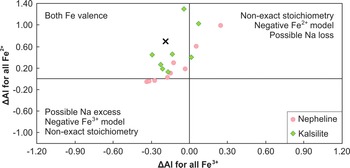
Of course, the reliability of these estimates depends on the analytical errors for all of the elements present. We have shown that overestimation of the proportion of Fe3+ cations would shift the ΔAlcc values to more negative values and overestimation of Fe2+ cations would lead to more positive values (Henderson and Oliveira, Reference Henderson and Oliveira2022); clearly the overall proportions of M + vs M 2+ cations would be equally important. In particular, the contents of divalent species for both framework and cavity cation sites are crucial as both have doubled cation coefficients for the calculation of ΔAlcc values; hence reliable determinations for Ca, Sr and Ba and Mg, Mn and Fe2+ are essential. Nepheline/kalsilite compositions showing stuffed-tridymite stoichiometry would have negative ΔAlFe3+ and positive ΔAlFe2+ values (see above) and would plot in the appropriate quadrant of Fig. 2. Those close to stoichiometry would plot in adjacent quadrants though very close to the relevant boundary axis. In addition, serious analytical errors would lead to significant departures from stuffed-tridymite stoichiometric delta parameters with both ΔAlFe2+ and ΔAlFe3+ parameters being positive or negative (see Fig. 2). However, the numerical difference between these two values (e.g. ΔAlFe2+ − ΔAlFe3+) should match the value for the total of Fe atoms. Displacement of both these delta values would define the overall nature of the framework/cavity cation valence mismatches, although if all of the divalent element species have been estimated reliably it might be that underestimation of the actual Na content is the most likely problem (see above). Thus, if the Na content is underestimated due to Na loss in the electron beam the ΔAlcc would have anomalously high positive values (see Fig. 2). Note also that a small analytical error for Na would modify the delta parameters for samples plotting in the northwest quadrant and would adjust the plotted sample in Fig. 2 to either a higher or lower Fe3+/Fe2+ apparent ratio. Clearly, high analytical accuracy for all elements is paramount.
Plot of ΔAlFe2+ vs ΔAlFe3+ values calculated for the representative compositions of K-rich nepheline and kalsilite shown in Table 1. Also plotted are data for the hypothetical composition K8Al6.94Fe3+0.69Fe2+0.19Si8.18O32 (i.e. 85KsAl:10KsFe3+:5KsFe2+ wt.% end-members; see Paper 1, table 4, composition E) as reference (black cross). Note that nepheline compositions in columns 2, 4, 6, 7, 8 and kalsilite in columns 10 and 15 of Table 1 have both ΔAlFe2+ and ΔAlFe3+ parameters either positive or negative; all these analyses have been considered reliable, however the discrepancy in their ΔAlFe2+ and ΔAlFe3+ values suggest that: (1) they do not show the exact stuffed-tridymite stoichiometry; (2) unsuitable analytical conditions may have caused some Na loss or; (3) some alteration product (Na excess) might be present.

Finally, we will consider whether the Fe valence model could be evaluated following the approach suggested in Henderson and Oliveira (Reference Henderson and Oliveira2022) with the objective of estimating possible Fe3+ and Fe2+ contents. Only reliable nepheline and kalsilite analyses with both Fe oxidation states present are likely to provide reliable results for this approach by having positive ΔAlFe2+ and negative ΔAlFe3+ values. Supplementary Spreadsheet 1A shows the compositions for representative nepheline/kalsilite analyses which have Fe reported as both FeO and Fe2O3. Nepheline analyses in Table 1 columns 1, 3, 5, 9 and kalsilites in columns 11, 12, 13, 14, 16 and 17 all have positive values for ΔAlFe2+ and negative values for ΔAlFe3+ (see Fig. 2). As shown by Henderson and Oliveira (Reference Henderson and Oliveira2022), the former numbers reflect the possible atomic proportions of Fe3+ and the latter values those for Fe2+. The pairs of values for each sample can be extracted from the spreadsheet and are summarised in the bottom portion of Table 1 together with the equivalent wt.% values of the ferric and ferrous oxides. Note that nepheline and kalsilite from the different parent rocks both have a range of Fe3+/Fe2+ ratios, however better analytical data are required to assess the significance of such estimates. This method requires rigorous analyses for all cation components, in particular the T2+ cations, however we emphasise that bulk analyses with Fe-oxide concentrations >2 wt.% would probably deliver significantly more reliable calculated delta values and, in turn, more robust excess Si values and Si/Al ratios.
Acknowledgements
This study was financed in part by the Coordenação de Aperfeiçoamento de Pessoal de Nível Superior – Brasil (CAPES) – Finance Code 001 and supported by a Brazilian National Council for Scientific and Technological Development (CNPq) doctorate scholarship (GM/GD146955/2016-1) to ILO. The first author would also like to thank Céline Baudouin for sharing her unpublished nepheline data. We are grateful to an anonymous referee for constructive comments, and also to Roger Mitchell for the detailed suggestions and thought-provoking questions.
Supplementary material
To view supplementary material for this article, please visit https://doi.org/10.1180/mgm.2022.25