Introduction
The two translationally active organelles in Plasmodium spp. – the single mitochondrion and the relict plastid (apicoplast) have emerged as important sites for exploration of drug targets against malaria. Studies in recent years have shown that a reduced machinery is sufficient to mediate essential steps of Plasmodium falciparum organellar translation (reviewed in Habib et al. Reference Habib, Vaishya and Gupta2016). Plasmodium organellar ribosomes are also predicted to deviate from bacterial ribosomes and other eukaryotic plastid and mitoribosomes (Gupta et al. Reference Gupta2014). Many ribosomal proteins (RPs) appear to be lacking in P. falciparum organellar ribosomes and several putative RPs carry insertions suggesting novel interactions within the ribosome and with assembly factors during ribosome biogenesis (Gupta et al. Reference Gupta2014). Recently available structures of plastid and mitochondrial ribosomes (Amunts et al. Reference Amunts2015; Greber and Ban, Reference Greber and Ban2016; Bieri et al. Reference Bieri2017) indicate that plastid ribosome structure resembles bacterial ribosomes, but mitoribosomes exhibit drastic variations in structure and composition, not only in comparison with their bacterial predecessors but also among different organisms. Ribosomal subunit assembly requires specific RPs that bind to folding intermediates and assembly factors that act as regulators to prevent the formation of misfolded ribosomal intermediates. In vitro and in vivo assembly intermediates together with interacting assembly factors have been primarily characterized in bacteria (Chen and Williamson, Reference Chen and Williamson2013). Assembly factors that transiently bind large and small subunits (LSU and SSU) during different steps in ribosome biogenesis include GTPases, chaperones/maturation factors and DEAD-box proteins (reviewed in Shajani et al. Reference Shajani, Sykes and Williamson2011). Putative organellar homologues for these have been listed by us earlier (Gupta et al. Reference Gupta2014) and two important GTPases (PfEngA and PfObg) were selected for this study.
The GTPase super-family comprises proteins with conserved G motifs (G1–G5). Several GTPases (EngA, Obg, Era, YihA, RbgA, RsgA) are reported to be involved in bacterial and organellar ribosome assembly (Britton, Reference Britton2009; Verstraeten et al. Reference Verstraeten2011). EngA and Obg are translation factor-related (TRAFAC) GTPases that participate in late steps of assembly of the LSU (Hwang and Inouye, Reference Hwang and Inouye2006; Jiang et al. Reference Jiang2006); their role in ribosome biogenesis was first indicated when their overexpression restored the slow growth phenotype and polysome profile of the E scherichia coli rrmJ deletion mutant (Tan et al. Reference Tan, Jakob and Bardwell2002). EngA contains two consecutive G-domains followed by a C-terminal RNA-binding KH-domain (Robinson et al. Reference Robinson2002). EngA and its orthologues have been shown to be essential for cell viability in bacteria (Verstraeten et al. Reference Verstraeten2011). EngA is not conserved in all eukaryotes (Britton, Reference Britton2009; Verstraeten et al. Reference Verstraeten2011); it is found in plant chloroplasts and in genomes of some protozoan parasites (Jeon et al. Reference Jeon2014; Suwastika et al. Reference Suwastika2014). In E. coli, EngA associates with the 50S subunit specifically when bound to GTP, rather than with the 70S ribosome or the 30S subunit (Hwang and Inouye, Reference Hwang and Inouye2006; Tomar et al. Reference Tomar2009). EngA has also been proposed to have a part in chromosome segregation, response to nutrient deprivation and cell-wall assembly (Hwang and Inouye, Reference Hwang and Inouye2008; Lee et al. Reference Lee2011). Obg has three domains – a central G-domain flanked by N- and C-terminal domains, termed OBG and OCT (Obg C-terminal), respectively (Kukimoto-Niino et al. Reference Kukimoto-Niino2004). Homologues of Obg are conserved in bacteria and in plastids and mitochondria of eukaryotes. Obg has been implicated in ribosome assembly, modulation of the general stress response, sporulation, replication, protein synthesis and cellular differentiation (Britton, Reference Britton2009). It has been reported to be associated with 50S subunits (Wout et al. Reference Wout2004), or with both 50S and 30S and also co-fractionates with 23S and 16S rRNA along with specific RPs (Sato et al. Reference Sato2005).
In order to investigate biogenesis of the reduced organellar ribosomes in P. falciparum, a comparison of bacterial and parasite apicoplast/mitochondrial RPs involved in subunit assembly was made followed by characterization of P. falciparum EngA and Obg in terms of ribosome association, DNA binding and regulation under stress. It is significant that the Plasmodium berghei EngA homologue has been identified as ‘essential’ in the recently released data on relative growth rates of gene knockout mutants in blood stages (http://www.plasmogem.sanger.ac.uk; Bushell et al. Reference Bushell2017); an Obg knockout is not yet available.
Materials and methods
Plasmodium falciparum culture and treatment
Plasmodium falciparum strain 3D7 was cultured in human erythrocytes. Parasites were maintained at 2% haematocrit in RPMI-1640 medium (Sigma-Aldrich) supplemented with 0.5% (w/v) Albumax II (Invitrogen). Permission for use of human red blood cells (RBCs) from healthy volunteers was obtained from the CSIR–CDRI Institutional Ethics Committee (Human Research) (#CDRI/IEC/CEM/21-07-2010).
Synchronized parasites at the trophozoite stage were exposed to UV (three pulses of 150 J m−2) or treated with 0.05% (v/v) methyl methanesulphonate (MMS), 10 µ m t-butyl hydroperoxide and 60 µg mL−1 hydroxyurea for 6 h. Parasites were harvested from both untreated and treated cultures and lysates were electrophoresed on sodium dodecyl sulphate–polyacrylamide gel (SDS–PAGE) followed by immunoblotting using anti-α-tubulin (1:1500, Sigma), anti-PfObg1 (1:500, described below) and anti-PfEngA (1:500, described below) antibodies (Abs).
Sequence analysis of putative organellar PfEngA and PfObg1 and homology modelling
Putative organellar ribosomal biogenesis factors were identified by extensive BLASTp (protein basic local alignment search tool) searches in the P. falciparum genome database PlasmoDB using bacterial factors as queries followed by their ClustalW alignments. Organellar targeting predictions were made on the basis of scores obtained from targeting prediction softwares PlasmoAP (http://v4-4.plasmodb.org/restricted/PlasmoAPcgi.shtml), TargetP1.1 (http://www.cbs.dtu.dk/services/TargetP), PATS (Zuegge et al. Reference Zuegge2001) and Mitoprot II–v1.101 (https://ihg.gsf.de/ihg/mitoprot.html). Protein sequences of predicted processed PfEngA and PfObg1 were subjected to BLASTp to identify PDB structures with the highest similarity to the parasite factors. The crystal structure of Thermotoga maritima EngA (PDB ID: 1MKY) (Robinson et al. Reference Robinson2002) and Thermus thermophilus Obg (PDB ID: 1UDX) (Kukimoto-Niino et al. Reference Kukimoto-Niino2004) were chosen as templates for modelling PfEngA and PfObg1, respectively. Homology models of PfEngA and PfObg1 were generated using Modeller9.14 program (Sali and Blundell, Reference Sali and Blundell1993) and Swiss-model (https://swissmodel.expasy.org/), respectively. Root-mean-square deviation (RMSD) was estimated by alignment with respective template structures on PyMol (Molecular Graphics System, Schrödinger, LLC). The final model was selected according to DOPE (discrete optimized protein energy) score and RMSD score. Structure models were further evaluated by PROCHECK; Ramachandran plot generated on PDBsum (http://www.ebi.ac.uk/pdbsum/) showed a high proportion of residues in the favoured regions (EngA, 99.2%; Obg1, 97.1%).
Recombinant expression of PfEngA and PfObg
The fragment of the gene encoding the predicted processed form of the PfEngA (394–961aa) was PCR-amplified (PCR primers in Supplementary Table S1) and cloned in pQE30 for expression as an N-terminal His6-tagged fusion protein. The insert was confirmed by DNA sequencing. E scherichia coli BL21 (DE3) cells co-transformed with the construct pQE30-PfEngA and the RIG plasmid (Baca and Hol, Reference Baca and Hol2000) were grown in Luria Bertani (LB) medium and induced with 0.5 mm isopropyl β-D-1-thiogalactopyranoside (IPTG) for 16 h at 16 °C. Induced cells were harvested and resuspended in the lysis buffer [50 mm Tris pH 8.0, 300 mm NaCl, 10% glycerol, 5 mm imidazole, 1 mm phenylmethylsulfonyl fluoride (PMSF) and 0.1% triton X-100]. PfEngA was purified in two steps – Ni-nitrilotriacetic acid (Ni-NTA) affinity chromatography using Ni-NTA superflow (Qiagen) followed by cation exchange using sulphopropyl (SP)-sepharose. His6-tagged E. coli EngA expressed from the pET28a-EcEngA construct (a gift from Dr Balaji Prakash) was purified by Ni-NTA chromatography.
Due to instability of the full-length recombinant proteins, gene fragments encoding the predicted Obg domain and G-domain of both the PfObg1 (64–548aa) and PfObg2 (243–671aa) were PCR-amplified from parasite genomic DNA (Supplementary Table S1) and cloned in pET23a for expression as C-terminal His6-tagged recombinant proteins; the clone was confirmed by DNA sequencing. PfObg1 was expressed in E. coli C41 cells in the presence of the RIG plasmid by induction with 0.5 mm IPTG at 20 °C for 16 h. Cells were resuspended in lysis buffer (50 mm Tris pH 8.0, 300 mm NaCl, 5 mm imidazole, 5% glycerol, 1 mm PMSF, 0.3% N-lauroylsarcosine) and PfObg1 was affinity purified by Ni-NTA chromatography. PfObg2 was expressed in E. coli BL21 (DE3) cells and purified similar to PfObg1. Truncated segments of PfObg1 were generated by PCR amplification (primers in Supplementary Table S1) followed by cloning in pET23a and recombinant expression in E. coli BL21-CodonPlus cells. The correct sequence of all clones was confirmed by DNA sequencing. Proteins were purified as described for PfObg1.
Antisera generation and Western blotting
Antibodies against purified recombinant proteins PfEngA, PfObg1 or PfObg2 were generated by subcutaneous immunization in rabbits as described in Haider et al. (Reference Haider2015). Permission for animal experiments was obtained from the Institute Animal Ethics Committee (IAEC/2007/126/Renew 05). Pre-immune serum was collected before administering the antigen. Antibodies were affinity-purified against the recombinant protein by nitrocellulose immobilization (Smith and Fisher, Reference Smith and Fisher1984).
For Western blotting to detect proteins in the parasite lysate, parasites were harvested from infected erythrocytes by 0.05% saponin lysis, washed with PBS, suspended in PBS containing protease inhibitor cocktail (Sigma) and boiled in 1× Laemmli buffer (0.2 m Tris–HCl pH 6.8, 2% SDS, 10% glycerol, 2% β-mercaptoethanol, 0.004% bromophenol blue). Western blotting was carried out using dilutions of the purified antibody as primary antibody and goat anti-rabbit HRP-conjugate (Sigma) as secondary antibody. Signals were detected using a chemiluminescent detection system (GE healthcare).
Immunofluorescence assay and confocal microscopy
Plasmodium falciparum-infected RBCs primarily at the trophozoite stage were processed for immunofluorescence labelling and confocal microscopy as described in Haider et al. (Reference Haider2015). After fixation, permeabilization and blocking, cells were incubated overnight in purified primary antibody dilutions [PfEngA (1:50), PfObg1 (1:100) and PfObg2 (1:100)]. Mouse anti-HUp Ab (1:200) (Ram et al. Reference Ram2008) was used as a marker for the apicoplast. After multiple washes with PBS, cells were probed with Alexa Fluor 568-tagged anti-rabbit Ig (1:1000, Invitrogen) and Alexa Fluor 488-tagged anti-mouse Ig (1:1000, Invitrogen) in 3% bovine serum albumin (BSA). For nuclear staining, 4′,6-diamidino-2-phenylindole (DAPI, 0.2 µg mL−1) prepared in PBS was added in the secondary Ab mix. For mitochondrial labelling, live cells were incubated with 50 nm Mitotracker Red CMXROS (Invitrogen) for 30 min at 37 °C prior to fixing; anti-rabbit Alexa Fluor 514-tagged Ig (1:500, Invitrogen) was used as secondary Ab for detecting proteins in Mitotracker-stained cells. Slides were viewed in the Leica SP8 confocal microscope using 63X oil-immersion objective.
Ribosome preparation
Escherichia coli 70S ribosomes were isolated from the MRE600 strain as described earlier (Rao and Varshney, Reference Rao and Varshney2001; Haider et al. Reference Haider2015). For separation of 50S and 30S subunits, 70S ribosomes were resuspended in ribosome splitting buffer [buffer S: 20 mm Tris–HCl pH 7.5, 1 mm MgCl2, 100 mm NH4Cl, 0.2 mm dithiothreitol (DTT)], loaded on 15–30% sucrose density gradient prepared in buffer S, and centrifuged at 200 000 × g for 4 h in SW41 rotor. Gradient fractions were collected and absorbance recorded at 254 nm. Fractions containing 30S and 50S subunits were pooled and dialysed with buffer A and then stored at −80 °C until use.
Ribosome-binding assay
For ribosome-binding assay using the filter trap method (Walter et al. Reference Walter2012), 30S and 50S subunits and PfEngA or PfObg1 were incubated in the ratio of 1:1 in binding buffer (20 mm Tris–HCl pH 7.5, 30 mm NH4Cl, 10 mm MgCl2) in the absence or presence of 1 mm GMPPNP (5′-guanylyl imidodiphosphate) for 30 min at room temperature. Proteins and ribosomal subunits alone were used as controls. The reaction mixture was then diluted to 500 µL with the reaction buffer and allowed to pass through a 100 kDa cut-off Centricon (Millipore) at 2000 × g for 5 min at 4 °C. The filter was washed three times with binding buffer. The complexes retained on the filter were suspended in binding buffer and analysed on SDS–PAGE followed by immunoblotting with anti-His6 Ab.
GTPase assay
Pi release after GTP hydrolysis by recombinant PfEngA and PfObg1 was measured using the EnzCheck Phosphate Assay Kit (Molecular Probes) in the presence of 1 mm GTP. GTP-alone background values were subtracted from the readings. The effect of the presence of ribosomal subunits on GTP hydrolysis by the proteins was assayed by incubating equimolar concentrations (2 µ m) of ribosome subunits and PfEngA or PfObg1. GTP alone and ribosome alone backgrounds were subtracted. Buffer composition for the GTPase assay was 60 mm Tris–HCl pH 7.6, 30 mm NH4Cl, 30 mm KCl, 10 mm MgCl2 and 2 mm DTT. K m and k cat values were calculated using GraphPad Prism software.
Electrophoretic mobility shift assay (EMSA) and chromatin immunoprecipitation (ChiP)
DNA-binding ability of recombinant PfObg1 was assayed by using fluorescein amidite (FAM)-labelled double-stranded DNA as a probe. DNA probe (1 pmol) was incubated with increasing amounts of purified PfObg1 or PfObg1-segments in DNA-binding buffer (20 mm HEPES pH 7.5, 50 mm NaCl, 1 mm DTT, 0.5 mm EDTA, 0.1 mg mL−1 BSA) in a final volume of 20 µL and incubated at room temperature for 30 min. Eighty fold molar excess of a double-stranded unlabelled 31 bp oligonucleotide was used as competitor. Major/minor groove binding was investigated by pre-incubation of the DNA probe with increasing concentrations of methyl green and DAPI, respectively, for 30 min at room temperature. For EMSA, reactions were loaded on 0.8% agarose–tris-borate EDTA (TBE) gel and electrophoresed at 50 V in 1× TBE buffer at 4 °C. Fluorescence imaging was done using ImageQuant LAS 4000 (GE Healthcare).
For ChIP, P. falciparum culture mainly at the late trophozoite stage was processed according to the method described by Ram et al. (Reference Ram2008). Plasmodium falciparum culture was subjected to protein–DNA crosslinking using 1% (v/v) formaldehyde at 37 °C for 15 min. Crosslinking reaction was stopped by adding glycine to a final concentration of 0.125 mm. Parasites were released by 0.05% (w/v) saponin lysis and washed twice with 1× PBS. Cells were re-suspended in 1 mL ChIP buffer [30 mm Tris–HCl pH 8.0, 150 mm NaCl, 1 mm EDTA, 0.5% (v/v) Triton X-100 and 1% (v/v) Igepal®, Sigma] and kept on ice for 20 min, sonicated nine times at 30% amplitude for 10 s each with 1 min cooling between sonications (SONICS vibra cell). After centrifugation at 14 000 × g for 10 min at 4 °C, the supernatant containing soluble chromatin was pre-cleared with 50 µL of 50% Protein A sepharose CL-4B (GE Healthcare) and 20 mg of sheared salmon-sperm DNA for 2 h at 48 °C. The beads were pelleted at 10 000 × g for 2 min. Pre-immune serum or anti-PfObg1 serum (1:50 dilution) was added to the supernatant and incubated at 4 °C for 2 h. 50 µl of 50% Protein A sepharose and 20 mg salmon-sperm DNA was added to the mixture and incubated overnight at 4 °C with continuous mixing. The sepharose beads were pelleted at 400 × g at 4 °C for 1 min and washed three times with ChIP buffer. This was followed by two washes with 1× Tris–EDTA (TE) and one wash with 1× TE containing 0.01% SDS. Chromatin was eluted using 1× TE supplemented with 1% SDS. Eluted chromatin was reverse cross-linked for 6 h at 65 °C and treated with proteinase K (20 mg) for 2 h at 37 °C. DNA was extracted with phenol–chloroform followed by ethanol precipitation. DNA from input and ChIP samples was used as a template for PCR amplification. Primers (Supplementary Table S1) for the nuclear gene encoding putative PfIscA, two mtDNA fragments and an apicoplast DNA sequence encoding putative Rpl16 were used to amplify nuclear, mitochondrial and apicoplast DNA, respectively. The PCR products were analysed on 1.5% agarose gel.
Ribosome pull-down and quantitative real time (qRT)–PCR
Parasites (primarily trophozoites) from a culture with 10–15% parasitaemia were harvested by 0.05% (w/v) saponin lysis. Parasites were resuspended in radioimmunoprecipitation assay (RIPA) buffer (0.05 M Tris–HCl pH 7.4, 0.15 M NaCl, 0.25% deoxycholic acid, 1% Nonidet P-40, 1 mm EDTA) and kept on ice for 45 min. The lysate was cleared by centrifugation and the supernatant was pre-cleared with 50 µL of 50% Protein A sepharose CL-4B beads for 2 h at 4 °C. The beads were pelleted at 10 000 × g for 2 min. The supernatant was incubated with pre-immune serum, anti-PfEngA serum or anti-PfObg1 serum (1:50 dilution) at 4 °C for 2 h. 50 µL of 50% Protein A sepharose slurry was added to the mixture and incubated overnight at 4 °C with continuous mixing. The sepharose beads were pelleted at 400 × g at 4 °C for 1 min and washed five times with RIPA buffer. This was followed by RNA extraction using RNA miniprep system (Promega) with DNase I treatment. Superscript-II first strand synthesis kit (Invitrogen) was used for cDNA synthesis. Primers specific for mitochondrion and apicoplast small and large subunit rRNA were designed (Supplementary Table S1). qRT–PCR was performed with LightCycler® FastStart DNA MasterPLUS SYBR GreenI (Roche) on a LightCycler 1.5 system (Roche) (45 cycles with denaturation, 95 °C, 10 s; annealing, 54 °C, 5 s; extension, 72 °C, 10 s). Abundance of mitochondrion SSUA (PlasmoDB ID mal_rna_11) and LSUE (PlasmoDB ID mal_rna_17) rRNA as well as apicoplast 16S (PlasmoDB ID PF3D7_API05700) and 23S (PlasmoDB ID PF3D7_API04900) rRNA was determined. Fold-enrichment of immunoprecipitated organellar ribosome subunits (as measured by corresponding rRNA) by anti-PfEngA and anti-PfObg1 serum relative to the pre-immune serum was calculated from ΔC t values. Statistical analysis was performed by two-way ANOVA.
Results
Comparison of Plasmodium organellar RPs with bacterial homologues involved in subunit assembly
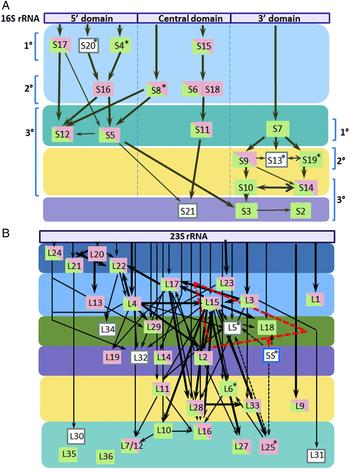
The sequential assembly of bacterial ribosomes was first demonstrated by in vitro reconstitution experiments by Traub and Nomura (Reference Traub and Nomura1968) leading to the generation of the Nomura assembly map for the 30S subunit. Assembly intermediates detailing protein-binding interdependence for the 50S subunit were identified by Nierhaus and Dohme (Reference Nierhaus and Dohme1974) and slightly modified in vivo assembly maps were generated subsequently (Chen and Williamson, Reference Chen and Williamson2013). We overlaid P. falciparum apicoplast and mitochondrial RPs, identified earlier by bioinformatics approaches (Desmond et al. Reference Desmond2011; Gupta et al. Reference Gupta2014), on the modified assembly maps (Fig. 1). Three primary rRNA-binding proteins of the 30S subunit (S4, S7, S20) are missing in the mitochondrion (Fig. 1A). S4 and S20 are known to be absent in mammalian mitochondria (Amunts et al. Reference Amunts2015; Greber and Ban, Reference Greber and Ban2016) and the rRNA regions they interact with are truncated in mammalian mitochondrial SSU rRNA (Amunts et al. Reference Amunts2015) as well as fragmented mitochondrial rRNA of P. falciparum (Feagin et al. Reference Feagin2012). Although S20 is present in plastids, an apicoplast S20 is not found (Gupta et al. Reference Gupta2014; Bieri et al. Reference Bieri2017). Three secondary binding proteins – S13, S16 and S18 that interact with primary binders are missing in the apicoplast. Tertiary binders to the 3′ domain of rRNA are poorly represented in the parasite mitoribosome and the central domain tertiary binder S21 is not identified for both parasite organelles. The absence of the sole primary binder S7 and low representation of secondary and tertiary binders of the 3′ domain of P. falciparum mitochondrial rRNA suggests important differences in assembly compared with the bacterial SSU.
Plasmodium falciparum organellar ribosomal proteins involved in subunit assembly. (A) Overlay of apicoplast (green) and mitochondrial (pink) putative SSU proteins on the modified Nomura assembly map showing interaction with main fragments of the 16S rRNA. Primary, secondary and tertiary binders are shown. (B) Apicoplast and mitochondrial LSU protein homologues overlaid on the modified Nierhaus assembly map depicting interaction with 23S rRNA. Coloured boxes indicate assembly groups identified from increasingly dense fractions in sucrose density gradients (Chen and Williamson, Reference Chen and Williamson2013). Proteins enclosed by red-dashed box are essential for interaction with 5S rRNA in bacteria. Empty boxes indicate LSU/SSU protein homologues that are missing in both apicoplast and mitochondrion of P. falciparum. *Proteins are known to be absent in mammalian mitochondrial ribosomes. Thick and thin lines depict strong and weak protein-binding cooperativities, respectively; dotted lines represent interactions with 5S rRNA.
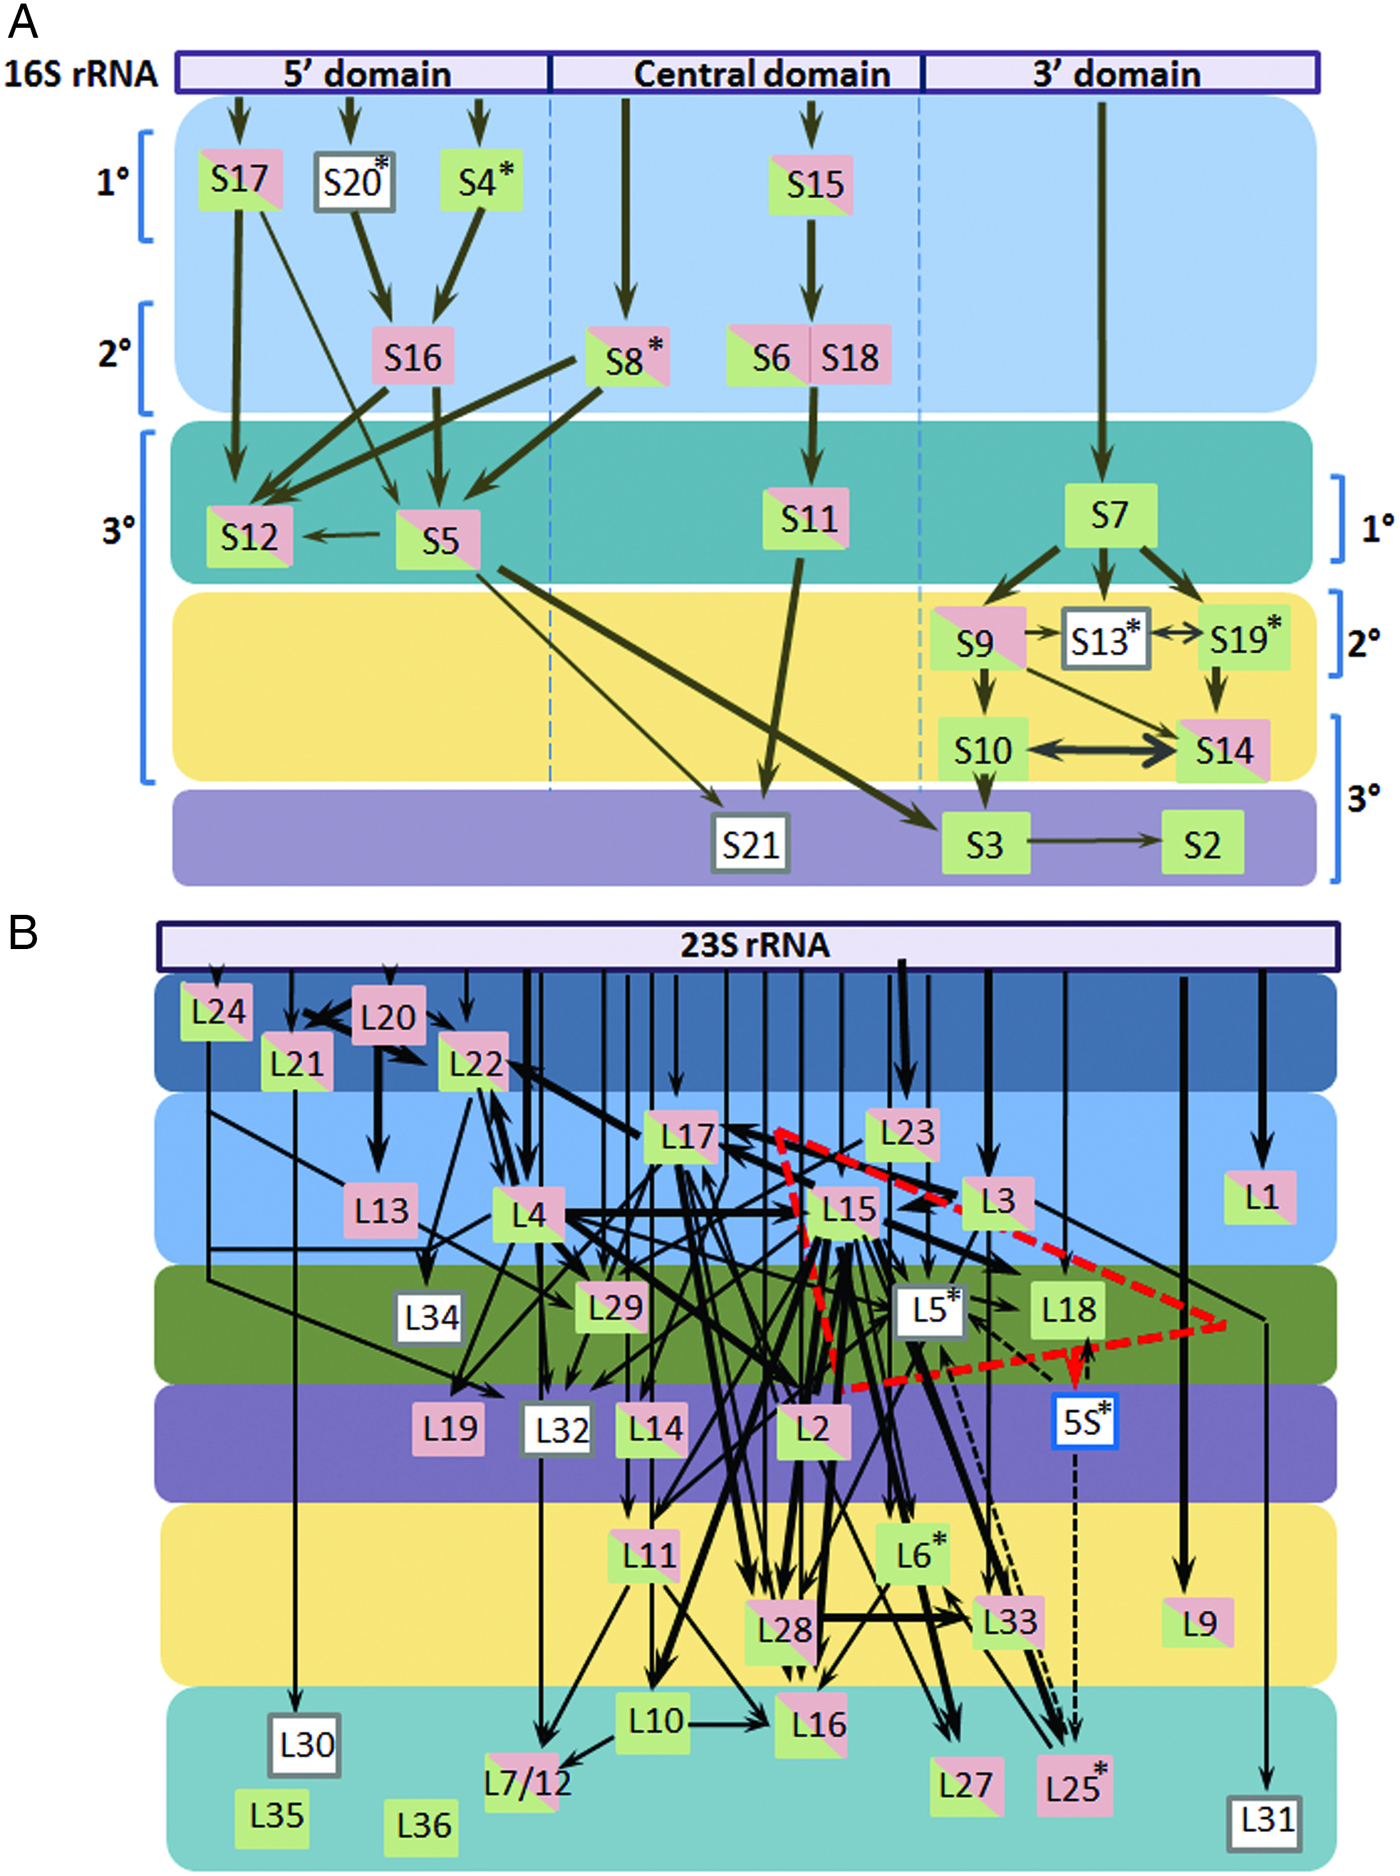
Homologues for all primary binders of LSU rRNA are identified for the P. falciparum mitochondrion but the apicoplast is predicted to lack L13 and L20 (Gupta et al. Reference Gupta2014) (Fig. 1B). Even though domain I is absent in mitochondrial LSU rRNA across species, the primary domain I-interacting proteins L4, L22 and L24 are conserved in mitochondria including that of P. falciparum (Feagin et al. Reference Feagin2012; Greber and Ban, Reference Greber and Ban2016). A gene for 5S rRNA is not identified in P. falciparum organelle genomes suggesting that both apicoplast and mitochondrial ribosomes lack this small rRNA (Habib et al. Reference Habib, Vaishya and Gupta2016). 5S rRNA is also not found in yeast and mammalian mitochondria (Greber and Ban, Reference Greber and Ban2016) but is a component of plastid ribosomal LSU (Bieri et al. Reference Bieri2017). Consistent with its absence in Plasmodium organelles, proteins L5 and L18 that bind the 5S rRNA are not identified for P. falciparum mitochondria and L5 is also missing in the apicoplast (Gupta et al. Reference Gupta2014). Homologues of several LSU proteins involved in subsequent assembly steps are not predicted to be part of the parasite apicoplast and mitochondrial ribosomes; L19, L25, L30–32, L34 and L6, L30–32, L34–36 seem to be missing in the apicoplast and mitochondrial ribosomes, respectively (Fig. 1B). The large numbers of mitoribosome-specific proteins in yeast and mammals have been suggested to structurally compensate for missing rRNA segments during assembly in addition to the expansion of functional roles. The structural heterogeneity of yeast and mammalian mitoribosomes (Greber and Ban, Reference Greber and Ban2016) and the absence of homologues for most mitoribosome-specific proteins in P. falciparum (Gupta et al. Reference Gupta2014), suggests the possibility that as yet unidentified Plasmodium-specific mitoribosomal proteins might contribute to subunit assembly.
EngA and Obg are putative organellar ribosome assembly factors
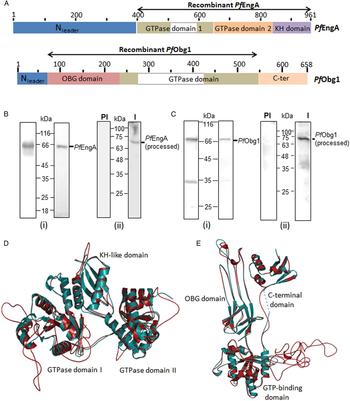
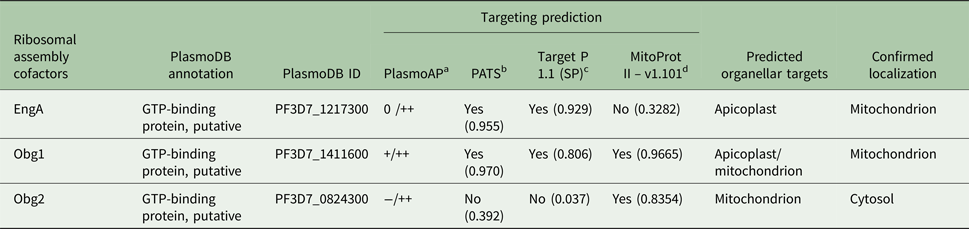
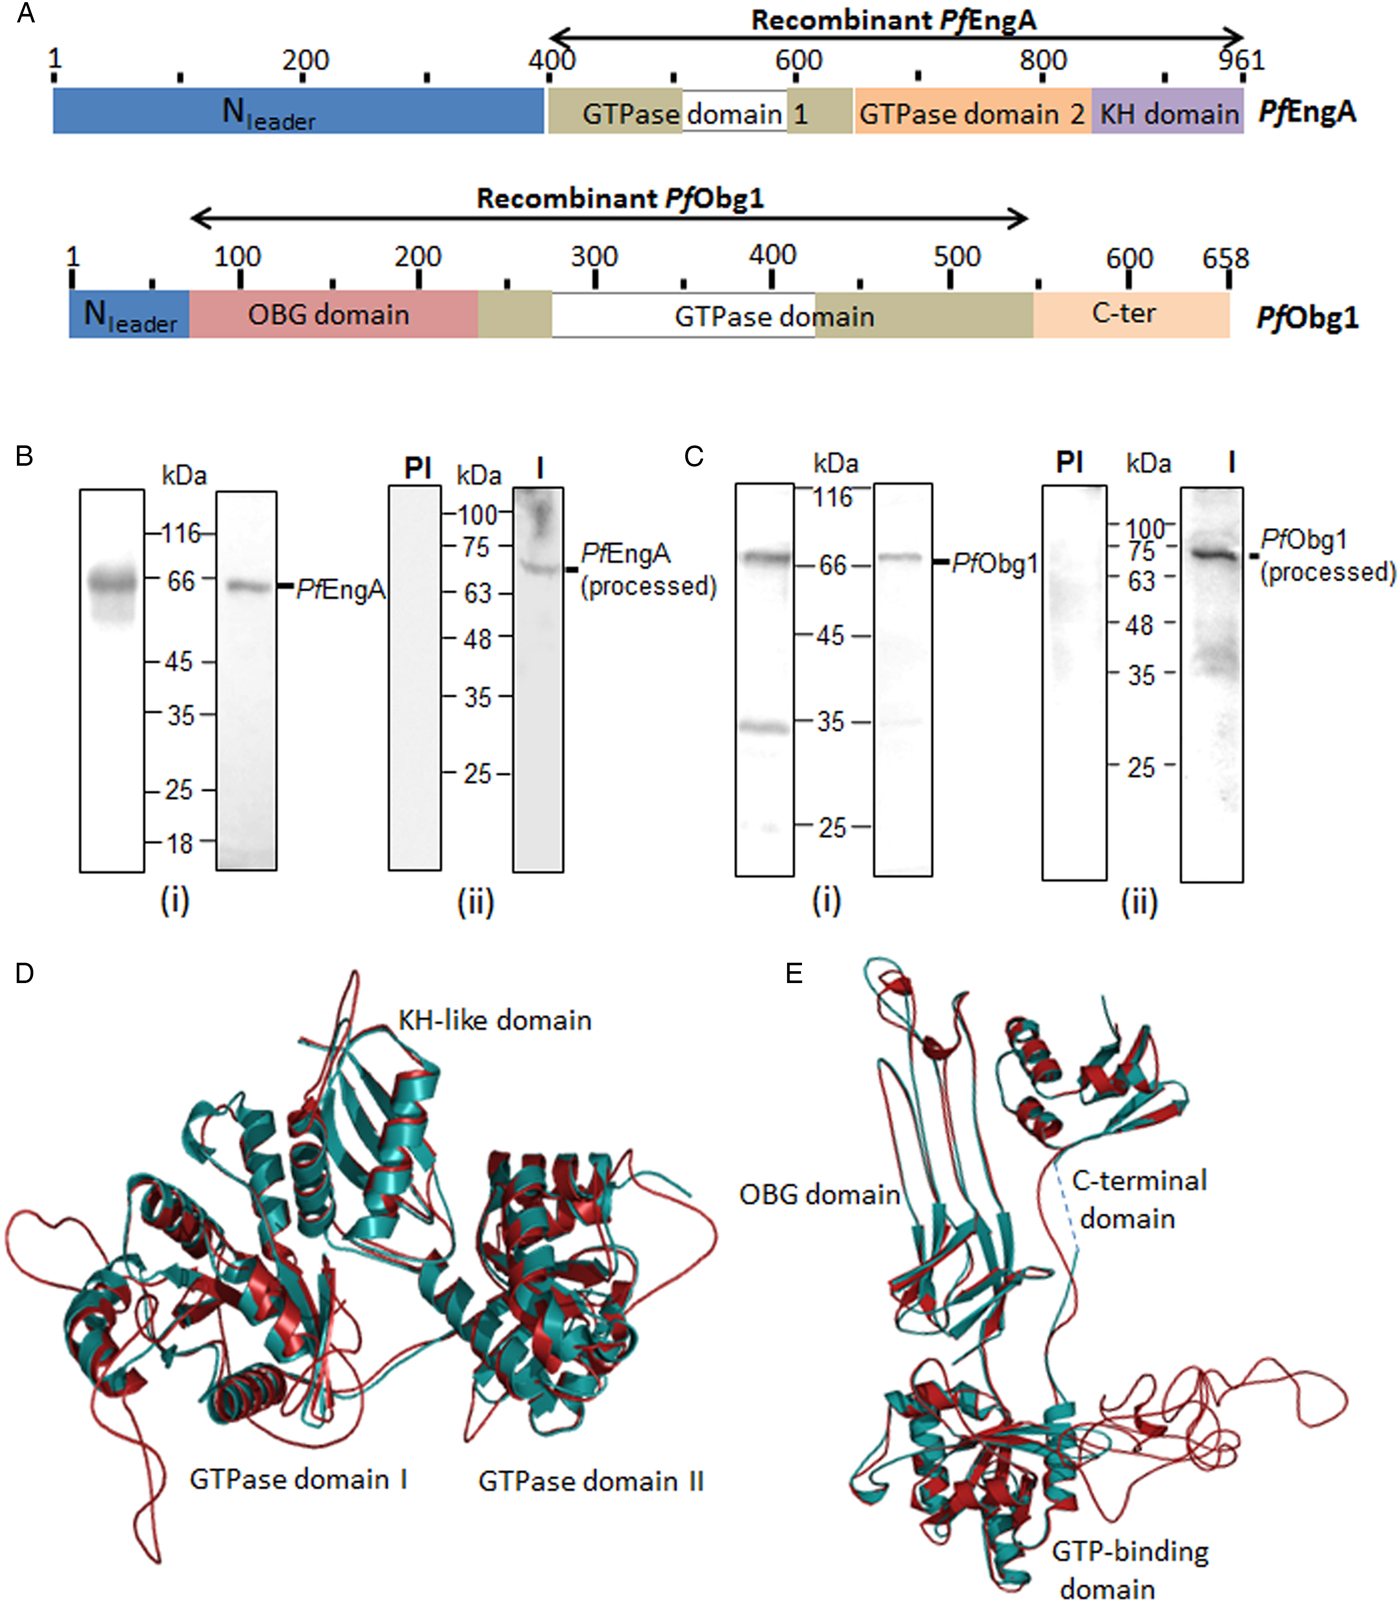
Initial identification of putative assembly factors (GTPases, maturation factors and chaperones) encoded by the P. falciparum nuclear genome together with predictions for organellar targeting identified two homologues each of EngA and Obg (Gupta et al. Reference Gupta2014). Among these, a protein previously marked as EngA homologue (PF3D7_0313500) (Gupta et al. Reference Gupta2014) has only one G-domain and has now been reported to be a non-canonical Ras-like GTPase with cytosolic localization (Kaiser et al. Reference Kaiser2015). A single EngA candidate (PlasmoDB ID PF3D7_1217300, PfEngA) is identifiable on the basis of sequence similarity with bacterial EngA. PfEngA is currently annotated as ‘GTP-binding protein, putative’ in the Plasmodium database (http://www.plasmodb.org). Unprocessed PfEngA has a size of ~113.4 kDa and exhibits 33% identity with T. maritima and E. coli EngA, with sequence conservation in functional domains GD1, GD2 and the KH domain (Fig. 2A). ClustalW alignment revealed the presence of a long (~393 aa) N-terminal extension and a ~85 aa insertion located within GD1 (Supplementary Fig. S1, Fig. 2A). Targeting prediction was undecided to positive for a signal peptide with strong transit peptide prediction suggesting the presence of an N-terminal bipartite leader sequence required for apicoplast targeting (Foth et al. Reference Foth2003) (Table 1). A mitochondrial targeting sequence was not recognizable.
Recombinant expression of PfEngA and PfObg1 and their structure models. (A) Schematic representation of major domains of PfEngA and PfObg1 and the regions expressed as recombinant proteins. Amino acid numbers are shown. (B) Purified recombinant PfEngA (i) visualized in a Commassie-stained gel (left panel) and Western blot with anti-His6 Ab (right panel). (ii) Anti-PfEngA antibody (I) recognizes a specific band in P. falciparum lysate (right panel) with no signal seen with pre-immune (PI) serum (left panel). (C) Purified recombinant PfObg1 (i) in a Coomassie-stained gel (left panel) and Western blot probed with anti-His6 Ab (right panel). (ii) A ~71 kDa band is recognized by anti-PfObg1 antibody (I) in Western blots (right panel). No signal is seen with the control pre-immune serum (PI). (D) Structure of PfEngA (deep teal) modelled on X-ray crystal structure of Thermotoga maritima EngA (cyan). (E) PfObg1 (deep teal) modelled on the X-ray crystal structure of Thermus thermophilus Obg (cyan). Insertions in the P. falciparum proteins appear as unstructured loops.
Putative EngA and Obg homologues in Plasmodium falciparum and their organelle targeting predictions

a PlasmoAP predicts signal and transit peptide for apicoplast targeting. PlasmoAP output of‘ + +’, ‘ + ’, ‘0’ and ‘−’ indicates ‘very likely’, ‘likely’, ‘undecided’ and ‘unlikely’ predictions, respectively for signal/transit peptide.
b PATS predicts targeting to P. falciparum apicoplast.
c Target P1.1 predicts subcellular location of proteins.
d MitoProtII predicts mitochondrial targeting sequences.
Two putative organellar Obg homologues were identified; PF3D7_1411600 and PF3D7_0824300 are both currently annotated as ‘GTP-binding protein, putative’ in PlasmoDB. PF3D7_1411600 (PfObg1, ~77 kDa) and PF3D7_0824300 (PfObg2, ~91.2 kDa) have 28% and 21% identity, respectively, with B. subtilis Obg (Supplementary Figs S2 and S3). A GTPase-domain, N-terminal OBG domain and C-ter domain were identified in PfObg1 (Fig. 2A, Supplementary Fig. S2) and PfObg2 (Supplementary Fig. S3 and S4). Both proteins carry N-terminal extensions. Targeting predictions for PfObg1 suggested that it might be an apicoplast or mitochondrial protein (Table 1). PfObg2 lacks a signal peptide with an ambiguous prediction for the presence of a transit peptide. Positive prediction for a mitochondrial targeting element suggested that PfObg2 might represent a mitochondrial Obg (Table 1).
PfEngA and PfObg1 are targeted to the mitochondrion
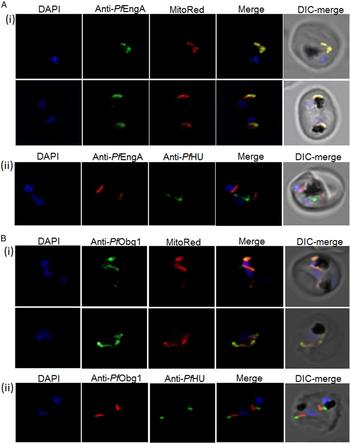
PfEngA (394–961 aa) carrying an N-terminal His6-tag was overexpressed in E. coli as a recombinant protein of ~66 kDa (Fig. 2B). Antibodies generated against the purified protein recognized a ~66 kDa protein in Western blot of parasite lysate. Full-length PfEngA was not visible and the single band corresponds to the size expected for the conserved region PfEngA without its long N-terminal extension (Fig. 2B). Subcellular localization of PfEngA was determined by using purified anti-PfEngA antibodies in immunofluorescence assays with anti-PfHU antibody as apicoplast marker, and Mitotracker Red as the mitochondrial marker dye. Confocal microscopy showed that the PfEngA signal overlaps with Mitotracker Red and does not co-localize with the PfHU signal (Fig. 3A). This indicates that PfEngA is a mitochondrial protein, contrary to in silico prediction for its apicoplast targeting.
PfEngA and PfObg1 are targeted to the parasite mitochondrion. PfEngA and PfObg1, detected by anti-PfEngA (A) and anti-PfObg1antibodies (B), colocalize with Mitotracker Red (i) and not with the apicoplast marker PfHU detected using anti-PfHUp antibodies (ii).
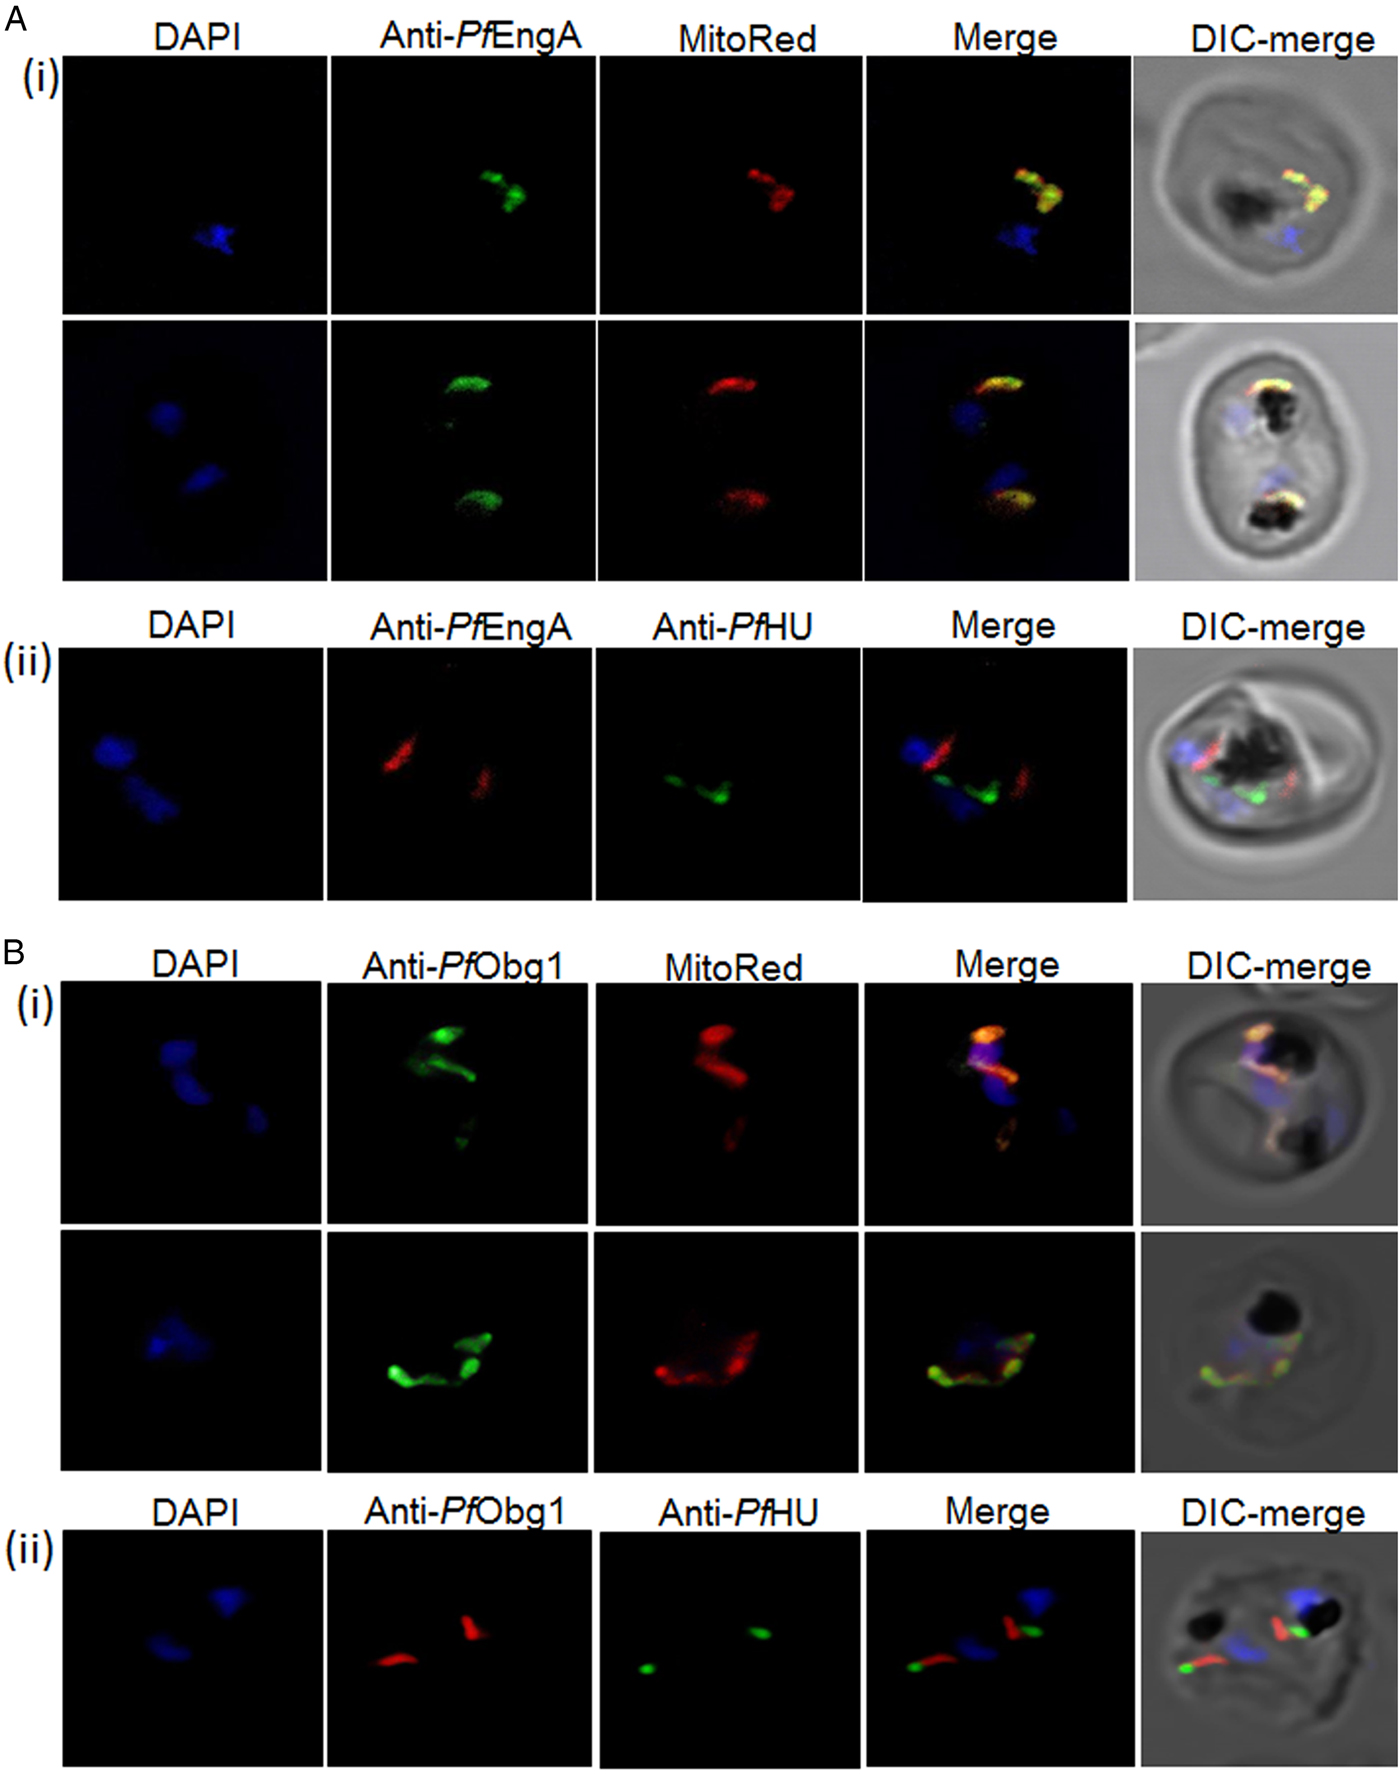
We attempted recombinant expression of predicted processed PfObg1 lacking the N-terminal leader but were unsuccessful in attaining a stable protein. Instability was probably due to the C-terminal domain as it was predicted to have a disordered structure (analysed by DISOPRED software). Since the OBG and GTPase domains in Obg are highly conserved and have been reported to show GTPase activity and keep E. coli growth intact even in the absence of the unconserved C-terminal domain (Buglino et al. Reference Buglino2002), a C-terminally truncated PfObg1 (64–548 aa) was expressed. Recombinant PfObg1 carries an N-terminal His6-tag and has an expected size of 59 kDa. Purified recombinant protein migrated at a size ~10 kDa higher than expected with a likely degradation product at ~32 kDa (Fig. 2C). Peptide mass fingerprinting of the purified protein established its correct identity (Supplementary Table S2). Antibodies raised against the protein recognized a ~70 kDa band in Western blot of parasite lysate (Fig. 2C), possibly representing the N-ter processed form of the protein. Subcellular localization of PfObg1 by immunofluorescence assays using purified anti-Obg1 antibodies showed the clear overlap of the mitochondrial dye and PfObg1 signal [Fig. 3B(i)]. No overlap was seen with the apicoplast marker PfHU [Fig. 3B(ii)] indicating that PfObg1 localized exclusively to the P. falciparum mitochondrion. MitoProtII software predicts a long N-ter targeting leader of 49 aa which would indicate that processed PfObg1 has a size of 71 kDa, as also detected in the parasite lysate. Thus, PfEngA and a single Obg (PfObg1) are targeted to the mitochondrion, with no apicoplast counterparts identified for these ribosome assembly GTPases.
Structural conservation of functional domains
Since both PfEngA and PfObg1 exhibit limited identity with bacterial homologues, homology modelling of PfEngA and PfObg1 was carried out using known crystal structures as a template. Structure modelling of PfEngA on the T. maritima GDP-bound EngA crystal structure (PDB ID: 1MKY) (Robinson et al. Reference Robinson2002) revealed extensive fold conservation in PfEngA domains (Fig. 2D). GD1 and GD2 domains pack on either side of the C-terminal KH domain. The nucleotide-binding site of GD1 is at the GD1–KH domain interface while the GDP-binding site of GD2 is distal to the GD2–KH domain interface. Both GD1 and GD2 of PfEngA have conserved G1–G5 boxes and have 26% identity with each other. The 85 aa insertion between the G3 and G4 boxes in GD1 could not be modelled as it lacked significant identity with any known protein.
PfObg1 modelled on the crystal structure of T. thermophilus Obg (PDB ID: 1UDX) (Kukimoto-Niino et al. Reference Kukimoto-Niino2004) also showed conservation of functional domains (Fig. 2E). The N-terminal domain is essential for correct folding and functionality of Obg proteins. The unique ‘Obg fold’ of the domain is rich in glycine residues (Buglino et al. Reference Buglino2002); the P. falciparum Obg domain contains 22 glycines and folds as six type II helices and an eight-stranded β-barrel. The highly conserved GTP-binding domain shares overall topology with small Ras-like GTPases with a six-stranded β-sheet and five α-helices. The GTPase domain of PfObg1 contains a long insertion of 160 aa that could not be modelled and appears as a loop in the structure. The C-terminal domain of Obg proteins is not conserved among different species. Even though PfObg1 and TtObg C-terminal domains have low sequence identity, the domain models well on the TtObg structure.
PfEngA and PfObg1 associate with P. falciparum mitochondrial ribosomes
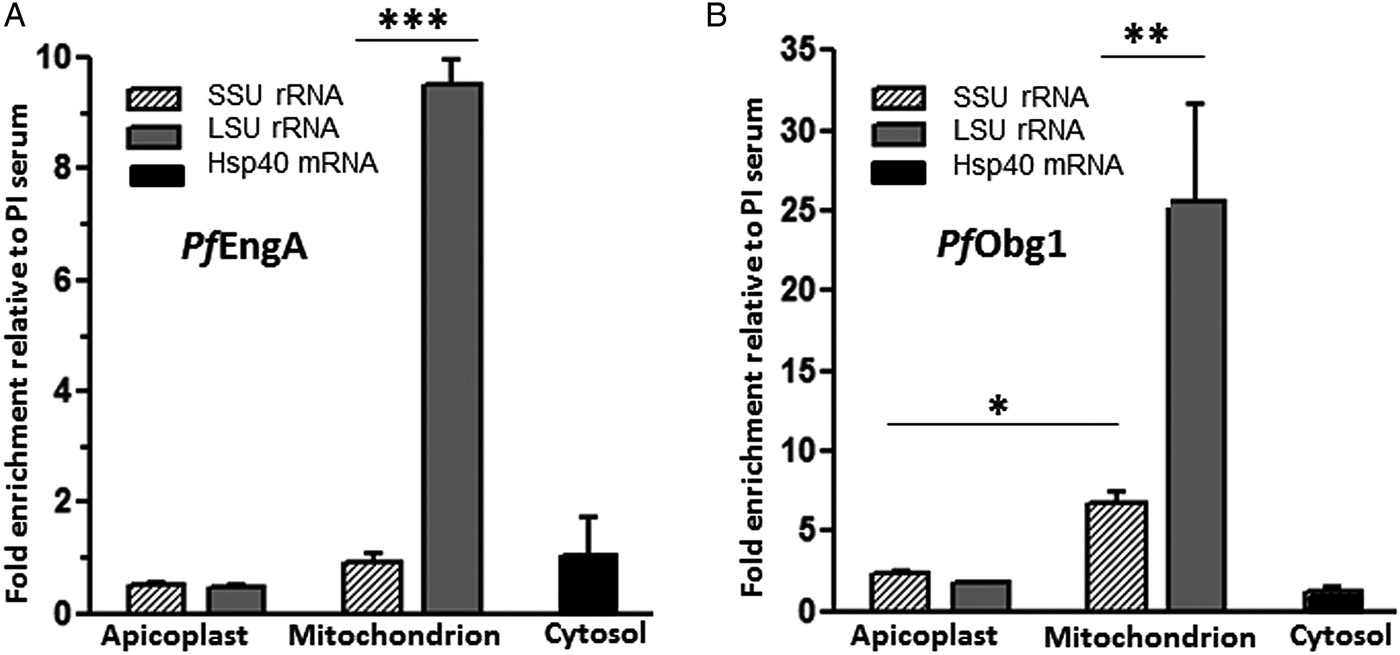
To determine whether PfEngA and PfObg1 interact with mitoribosomal subunits, we used anti-PfEngA and anti-PfObg1 serum to pull-down interacting ribosomes from parasite lysate followed by RNA extraction and quantitation of LSU and SSU rRNA by qRT–PCR. Enrichment for apicoplast LSU and SSU (LSUapi, SSUapi) rRNA and nuclear-encoded mRNA for PfHsp40 was also determined with pull-down using pre-immune serum serving as background. Enrichment of mitochondrial LSU (LSUmit) rRNA by anti-PfEngA antiserum indicated specific co-immunoprecipitation of P. falciparum LSUmit, with no interaction observed with mitochondrial SSU (SSUmit) (Fig. 4A). qRT-PCR results after pull-down with anti-PfObg1 serum indicated that PfObg1 binds with both LSUmit and SSUmit with significantly higher binding (about 3-fold, P < 0.01) with LSUmit compared with SSUmit (Fig. 4B). LSUapi, SSUapi and PfHsp40 mRNA were not pulled down by either anti-PfEngA or anti-PfObg1 serum (Fig. 4A and B) demonstrating that PfEngA and PfObg1 interact specifically with mitochondrial ribosomes. PfEngA binds LSUmit alone while PfObg1 displays preferential binding to LSUmit with minimal interaction with SSUmit.
Parasite mitochondrial ribosomes are co-immunoprecipitated by anti-PfEngA and anti-PfObg1 Abs. Fold-enrichment of cytosolic mRNA and SSU and LSU rRNA of apicoplast and mitochondria using anti-PfEngA (A) and anti-PfObg1 (B) sera over the pre-immune serum was determined by quantitative-PCR. Mean and standard deviation from replicate determinations is plotted. *P < 0.05; **P < 0.01; ***P < 0.001 by ANOVA.

Intrinsic GTPase activity of PfEngA and PfObg1
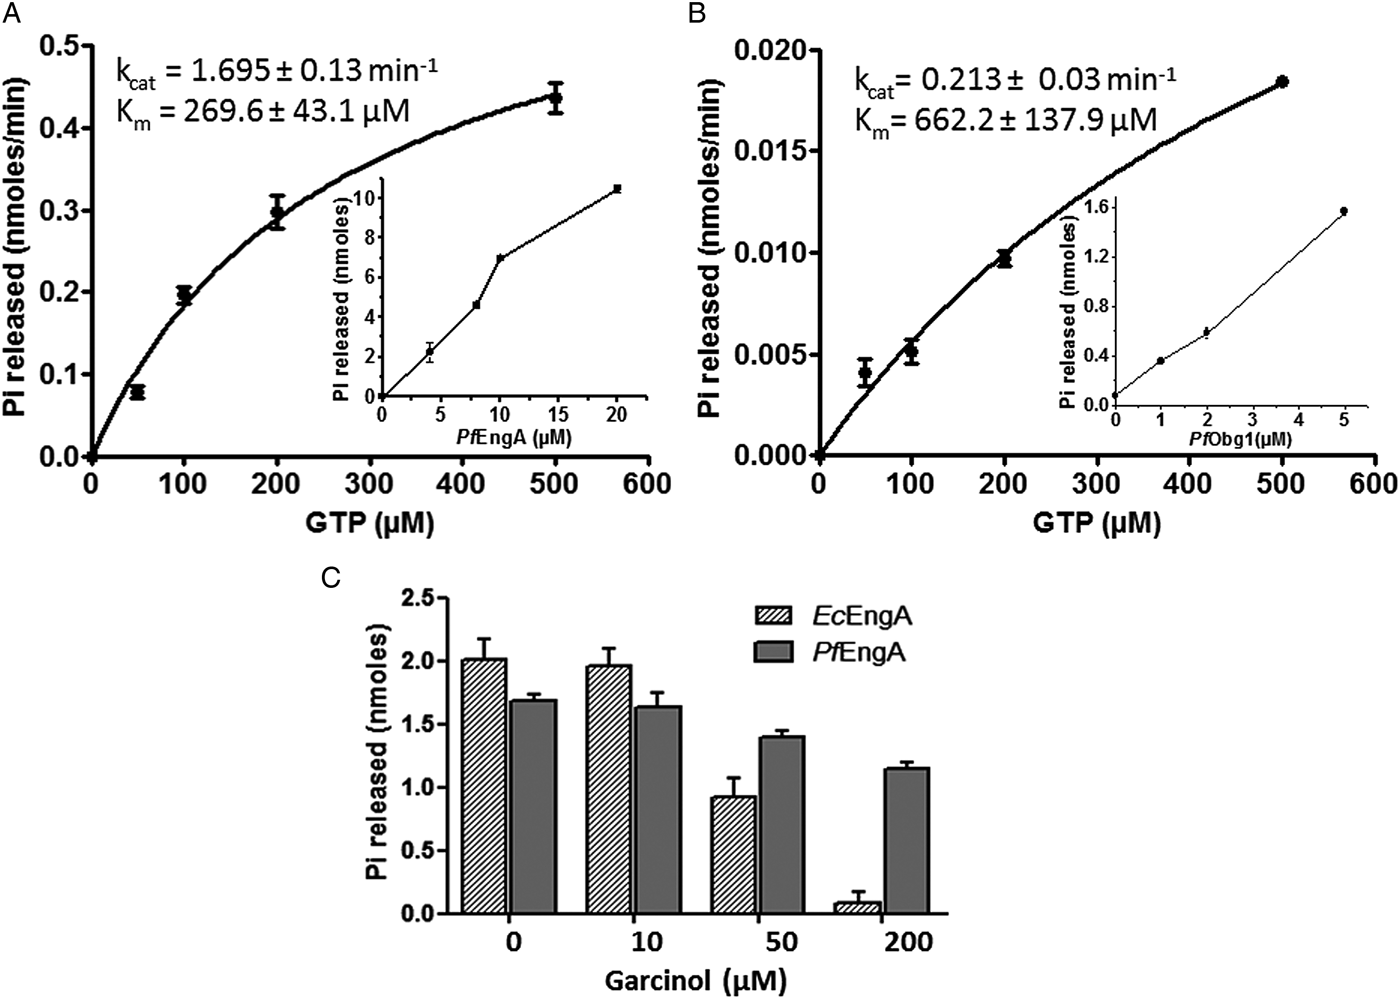
To determine whether PfEngA and PfObg1 function as GTP hydrolysing enzymes, GTP-dependent Pi release by the purified recombinant proteins was measured (Fig. 5A, B). GTPase activity increased as a function of PfEngA and PfObg1 concentration (inset graphs). K m and k cat values for PfEngA were 269.6 ± 43.1 µ m and 1.695 ± 0.13 min−1, respectively (Fig. 5A). This represents the combined activity of both GD1 and GD2. PfObg1 has a relatively lower k cat value of 0.213 ± 0.03 min−1 with a K m of 662 ± 137.9 µ m (Fig. 5B).
GTP hydrolysis by PfEngA and PfObg1. GTPase activity of 2 µ m each of PfEngA (A) and PfObg1 (B) plotted as a function of increasing GTP concentration. K m and k cat values determined from the plots are shown. Inset graphs show GTP hydrolysis with increasing concentrations of protein. (C) Inhibition of GTPase activity of PfEngA and EcEngA by increasing concentrations of garcinol. Mean and standard deviation from replicates is plotted.

Four potential inhibitors that suppress GTP hydrolysis of E. coli EngA have been reported (Bharat et al. Reference Bharat, Blanchard and Brown2013). One of these inhibitors, garcinol with a reported IC50 of 14.3 µ m against EcEngA, was tested for its ability to inhibit PfEngA. Interestingly, upto 200 µ m garcinol inhibited PfEngA activity by only ~30% while EcEngA was completely inhibited at this concentration (Fig. 5C). This is suggestive of structural differences between G domains of E. coli and P. falciparum EngA. Although the binding site of garcinol in EcEngA is not known, the presence of a long insertion in PfEngA GD1 might have a role in the differential inhibition exhibited by the compound.
Assembly factor–ribosome interactions and GTP hydrolysis
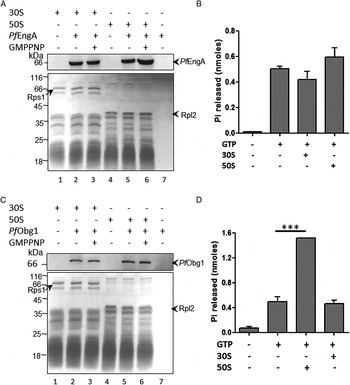
The possible role of GTP in regulating binding of PfEngA and PfObg1 with ribosomal subunits was investigated. As Plasmodium mitoribosomes deviate from other eukaryotic mitochondrial ribosomes as well as bacterial ribosomes, we selected E. coli ribosomes that have been used earlier for functional characterization of Plasmodium organellar translation factors as a surrogate. Interaction of purified recombinant proteins with E. coli ribosome subunits was assayed by the filter-trap method (Haider et al. Reference Haider2015). PfEngA and PfObg1 alone passed through the filter and were not detected in control lanes (Fig. 6A, C). PfEngA exhibited comparable binding to 50S and 30S subunits in the absence of the non-hydrolysable GTP analogue GMPPNP (Fig. 6A, lanes 2 and 5). However, the presence of GMPPNP significantly increased its interaction with the 50S (Fig. 6A, lanes 5 and 6, top panel) (P < 0.05 from three repeat experiments) but not the 30S subunit (Fig. 6A lanes 2 and 3), indicating that GTP binding to PfEngA G-domains might alter protein conformation for improved binding to the LSU. PfObg1 interacted similarly with both 30S and 50S subunits and this interaction was not enhanced by the presence of GMPPNP, indicating that PfObg1–ribosome association is independent of nucleotide binding (Fig. 6C). Glutathione-S-transferase (GST), used as a non-ribosome-binding protein control, did not interact with the ribosome (Supplementary Fig. 4); PfEngA and PfObg1 were not retained on the filter when incubated with E. coli lysate from which large molecular complexes had been removed by prior filtration through 100 kDa cut-off membrane, indicating specificity of E. coli ribosome-assembly protein interaction (Supplementary Fig. 4). Nucleotide-independent binding of PfObg1 to the ribosome is similar to E. coli and Caulobacter crescentus as opposed to Bacillus subtilis Obg that co-fractionates with ribosomes in a GTP-dependent fashion (Wout et al. Reference Wout2004).
Interaction of Plasmodium falciparum ribosome assembly GTPases with surrogate Escherichia coli ribosomes. Binding of PfEngA (A) and PfObg1 (C) to 30S and 50S subunits of the E. coli ribosome in the presence or absence of GMPPNP as determined by the filter-trap assay. Lane 7 has protein alone in the absence of ribosome. Western blot with anti-PfEngA and anti-PfObg1 (upper panel) and corresponding Coomassie-stained gels (lower panel) are shown. GTP hydrolysis by 2 µM PfEngA (B) and PfObg1 (D) in the presence of ribosomal subunits. The experiment was repeated twice. Mean and standard deviation of replicates from one experiment are plotted. ***P < 0.001 by ANOVA.

In E. coli, the 50S subunit serves as an activator for Obg GTPase activity (Feng et al. Reference Feng2014) and moderate stimulation by 50S has been observed for EngA (Zhang et al. Reference Zhang2014). We assayed the effect of E. coli 50S and 30S subunits on the GTPase activity of PfObg1 and PfEngA. No significant change in GTP hydrolysis was observed for PfEngA in the absence or presence of either ribosomal subunit (Fig. 6B). This indicates that although binding of PfEngA to 50S is enhanced by GTP, subunit binding per se has no effect on the GTPase activity of the factor. On the other hand, GTP hydrolysis by PfObg1 was stimulated by ~3-fold in the presence of the 50S subunit with no effect of the 30S subunit (Fig. 6D). Although nucleotide binding had no effect on PfObg1–50S interaction, the interaction of PfObg1 with the 50S subunit stimulated its GTPase activity.
PfObg1 is a DNA-binding protein that interacts with the parasite mitochondrial genome
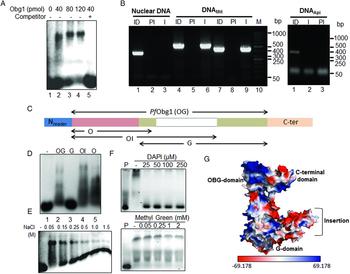
Bacterial Obg proteins have been implicated in DNA processes such as initiation of DNA replication, chromosome segregation, progression through the cell cycle and response to replication fork arrest (Kint et al. Reference Kint2014). A single report has shown direct DNA binding by E. coli Obg in vitro (Kobayashi et al. Reference Kobayashi, Moriya and Wada2001) although the domain(s) required for interaction have not been identified. We checked the DNA-binding ability of PfObg1 in EMSAs by incubating purified recombinant protein with a 5′-FAM-labelled 21 bp DNA oligonucleotide. Two mobility shifts were observed in the presence of PfObg1, demonstrating a physical association between the DNA probe and the protein (Fig. 7A). The lower and upper shifts are likely to result from binding of PfObg1 to one and two sites, respectively, on the DNA probe. DNA–protein complexation was abolished when another double-stranded unlabelled 31 bp oligonucleotide was used as a competitor, indicating that PfObg1 binds DNA in a sequence non-specific manner.
PfObg1 interacts with mitochondrial DNA through its Obg domain. (A) EMSA showing binding of PfObg1 with a 5′-FAM-labelled 21 bp DNA probe. 80-fold molar excess of 31 bp double-stranded unlabelled DNA with a different sequence abolished binding (lane 5). (B) Anti-PfObg1 antibody specifically precipitates mitochondrial DNA (DNAMit) in a ChIP assay. Lanes 1–3 show PCR products obtained using primers for nuclear DNA (putative PfIscA sequence), lanes 4–6 and 7–9 show PCR products using primers for mitochondrial DNA fragments A and B, respectively. Lanes 1–3 in the panel to the right show PCR products obtained using primers for apicoplast rpl16 (DNAApi). ID, input DNA; PI, pre-immune serum; I, immune serum. (C) Schematic representation of regions covered by PfObg1 deletions. (D) EMSA showing DNA binding by OG, G, OI and O segments of PfObg1 using the same probe as (A). (E) Effect of NaCl concentration on DNA interaction of the PfObg1 O segment. (F) DNA binding of the O segment in the presence of increasing concentrations of minor groove-binding dye (DAPI) (upper panel) and major groove-binding methyl green (lower panel). (G) Surface electrostatic potential of PfObg1 structure model showing the positively-charged OBG domain. Red – blue gradient was set from −69.18 to +69.18 k bTec−1.
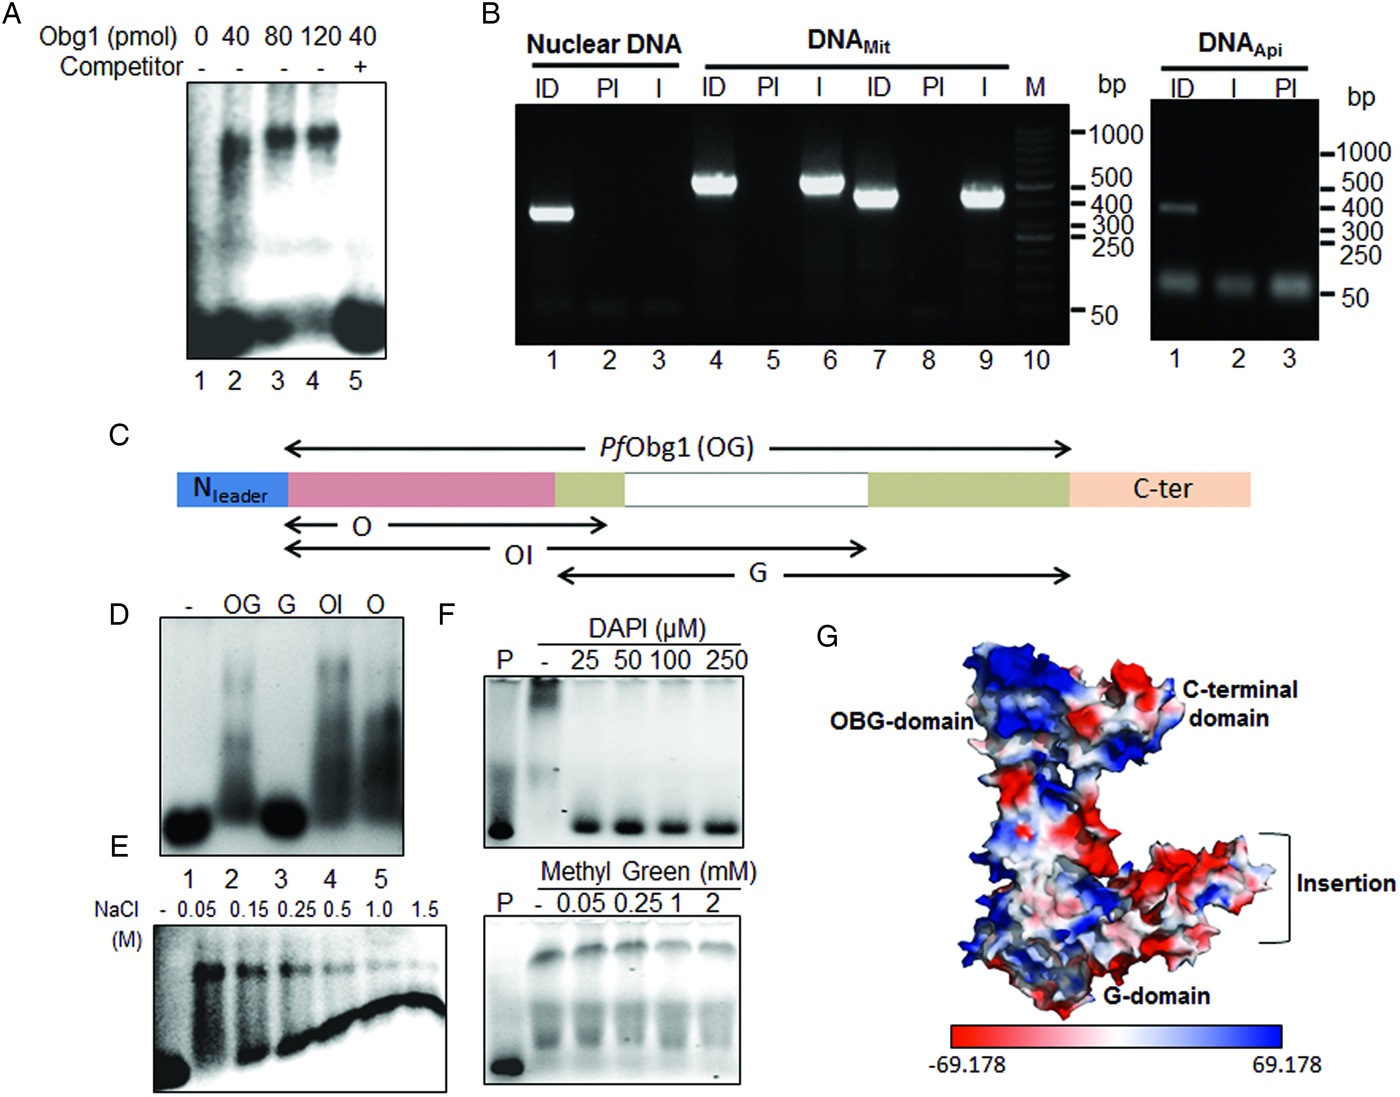
To confirm whether PfObg1 interacts with parasite mitochondrial DNA in vivo, ChIP of total P. falciparum DNA was performed using an anti-PfObg1 serum with pre-immune serum as negative control. This was followed by PCR-amplification of immunoprecipitated DNA using primer pairs for DNA fragments encoded by nuclear, apicoplast and mitochondrial genomes. While all primer pairs amplified the corresponding fragments from input DNA, amplification of only the mitochondrion-specific fragment was obtained from DNA precipitated with anti-PfObg1 serum (Fig. 7B). No amplification was seen from DNA immunoprecipitated using the pre-immune serum. The clear recovery of mitochondrial DNA in the ChIP assay indicated that PfObg1 binds specifically to the mitochondrial genome.
To identify PfObg1 domain(s) that mediate DNA–protein interaction, truncated segments of PfObg1 were expressed in E. coli. These cover the OBG domain and a small part of the G-domain (O, 64–262 aa), G-domain (G, 223–548 aa) and OBG domain with a part of the G-domain that includes the PfObg1 insertion (OI, 64–435 aa) and recombinant PfObg1 (OBG domain and the complete G-domain) (Fig. 7C). His6-tagged proteins were purified (Supplementary Fig. S5). As observed for PfObg1 (Fig. 2C), there was a substantial upward shift in migration of all protein fragments with respect to expected sizes. The apparent differences ranged from ~5 kDa for the O segment to 25 kDa for the OI segment, suggesting that the highly asparagine rich and disordered 160 aa insertion in the G-domain contributes to this discrepancy. EMSA with purified PfObg1 domains and the 5′-FAM-labelled 21 bp DNA probe showed DNA–protein shifts with O, OI and OG regions while no DNA retardation was observed with the G-domain alone (Fig. 7D). This indicates that the OBG-domain, common to O, OI and OG constructs, is involved in DNA binding. OBG domain (O) can interact with parasite mitochondrial DNA as shown by EMSAs using 21 and 36 bp probes with mitochondrial DNA fragments of corresponding DNA length (20 and 40 bp) as competitors (Supplementary Fig. S6). Neither PfEngA nor the negative control protein GST bound DNA (Supplementary Fig. S6).
The OBG-domain is rich in basic amino acids (25 lysine and three arginine) giving an overall positive charge to this region (Fig. 7G) which is likely to contribute to the interaction with negatively charged DNA. Reduction of O segment–DNA complex was seen upon increasing NaCl concentrations indicating the role of ionic interactions in protein–DNA interaction (Fig. 7E). Binding of the O segment to the major or minor groove of DNA was determined by competitive inhibition with DNA-binding dyes. Low concentration of the minor groove-binding DAPI abolished protein–DNA interaction while the major groove binder methyl green had no effect even at high concentrations (Fig. 7F) indicating that PfObg1 primarily interacts with the minor-groove of DNA.
Expression of PfEngA is enhanced in response to DNA damage
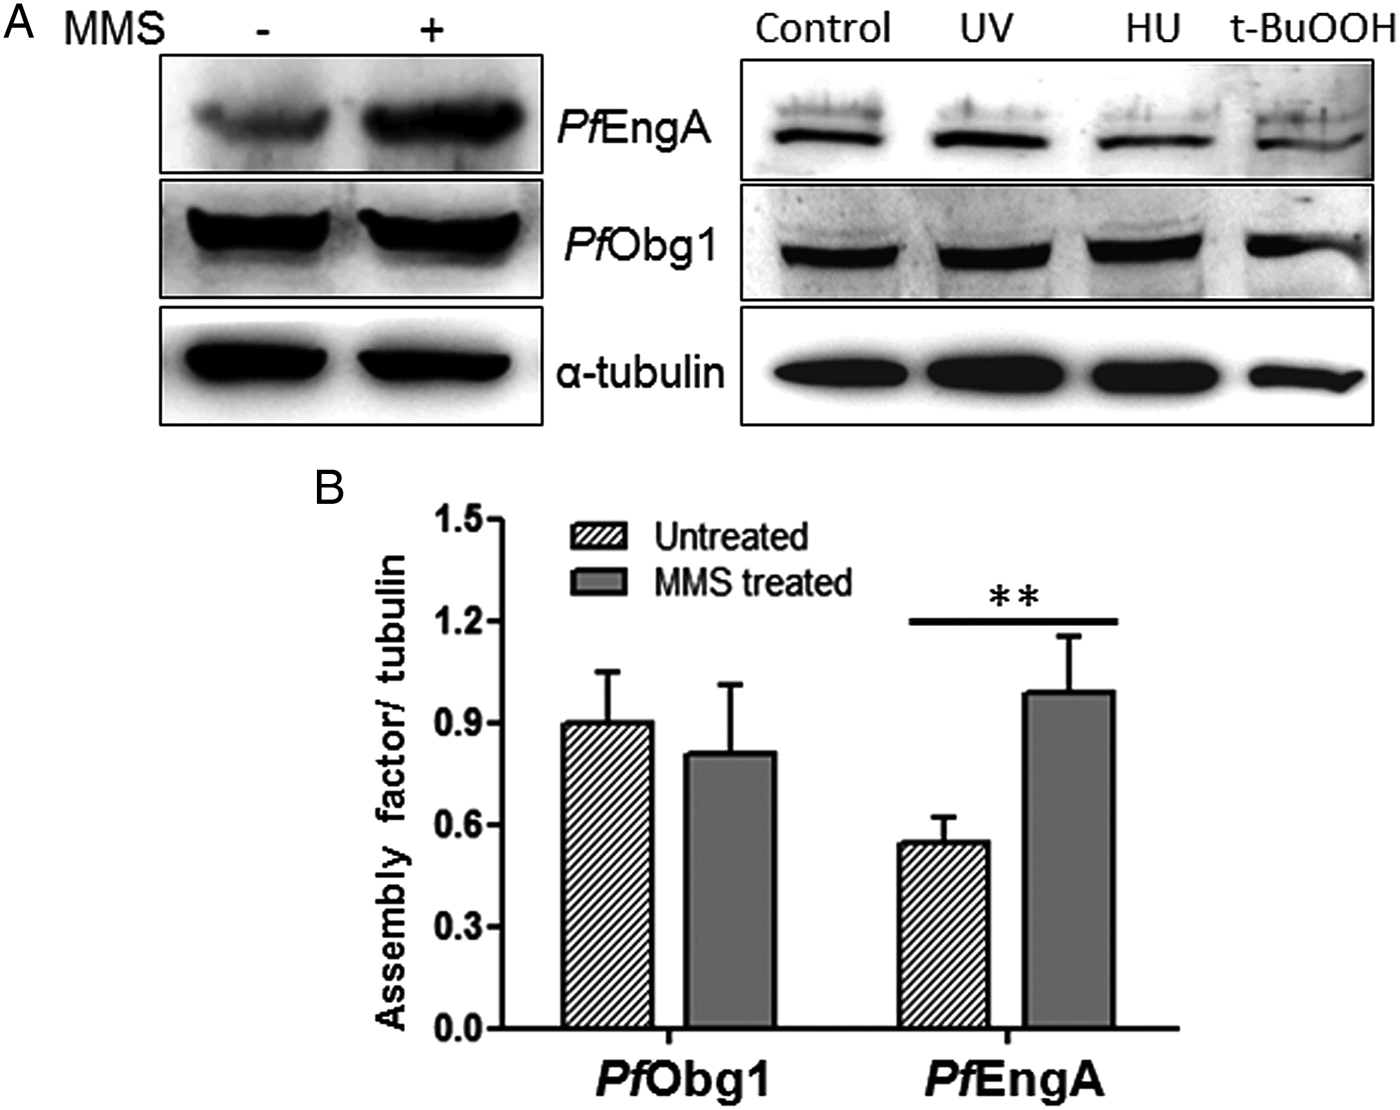
Ribosome assembly proteins are known to contribute to the cellular stress response. We checked the effect of genotoxic and oxidative stress agents on the protein expression levels of PfEngA and PfObg1 in P. falciparum. Trophozoite stage parasites were treated with methyl methanesulfonate (MMS), UV irradiation, hydroxyurea and t-butyl hydroperoxide and expression of PfEngA and PfObg1 in treated and untreated parasite cultures was analysed by Western blotting using anti-PfEngA and anti-PfObg1 antibodies with tubulin as normalizing control (Fig. 8A, B). PfEngA expression was significantly enhanced upon MMS exposure while there was no increase in the expression level of PfObg1 (Fig. 8B); other treatments did not alter expression of either protein. The enhanced expression of PfEngA in response to MMS suggests a role for PfEngA in the DNA damage stress response.
PfEngA expression is enhanced upon MMS treatment. (A) Western blots showing PfEngA and PfObg1 levels in parasites, with and without MMS treatment (left panel) and UV, hydroxyurea (HU) and t-butyl hydroperoxide (t-BuOOH) (right panel). (B) PfEngA and PfObg1 expression levels were normalized with tubulin. Mean and standard deviation for three independent experiments with MMS treatment are shown. **P < 0.01 by ANOVA.

Discussion
The predicted absence of several RP, known to be involved in LSU and SSU assembly in bacteria, from the apicoplast and mitochondrion of P. falciparum suggests deviations from bacterial ribosome biogenesis pathways. The list of identifiable ribosome biogenesis factors encoded by the parasite nuclear genome also lacks homologues for several assembly proteins known in bacteria such as maturation factors RimP, RimJ, RimN and YqeH. As the two GTPases PfEngA and PfObg1 identified in this study target to the mitochondrion, other putative assembly GTPases (Gupta et al. Reference Gupta2014) might function in the apicoplast. Eukaryotic EngA proteins have been earlier localized to plant plastids and Arabidopsis thaliana chloroplasts contain a cyanobacterium-related EngA1 and an additional α-proteobacterial-like EngA2 GTPase possibly acquired through re-compartmentalization from mitochondria (Jeon et al. Reference Jeon2014; Suwastika et al. Reference Suwastika2014). Although a mitochondrial EngA has not been characterized in eukaryotes so far, the presence of a conserved insertion in the Switch II region of GD1-domain in plastid EngA proteins of cyanobacterial origin seems to distinguish them from EngA of α-proteobacterial origin (Jeon et al. Reference Jeon2014) (Supplementary Fig. S1). Consistent with its mitochondrial localization, PfEngA lacks this insertion (Supplementary Fig. S1) and is positioned closer to α-proteobacterial EngA in phylogenetic analysis (Suwastika et al. Reference Suwastika2014). Phylogenetic tree of Obg proteins places both P. falciparum Obg homologues close to plant type 2 Obg with mitochondrial localization (Suwastika et al. Reference Suwastika2014). Our results indicate that only one of the parasite Obg homologues is a mitochondrial factor while the other is a cytosolic protein.
Bacterial EngA binds to the intersubunit face of the 50S in a fully extended conformation; the three EcEngA domains make extensive contacts with the ribosome. EcEngA G domains contact helices H68, H75, H82, H88 and RPs L1 and L2. H82 and H88 are missing in the fragmented mitochondrial LSU rRNA of P. falciparum (Feagin et al. Reference Feagin2012) suggesting the involvement of additional elements in G-domain interactions.
Bacterial Obg has been shown to exhibit interaction with both 30S and 50S subunits with greater binding to 50S (Sato et al. Reference Sato2005; Sasindran et al. Reference Sasindran2011). Although PfObg1 had comparable binding with E. coli 30S and 50S subunits in vitro, it showed preferential interaction with P. falciparum mitoribosomal LSU. Cryo-EM structure of 50S-EcObgE.GMPPNP complex has revealed that Obg binds to the intersubunit face overlapping with the position used for binding of translational GTPases (IF2, EF-Tu, EF-G, RF3) (Feng et al. Reference Feng2014). The N-terminal OBG domain is a tRNA structural mimic that displays tight polar interactions with the rRNA helices 89–93 of the PTC via its lysine and arginine-rich protrusion. These helices are conserved in P. falciparum mitochondrial LSU rRNA. A conserved glycine in the OBG domain (Gly98 in Vibrio cholera Obg, corresponding to Gly93 in E. coli) and a conserved tyrosine in the G-domain (Tyr194 in V. cholerae, Tyr189 in E. coli) (Supplementary Fig. S2) are implicated in interdomain interactions and GTPase activity (Chatterjee and Datta, Reference Chatterjee and Datta2016). Interestingly, an asparagine residue replaces the conserved glycine in PfObg1 with conservation of the G-domain tyrosine residue.
GTP hydrolysis by bacterial EngA is modulated by the adoption of more than two conformational states (Zhang et al. Reference Zhang2014; Majumdar et al. Reference Majumdar2017) where the KH-domain and GD2 remain as a structural unit and do not respond in a major way to changes in the nucleotide-bound state of GD2. On the other hand, GD1 is greatly mobilized by binding to GMPPNP but not GDP, resulting in an extended conformation when bound to the former. Similar to bacterial EngA, the increase in PfEngA association to the 50S but not the 30S subunit in the presence of GMPPNP indicates that the GTP analogue stabilizes its interaction specifically with the 50S subunit. Addition of the 50S subunit, however, does not significantly stimulate the GTPase activity of PfEngA. A homologue of the EngA regulator YihI that activates EngA GTPase activity in bacteria (Hwang and Inouye, Reference Hwang and Inouye2010) is also not identified in P. falciparum. In contrast to PfEngA, the GTPase activity of PfObg1 is significantly stimulated by interaction with the 50S subunit even though its binding to 50S is not enhanced by GMPPNP. The failure of 30S to stimulate GTP hydrolysis by PfObg1 indicates that the factor undergoes significant conformational changes impacting its GTPase activity only upon association with 50S.
Expression of PfEngA, but not PfObg1, is enhanced upon MMS-induced DNA damage suggesting a role for PfEngA in response to genotoxic stress. This is in agreement with results of global transcriptional profiling of P. falciparum after MMS-induced DNA damage where an increase in transcript levels of PfEngA is seen (Gupta et al. Reference Gupta2016). EngA has been linked to the alarmone ppGpp-mediated stringent response in bacteria as well as to other cellular processes such as chromosome segregation and cell wall structure (Hwang and Inouye, Reference Hwang and Inouye2008; Lee et al. Reference Lee2011). The low affinity for guanine nucleotides and a fast GTP/GDP exchange rate on ribosome assembly GTPases has been proposed to be important for their role in coupling ribosome assembly and translation control to growth regulatory pathways (Wilson and Nierhaus, Reference Wilson and Nierhaus2007; Strunk and Karbstein, Reference Strunk and Karbstein2009; Shajani et al. Reference Shajani, Sykes and Williamson2011). The stringent response in bacteria and plants involves a sharp increase in the guanine-derivative ppGpp that has multiple cellular targets including EngA (Hwang and Inouye, Reference Hwang and Inouye2008; Atkinson et al. Reference Atkinson, Tenson and Hauryliuk2011). Homologues of the ppGpp synthetase (RelA) and hydrolase (SpoT) are not identifiable in P. falciparum and mitochondria universally lack ppGpp signalling (Atkinson et al. Reference Atkinson, Tenson and Hauryliuk2011). The mechanism by which EngA might participate in stress response in the parasite mitochondrion remains to be explored.
Although the role of Obg in ribosome assembly is well-characterized and it has been proposed as a major candidate protein-linking DNA replication, chromosome segregation and regulation of protein synthesis in bacteria (Verstraeten et al. Reference Verstraeten2011; Kint et al. Reference Kint2014), there is no report of detection of Obg-DNA interaction in vivo. Our results show that PfObg1 binds DNA in a sequence non-specific manner, and ChIP experiments establish that it specifically immunoprecipitates the parasite mitochondrial genome providing evidence for PfObg1–DNA interaction in the parasite. The DNA-binding activity of PfObg1 is primarily mediated by the positively charged N-terminal OBG domain that approaches DNA through the minor groove of the double-helix. Although we do not find upregulation of PfObg1 under different stress conditions, its interaction with mitochondrial DNA suggests a constitutive role in genome replication and/or maintenance. As observed in bacteria, it could have specific roles in stabilizing DNA replication sites and altering DNA segregation (Feng et al. Reference Feng2014; Kint et al. Reference Kint2014). The two human homologues of Obg, ObgH1 and ObgH2, localize to the mitochondrion and nucleolus respectively, the latter contributing to ribosome maturation in the nuclear compartment for ribosome generation (Hirano et al. Reference Hirano2006). Cytosolic PfObg2 might be involved in late-stage assembly of cytosolic 80S ribosomes or have other roles in the parasite.
Our results identify two important P. falciparum mitochondrion-targeted GTPases with a role in ribosome maturation. Both Obg and EngA are considered important targets for discovery of novel antimicrobials (Bharat et al. Reference Bharat, Blanchard and Brown2013; Bonventre et al. Reference Bonventre2016) and their involvement in critical ribosome assembly and DNA interaction in the Plasmodium mitochondrion warrants exploration in this direction. The future effort would have to be supported by structure–function analysis of PfEngA and PfObg1 interactions with mitochondrial ribosomes and the functional implications of PfObg1 binding to the mitochondrial genome under different growth environments.
Supplementary material
The supplementary material for this article can be found at https://doi.org/10.1017/S0031182018000501
Acknowledgements
We thank Dr Balaji Prakash for the EcEngA expression clone. Technical assistance by Rima Ray Sarkar, RK Srivastava, JP Srivastava and Tofan Kumar Raut is acknowledged. K.G. and A.G. received fellowships from the Council of Scientific and Industrial Research (CSIR) and the University Grants Commission, Government of India, respectively. This is CDRI communication number 9646.
Financial support
This work was supported by CSIR project grant SPLENDID (BSC0104i) and DST grant GAP0100 to SH.
Conflict of interest
The authors declare no conflict of interest.
Ethical standards
Permission for use of RBCs from healthy volunteers was obtained from the CSIR–CDRI Institutional Ethics Committee (Human Research) (#CDRI/IEC/CEM/21-07-2010). Permission for animal experiments was obtained from the Institute Animal Ethics Committee (IAEC/2007/126/Renew 05).