1. Introduction
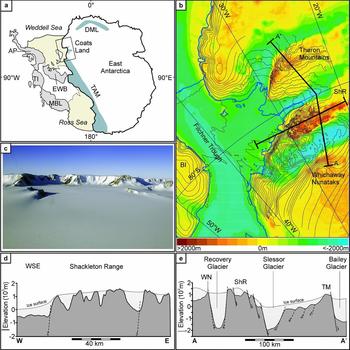
The Shackleton Range forms a highland at 80–81°S and 19–31°W between Slessor and Recovery Glacier and Filchner Ice Shelf, and dominates the Coats Land region of Antarctica (Fig. 1). Situated at the hinge of the Weddell Sea, at the intersection of the Panthalassan (Palaeo-Pacific) coast of Gondwana and the newly developing Atlantic margin, and at the border between the stable East Antarctic Craton and the mobile West Antarctic terrane assemblage, the range occupies a crucial position for the Phanerozoic history of Gondwana and Antarctica. This unique setting means that the Shackleton Range is a key location to study the transition from an active to a passive Gondwana margin, the opening of the Weddell Sea and the formation of the rifted margins to the Weddell Sea and South Atlantic Ocean. However, none of these processes appears preserved even implicitly in the known geological record. Exposed mountain massifs almost exclusively consist of truncated metamorphic basement, while patchy Phanerozoic deposits are restricted to Cambro-Ordovician molasses of the Pan-African Orogen and a single outcrop of thin Permo-Carboniferous glacial strata (e.g. Buggisch, Bachtadse & Henjes-Kunst, Reference Buggisch, Bachtadse and Henjes-Kunst1999; Tessensohn, Kleinschmidt & Buggisch, Reference Tessensohn, Kleinschmidt and Buggisch1999 a). Other sedimentary sequences or igneous units that are typical for the Panthalassan margin of Gondwana elsewhere, such as thick Mesozoic active margin foreland deposits or the c. 180 Ma basaltic Ferrar/Karoo sills or flows, are not preserved.
(a) Simplified overview of the East and West Antarctic plate pattern. The East Antarctic plate is outlined by the thick solid black line; West Antarctic mobile terranes and coastal embayments are outlined by thin solid black lines. Blue shaded areas within East Antarctica indicate significant ice-free regions in the frame of this study. AP – Antarctic Peninsula; DML – Dronning Maud Land; EWB – Ellsworth-Whitmore Block; MBL – Marie Byrd Land; TAM – Transantarctic Mountains; TI – Thurston Island. The inset shows the area of map plotted in (b). (b) Regional map of the study area in the Weddell Sea embayment with shaded colours reflecting the sub-ice topography. Contour lines indicate recent (ice-) surface elevations. Thick solid lines delineate cross-sections drawn in (d) and (e). BI – Berkner Island; ShR – Shackleton Range. (c) Photograph of the Shackleton Range, displaying the palaeosurface and escarpments of the Read Mountains. Cliff heights are c. 400 m. Photograph (taken by M. Studinger) faces north. (d) W–E-aligned cross-section through the basement of the Shackleton Range. Notable is the high-standing, deeply incised palaeosurface of the Shackleton Range and the steep escarpment towards the Weddell Sea coast. Stippled lines indicate inferred normal faults. WSE – Weddell Sea Embayment. (e) Cross-section through the basement from Whichaway Nunataks (WN) to Theron Mountains (TM) via Shackleton Range (ShR), highlighting the enormous relief differences between glacial troughs and rock outcrops, and the obvious normal fault pattern. Stippled lines indicate inferred normal faults. Bedrock elevation data of (b), (d) and (e) are based on Bedmap 2 data (Fretwell et al. Reference Fretwell, Pritchard, Vaughan, Bamber, Barrand, Bell, Bianchi, Bingham, Blankenship, Casassa, Catania, Callens, Conway, Cook, Corr, Damaske, Damm, Ferraccioli, Forsberg, Fujita, Gim, Gogineni, Griggs, Hindmarsh, Holmlund, Holt, Jacobel, Jenkins, Jokat, Jordan, King, Kohler, Krabill, Riger-Kusk, Langley, Leitchenkov, Leuschen, Luyendyk, Matsuoka, Mouginot, Nitsche, Nogi, Nost, Popov, Rignot, Rippin, Rivera, Roberts, Ross, Siegert, Smith, Steinhage, Studinger, Sun, Tinto, Welch, Wilson, Young, Xiangbin and Zirizzotti2013); contour lines were supplied by the Antarctic Digital Database.

Indirect evidence for the geological history from thermochronological data is also scarce. Only one set of zircon and apatite fission track (ZFT, AFT) data has been published so far (Lisker, Schäfer & Olesch, Reference Lisker, Schäfer and Olesch1999), and was interpreted as reflecting three exhumation and uplift stages of the basement at c. 190 Ma, c. 110 Ma and, tentatively, at c. 50 Ma. Such a Phanerozoic record does not match the geological history anywhere else in Antarctica or adjacent Gondwana fragments, and makes the Shackleton Range an alien block in the continent.
On the contrary, a close inspection of stratigraphic record, thermochronological data and geomorphological features reveals several problems. A first problem refers to the timing of depositional episodes. Sediment relicts in the eastern Shackleton Range, resting above truncated basement, were generally considered as Permo-Carboniferous tillite sequence; an alternative theory is that the uppermost strata are Lower Jurassic tuffites (Buggisch et al. Reference Buggisch, Kleinschmidt, Höhndorf and Pohl1994 a, b; Tessensohn, Kleinschmidt & Buggisch, Reference Tessensohn, Kleinschmidt and Buggisch1999 a). More severe is a second concern about the thermal history interpretation of ZFT and AFT data in terms of monotonous cooling paths that does not account for events of near-surface exposition (Lisker, Schäfer & Olesch, Reference Lisker, Schäfer and Olesch1999). The occurrence of either upper Palaeozoic or Mesozoic deposits upon truncated basement requires coeval heating of the rock column beneath. This disproves the proposed exhumation concept including any estimates of timing and amounts and rates of exhumation, and requires a revision of the exhumation and tectonic history.
Here, we aim to revise the stratigraphic position of the uppermost strata of the Shackleton Range to identify episodes of basement exposition and deposition and to reconstruct the Mesozoic and Cenozoic exhumation and tectonic history. This study relies on an interdisciplinary approach combining petrological, geochemical and geochronological data with thermochronological data. The first step is to establish rock type and facies of the deposits – diamictite or volcaniclastic rock – via petrographic thin-section analyses, X-ray diffraction (XRD) analysis, inductively coupled plasma mass spectrometry (ICP-MS) and X-ray fluorescence (XRF) analyses. Radiometric age data (40Ar/39Ar) will then determine either detrital ages or the timing of the last metamorphic event or – in the case of volcanic detritus – provide a deposition age and therefore also the date of near-surface position of the truncated basement. Finally, this information will provide a crucial input to set the frame for thermal history modelling of existing and new ZFT, AFT and AHe data.
The new stratigraphic data and thermal history models provide key constraints to develop consistent burial and exhumation scenarios of the Shackleton Range and derive timing, depths and rates of basin infill and exhumation amounts. The results have major implications for the general geological evolution and tectonic processes at the Panthalassan margin of Gondwana and the initiation of the Weddell Sea Basin.
2. Geological and geomorphological setting
2.a. Geological framework
East Antarctica is formed by a collage of Precambrian terranes that amalgamated stepwise during Precambrian–Cambrian time (e.g. Boger, Reference Boger2011). Its western margin is framed by Palaeozoic West Antarctic mobile crustal blocks, which were bounded in the outermost west by the (Palaeo-) Pacific subduction zone during Palaeozoic–Mesozoic time (Fig. 1a). Along the western margin of Gondwana, in the Transantarctic Mountains, Beacon Group sediments were deposited diachronously during Devonian–Triassic time. They mainly consist of clastic red-bed sediments deposited upon truncated Proterozoic – lower Palaeozoic basement rocks. Further components of the Beacon Strata are clastic Permian freshwater to shallow-marine sequences and Permian–Triassic coal seams. Palaeosols and erosion surfaces are abundant within the strata and indicate times of subaerial periods. Typically for the Beacon Supergroup, the youngest rocks depict multiform Ferrar/Karoo magmatic rocks, somehow related to the beginning break-up of Gondwana (e.g. Barrett, Reference Barrett and Tingey1992; Collinson et al. Reference Collinson, Isbell, Elliot, Miller, Miller, Veevers, Veevers and Powell1994). The Ferrar/Karoo igneous activity was a magmatic event which occurred during c. 200–170 Ma, with its main phase at 180–175 Ma. Ferrar-related rocks include rhyolitic to dacitic intrusions, rhyolitic to mafic dyke and sill emplacements, and basaltic lava flows (e.g. Brewer, Reference Brewer1989; Elliot & Fleming, Reference Elliot and Fleming2000, Reference Elliot and Fleming2004; Leat et al. Reference Leat, Luttinen, Storey, Millar, Hanski, Mertanen, Ramo and Vuollo2005). Correlatives and analogues of the Beacon sequence including the Ferrar/Karroo rocks can be found elsewhere in East Antarctica (e.g. Dronning Maud Land), as well in the Australian, African and South American parts of Gondwana. However, at least some West Antarctic blocks (e.g. Ellsworth Mountains) comprise different sediments of Cambrian–Permian age, folded during the Gondwanide Orogeny during Middle–Late Triassic time (e.g. Craddock, Reference Craddock and Adie1972; Curtis, Reference Curtis2001).
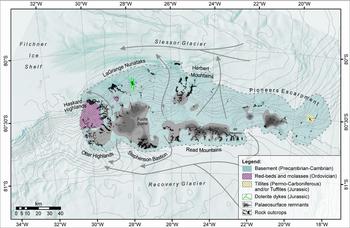
In Coats Land, the structural continuation of the Transantarctic Mountains, the Shackleton Range forms the largest rock outcrop surrounded by the steep escarpment of the Theron Mountains in the north and the patchy Whichaway Nunataks in the south. It forms a topographic high elevated up to 1800 m and flanked by two major, up to 2000 m deep, glacial troughs that host westwards-flowing ice streams (Fig. 1b). It occupies an area of c. 15300 km² with a length of 170 km in the E–W direction and a maximum width of 90 km in the N–S direction. Outcrops form rock massifs that are dissected by snowfields and ice streams. In clockwise order, these are: LaGrange Nunataks, Herbert Mountains, Pioneers Escarpment, Read Mountains, Stephenson Bastion, Otter Highlands and Haskard Highlands (Fig. 2).
Combined geomorphic and simplified geologic overview of the Shackleton Range modified after Tessensohn et al. (Reference Tessensohn, Kleinschmidt and Buggisch1999 b) and Kleinschmidt et al. (Reference Kleinschmidt, Buggisch, Läufer, Helferich, Tessensohn, Gamble, Skinner and Henrys2002). Arrows mark the flow direction of selected glaciers (Höfle & Buggisch, Reference Höfle and Buggisch1995); green lines indicate the location and strike of Jurassic dolerite dykes (Spaeth et al. Reference Spaeth, Hotten, Peters and Techmer1995). Data from Bedmap2 (palaeosurfaces), Antarctic Digital Database (contour lines) and LIMA data (Landsat image).

The basement of the Shackleton Range consists of a nappe stack which formed during the Pan-African Orogeny at c. 500 Ma. It comprises medium- to high-grade crystalline rocks, partly eclogised ophiolites, and non- to low-grade metamorphic sedimentary rocks of Palaeoproterozoic – early Palaeozoic age (e.g. Clarkson, Reference Clarkson1981; Kleinschmidt, Buggisch & Flöttmann, Reference Kleinschmidt, Buggisch, Flöttmann, Yoshida, Kaminuma and Shiraishi1992; Tessensohn et al. Reference Tessensohn, Kleinschmidt and Buggisch1999 b; Kleinschmidt et al. Reference Kleinschmidt, Buggisch, Läufer, Helferich, Tessensohn, Gamble, Skinner and Henrys2002; Boger, Reference Boger2011). The Phanerozoic sedimentary record of the Shackleton Range is restricted to small, isolated patches. Subhorizontal Ordovician red-bed molasse and fossiliferous sediments of the Blaiklock Glacier Group in the west document the initial exhumation of the Pan-African Orogen (Buggisch, Bachtadse & Henjes-Kunst, Reference Buggisch, Bachtadse and Henjes-Kunst1999). Controversially discussed Permo-Carboniferous glacial deposits or Jurassic tuffaceous rocks crop out at a small nunatak in the east and represent the youngest sedimentary deposits (Buggisch et al. Reference Buggisch, Kleinschmidt, Höhndorf and Pohl1994 a, b; Tessensohn, Kleinschmidt & Buggisch, Reference Tessensohn, Kleinschmidt and Buggisch1999 a). Post-orogenic dykes of mostly mafic composition yield amphibole, biotite and whole-rock 40K–39Ar ages ranging over 177–426 Ma (Hotten, Reference Hotten1993, Reference Höfle and Buggisch1995; Spaeth et al. Reference Spaeth, Hotten, Peters and Techmer1995; Brommer, Reference Brommer1998; Brommer & Henjes-Kunst, Reference Brommer and Henjes-Kunst1999). Sills were not observed in the Shackleton Range. The brittle tectonic inventory includes thrusts, shear zones, and normal and reverse faults. These as-yet undated structures were related to the latest orogenic event. Skidmore & Clarkson (Reference Skidmore and Clarkson1972) describe the Shackleton Range as a rectangular horst with major N–S-trending faults. Major ice streams appear to utilize tectonic structures that separate the metamorphic basement of the Shackleton Range from adjacent early Permian deposits and massive Jurassic dolerite sills in the Theron Mountains and in the Whichaway Nunataks, respectively (Stephenson, Reference Stephenson1966; Brook, Reference Brook1972; Hofmann et al. Reference Hofmann, Kaiser, Klemm and Paech1980; Hutton, Reference Hutton2009; Figs 1, 2).
2.b. Geomorphological pattern
The morphology of the Shackleton Range is dominated by almost-horizontal ridges, plateaus and mesas. Summits reach elevations of 400–1800 m, and are bound by up to 400 m steep cliffs. The terrain is highest at the Fuchs Dome ice cap in the SW and across to Mount Wegener (Read Mountains). It declines slightly to the NW and finally plunges towards the Weddell Coast, where isolated and conical nunataks appear at low elevation. At the eastern rim, outcrops submerge beneath the ice cover. The flat topped ridges, plateaus and mesas were interpreted as remnants of an undulating continuous ‘peneplain’ or palaeosurface (Stephenson, Reference Stephenson1966; Skidmore & Clarkson, Reference Skidmore and Clarkson1972; Marsh, 1985). The palaeosurface was supposedly formed during Middle Ordovician – Permian time. Its remnants occur across all mountain massifs and are dissected by faults of unknown age, resulting in an exposure at different elevations (Stephenson, Reference Stephenson1966). The largest remnant of the palaeosurface is exposed at 1600–1800 m in the Read Mountains. Further remnants (in clockwise direction) are observed at the following elevations: Stephenson Bastion at 1450 and 1600 m; Haskard Highlands at 1000–1150 m; LaGrange Nunataks at 1200–1330 m; and Herbert Mountains at 1640 m. In the Pioneers Escarpment, a large amount of the palaeosurface is covered by ice. Nevertheless, Stephenson (Reference Stephenson1966) refers to the existence of the palaeosurface in the east; its subglacial existence is also evident with regards to the sub-ice topography (Fretwell et al. Reference Fretwell, Pritchard, Vaughan, Bamber, Barrand, Bell, Bianchi, Bingham, Blankenship, Casassa, Catania, Callens, Conway, Cook, Corr, Damaske, Damm, Ferraccioli, Forsberg, Fujita, Gim, Gogineni, Griggs, Hindmarsh, Holmlund, Holt, Jacobel, Jenkins, Jokat, Jordan, King, Kohler, Krabill, Riger-Kusk, Langley, Leitchenkov, Leuschen, Luyendyk, Matsuoka, Mouginot, Nitsche, Nogi, Nost, Popov, Rignot, Rippin, Rivera, Roberts, Ross, Siegert, Smith, Steinhage, Studinger, Sun, Tinto, Welch, Wilson, Young, Xiangbin and Zirizzotti2013; Fig. 2). The palaeosurface is slightly tilted to the east (Stephenson, Reference Stephenson1966). The ground of the surfaces appears frost-shattered and covered by up to 0.40 m till (Stephenson, Reference Stephenson1966; Höfle & Buggisch, Reference Höfle and Buggisch1995; Sugden et al. Reference Sugden, Fogwill, Hein, Stuart, Kerr and Kubik2014). The Quarternary erosion rate is low at 0.10–0.35 m Ma–1 (Fogwill et al. Reference Fogwill, Bentley, Sugden, Kerr and Kubik2004).
3. Petrological, geochemical and geochronological analyses
3.a. The sedimentary succession in the eastern Shackleton Range
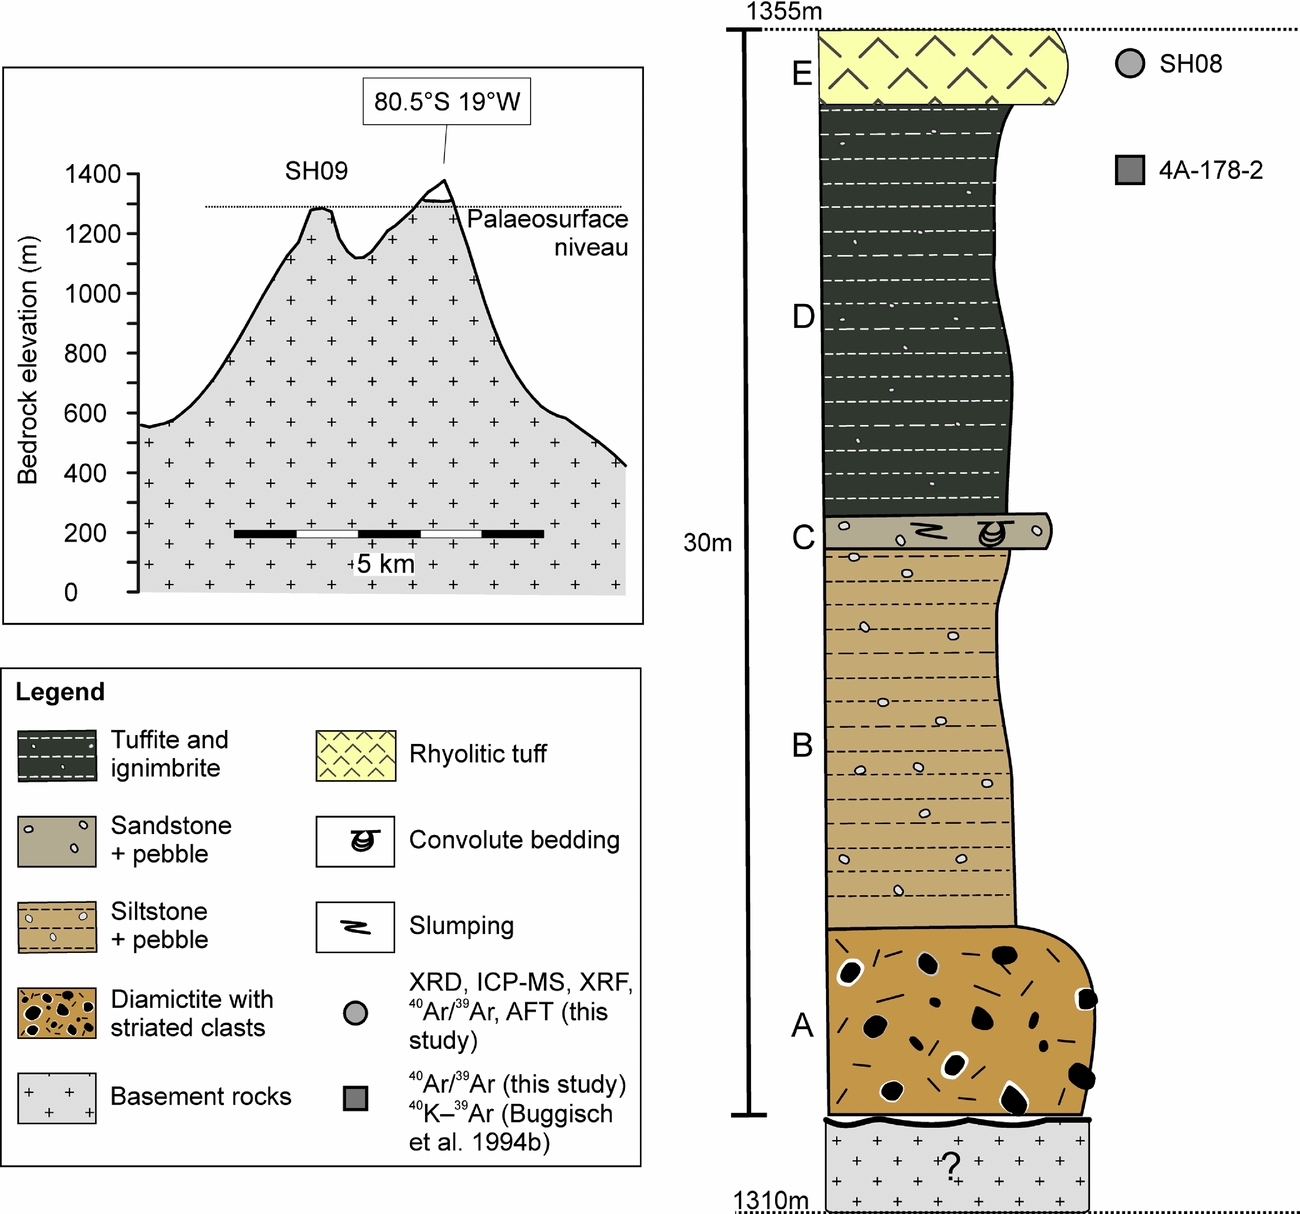
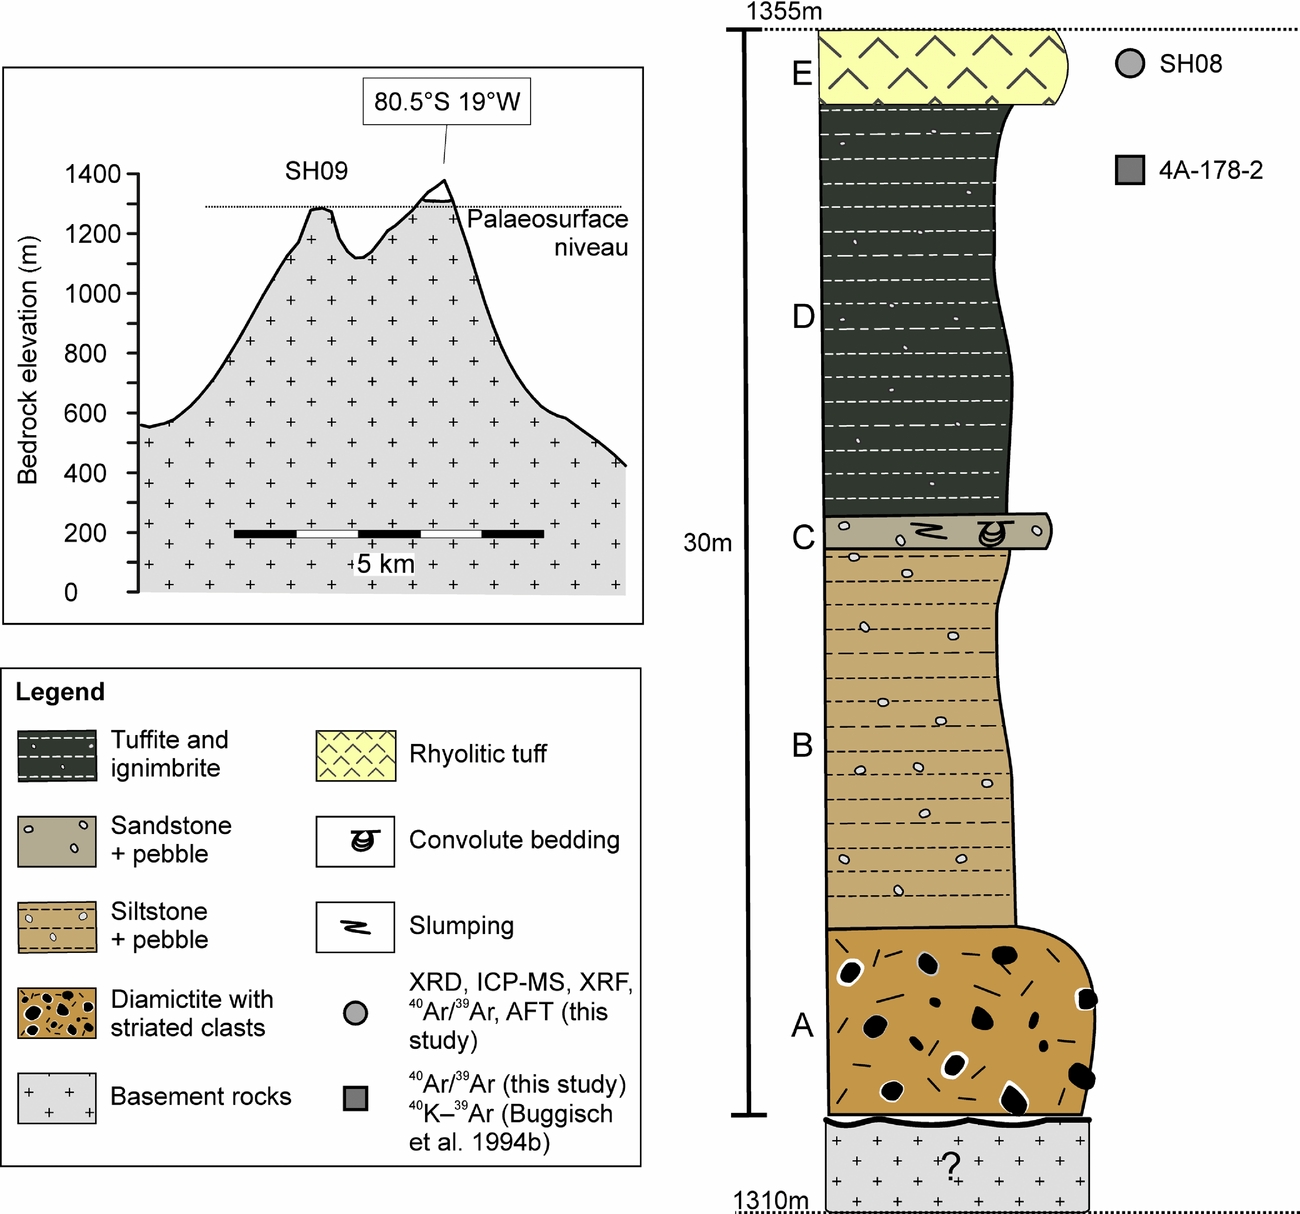
The formation age of the Shackleton Range palaeosurface and timing of (re-)exposition are poorly constrained. A nunatak at 80.5°S 19°W contains a 30 m thick unfossiliferous succession that is debated as being either Permo-Carboniferous glacial deposits or Jurassic tuffites (Figs 2, 3; Buggisch et al. Reference Buggisch, Kleinschmidt, Höhndorf and Pohl1994 a, b; Tessensohn, Kleinschmidt & Buggisch, Reference Tessensohn, Kleinschmidt and Buggisch1999 a). The nonconformity to the basement is not exposed, but the basement palaeosurface is exposed a few kilometres apart (Figs 2, 3). The tilting direction and dip of the palaeosurface coincide with the tilting of the sedimentary succession (Tessensohn, Kleinschmidt & Buggisch, Reference Tessensohn, Kleinschmidt and Buggisch1999 a). The sedimentary sequence, chiefly reported by Tessensohn, Kleinschmidt & Buggisch (Reference Tessensohn, Kleinschmidt and Buggisch1999 a), can be divided into five stratigraphic units according to physical properties. The base of the succession (Unit A) contains non-sorted arenaceous matrix-supported sediments with grain sizes ranging from boulder to clay size. The boulder–pebble-sized clasts are made up of sandstones, phyllites and mica schists and are sub-rounded to rounded with striated and faceted surfaces. Some of these clasts are surrounded by a white halo of a few centimetres thickness. Unit B comprises dark-grey shales with imbedded faceted clasts. It is overlain by pale-coloured pebbly sand–siltstones with slumping, as well as load and convolute bedding structures (Unit C). Sandy clasts in this unit are poorly sorted and consolidated. Unit D consists of black shales and millimetre-sized clasts. The uppermost unit (E) comprises pale white sandstone and siltstones (Tessensohn, Kleinschmidt & Buggisch, Reference Tessensohn, Kleinschmidt and Buggisch1999 a; Fig. 3).
Simplified topographic sketch and stratigraphic section describing the sedimentary deposits of the easternmost nunatak at 80.5°S, 19°W modified after Tessensohn, Kleinschmidt & Buggisch (Reference Tessensohn, Kleinschmidt and Buggisch1999 a). Capital letters refer to stratigraphic units.
The occurrence of secondary chlorite and the white haloes of unidentifiable composition in the basal units (A and B) may refer to a mild metamorphic overprint of these strata.
Based on the striated and faceted surfaces of the boulders and the occurrence of dropstones, Tessensohn, Kleinschmidt & Buggisch (Reference Tessensohn, Kleinschmidt and Buggisch1999 a) interpreted the sequence as glacial debris and correlated its basal layer with the Permo-Carboniferous base of the Beacon Supergroup that was deposited throughout the Transantarctic Mountains (e.g. Barrett, Reference Barrett and Tingey1992; Collinson et al. Reference Collinson, Isbell, Elliot, Miller, Miller, Veevers, Veevers and Powell1994). In analogy, the sedimentary cover on the palaeosurface was suggested to be of Permo-Carboniferous age. However, the origin of Units D and E was discussed controversially. Buggisch et al. (Reference Buggisch, Kleinschmidt, Höhndorf and Pohl1994 a, b) sampled the dark shales of Unit D below Unit E. Petrographic thin-section analysis showed clusters of angular quartz and feldspar in a matrix of fine-grained quartz and white mica. 40K–39Ar whole-rock age determinations on fine-grained fractions yielded ages of 181±2 Ma for 0.6–2 µm and 186±2 Ma for 2–6 µm fractions. The authors classified the rock as a tuffite that may be related to the c. 180 Ma Ferrar volcanic event. In contrast, Tessensohn, Kleinschmidt & Buggisch (Reference Tessensohn, Kleinschmidt and Buggisch1999 a) considered the whole strata as part of the Permo-Carboniferous glacial cycle; this may have been affected by Jurassic contact metamorphism, probably due to an unexposed Jurassic intrusion.
We aim to specify the nature and the age of these strata by petrographic, geochemical and geochronological analyses of the uppermost beds (Units D, E) as they mark a crucial time–temperature constraint for the interpretation of thermochronological data obtained from basement rocks beneath.
3.b. The lithology of the cover sequence (Unit E)
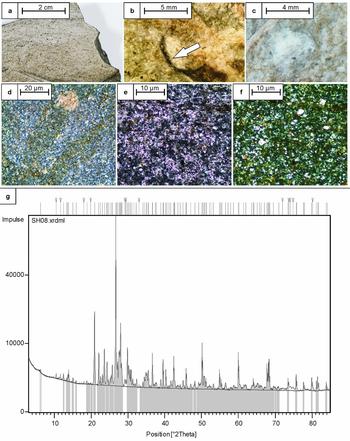
Hand specimen SH08 from Unit E is a massive whitish to pale-greyish rock slightly indicating flow fabric. Individual minerals or clasts are hardly discernible by the naked eye except for local blackish sharp spherical fragments and 0.5–1.5 mm sized spheroids that are partly filled with a whitish, porous and soft material (Fig. 4a–c).
(a) Photograph of polished hand specimen of SH08 displaying internal flow texture. (b) Photograph of blackish bubble wall shards (white arrow). (c) Photograph of spherical structure composed of very soft material. (d) Thin-section microphotograph (crossed polarizers) showing dark very-fine-grained matrix, flow structure and secondary mineral phases. (e) Thin-section microphotograph under plain polarized light and (f) crossed polarizers show the micro- to cryptocrystalline matrix and abundant crystal fragments. (g) XRD diffraction diagram of SH08. Measurement was conducted with CuKα1,2 radiation at ambient temperatures. ‘V's at the top represent undescribed reflexes.

Thin-section analysis reveals a micro- to cryptocrystalline groundmass of felsic minerals with intermediate relief and first-order interference colours, interspersed by very-fine-grained dark minerals and up to 50 µm sized phenocrysts. Within the matrix, the same mineral grains are joined to clusters and patches with a lobate or cloudy appearance. Furthermore, very-fine-grained secondary-phase minerals with high-order interference colours and also with low first-order interference colours are aligned spheroidically. Phenocrysts comprise subhedral quartz, tabular orthoclase, plagioclase laths and opaque mineral phases. Accessory minerals are subhedral amphibole, zircon and apatite. Notably, many of these minerals occur as angular and broken fragments (Fig. 4d–f). The flow fabric is also evident within the thin-section. Some mineral phases may not have been detected optically, due to micro- to cryptocrystalline grain sizes (see online supplementary material S1.1, available at http://journals.cambridge.org/geo).
X-ray diffraction (XRD) analysis of powder of sample SH08 was conducted for qualitative and semi-quantitative mineral determination. The analysis was carried out using CuKα1,2 radiation at ambient temperature conditions. Rietveld refinement was implemented to exclude diffraction shifts. The XRD pattern shows substantial reflexes at the 2Θ angles, where mineral phases quartz (2Θ=26.6512), albite (2Θ=27.89), orthoclase (2Θ=27.76) and apatite (2Θ=31.871) are placed (Fig. 4e). The relative intensity is highest for quartz, albite and orthoclase with more than 80000 counts. Further mineral phases show only very low relative intensities and tend to be obscured by the high-intensity counts. The 100-intensity peak of one mineral phase is placed at 2Θ = 6.212 with a d-spacing of 14.230 Å. This peak can either refer to zeolites (faujasite), chlorite group minerals or to hydrated clay minerals. Hydration of clayous minerals changes lattice parameters and can therefore cause a substantial shift in 2Θ angles. Morkel, Kruger & Vermaak (Reference Morkel, Kruger and Vermaak2006) and Dietze et al. (Reference Dietze, Haubrich, Klinger and Ullrich2007) report d-value ranges of 13–18 Å at 4.9–6.8 2Θ for smectite group minerals, so may be present in the studied sample. A further peak of very low relative intensities (c. 1%) at 10.48 2Θ angles refers to a rather uncommon mineral phase. d-values of 8.44 Å (1), 2.816 Å (0.47) and 2.544 Å (0.45) would suggest euchlorine. The complete reflex list and XRD measurement conditions are listed in the online supplementary material (S1 and Tables S2, S3; available at http://journals.cambridge.org/geo).
As a result, mineralogy, fabric and texture of the rock resemble those of ash falls and pyroclastic flows from explosive volcanic eruptions. The sharp vesicular blackish fragments and the spheroids most likely represent bubble wall shards and lapilli, respectively. Sample SH08/Unit E most likely represents a rhyolitic tuff that is rich in vitric components.
3.c. Geochemistry of the rhyolitic tuff
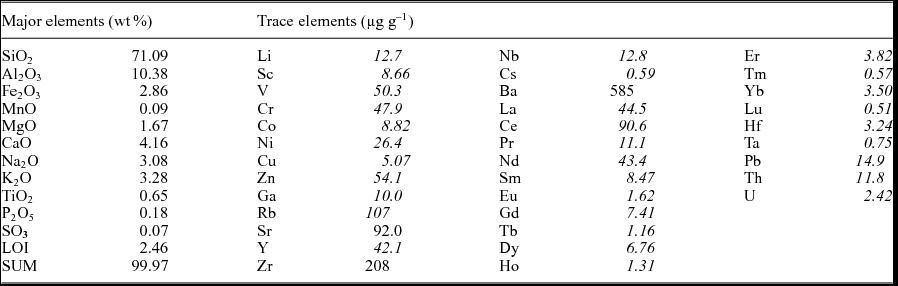
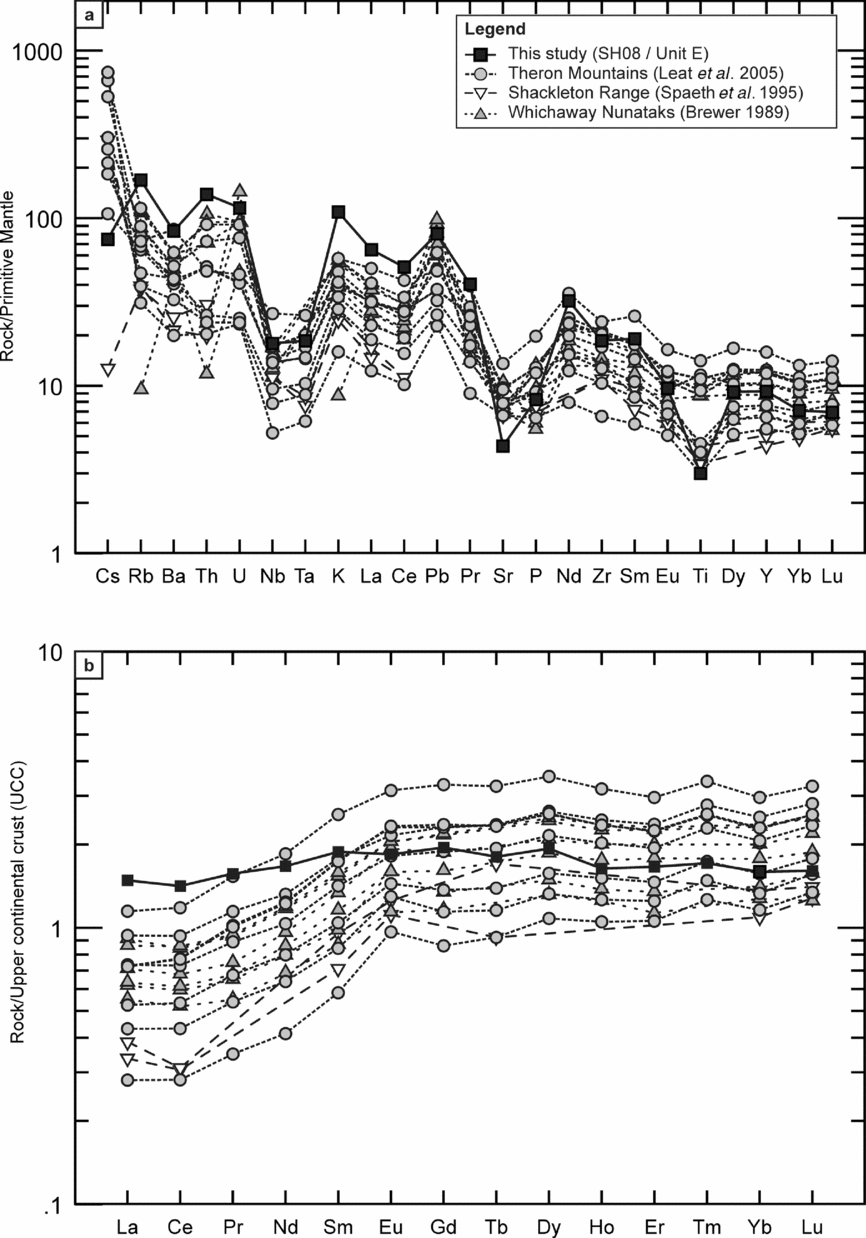
To investigate the geochemical character, ICP-MS/XRF measurements were performed (Table 1; online supplementary material S1). A molar Al2O3/(CaO+Na2O+K2O) ratio of 0.64 defines SH08 as a SiO2-rich, metaluminous rhyolite according to the TAS diagram of LeBas et al. (Reference LeBas, Lemaitre, Streckeisen and Zanettin1986). Concentrations of Fe2O3 (2.9 wt%), MgO (1.7 wt%) and TiO2 (0.7 wt%) are comparatively low. An incompatible-element diagram of the sample, normalized to primitive mantle, shows troughs for Nb, Ta, Sr and Ti and spikes for Pb, indicating enrichment of more incompatible relative to less incompatible elements (Fig. 5a). The Nb, Ta and Pb anomalies are characteristic of continental crust and volcanic rocks at convergent plate boundaries. The chondrite-normalized rare Earth element (REE) pattern displays light REE considerably enriched relative to heavier REE (LaN/LuN = 9.29), and is almost identical to that of average upper continental crust (Taylor & McLennan, Reference Taylor and McLennan1985; Fig. 5b). A plot of REE normalized to average upper continental crust (UCC; Taylor & McLennan, Reference Taylor and McLennan1985) shows an almost uniform distribution in contrast to other Jurassic magmatic rocks from Coats Land (Fig. 5b). In the Rb v. (Yb+Ta) discrimination diagram of Pearce et al. (Reference Pearce, Harris and Tindle1984), the sample plots in the field for volcanic-arc granites. Rb and most other fluid-mobile elements (K, Cs, Ba and Pb) are enriched in sample SH08, which suggests that Unit E was not subject to major hydrothermal alteration and metasomatism.
Major- and trace-element concentrations of sample SH08.

Data in italics analysed by ICP-MS, data in roman by XRF.
(a) Comparison of incompatible-element diagrams of Jurassic magmatic rocks in Coats Land. The patterns look similar for all samples and are consistent with volcanic-arc affinities. Normalizing values from Sun & McDonough (Reference Sun, McDonough, Saunders and Norry1989). (b) Upper continental crust normalized rare Earth element (REE) plot of the same Jurassic magmatic rocks. The small nearly horizontal REE spectrum of sample SH08 and the enrichment of the heavier relative to the lighter REE of the tholeiitic rocks are obvious. Normalizing values from Taylor & McLennan (Reference Taylor and McLennan1985).

Apart from the REE, the overall incompatible trace-element distribution of sample SH08/Unit E resembles the Jurassic dolerite intrusions from the neighbouring LaGrange Nunataks, Theron Mountains and Whichaway Nunataks (Brewer, Reference Brewer1989; Spaeth et al. Reference Spaeth, Hotten, Peters and Techmer1995; Leat et al. Reference Leat, Luttinen, Storey, Millar, Hanski, Mertanen, Ramo and Vuollo2005; Fig. 5a, b). In particular, the negative anomalies for Nb, Ta, Sr and Ti and positive anomalies for Pb are similar. The TAS diagram of the dolerite intrusions and SH08 refers to subalkaline volcanic series.
3.d. Geochronology: 40Ar/39Ar analyses
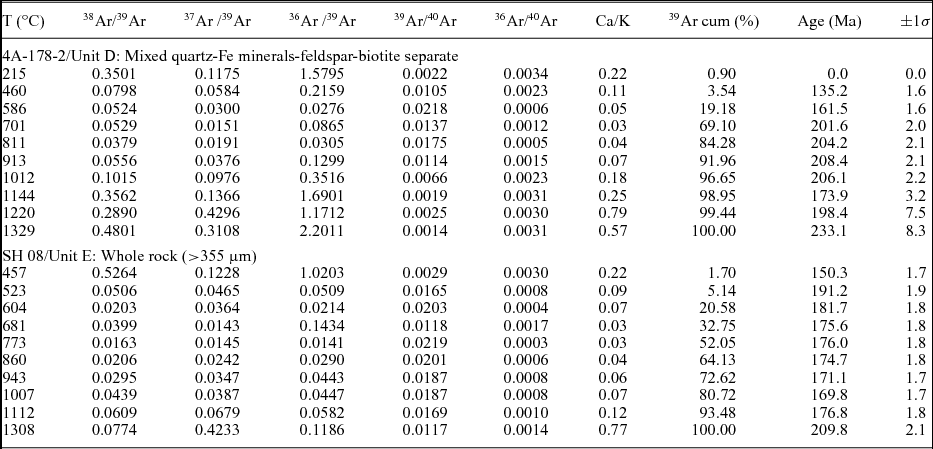
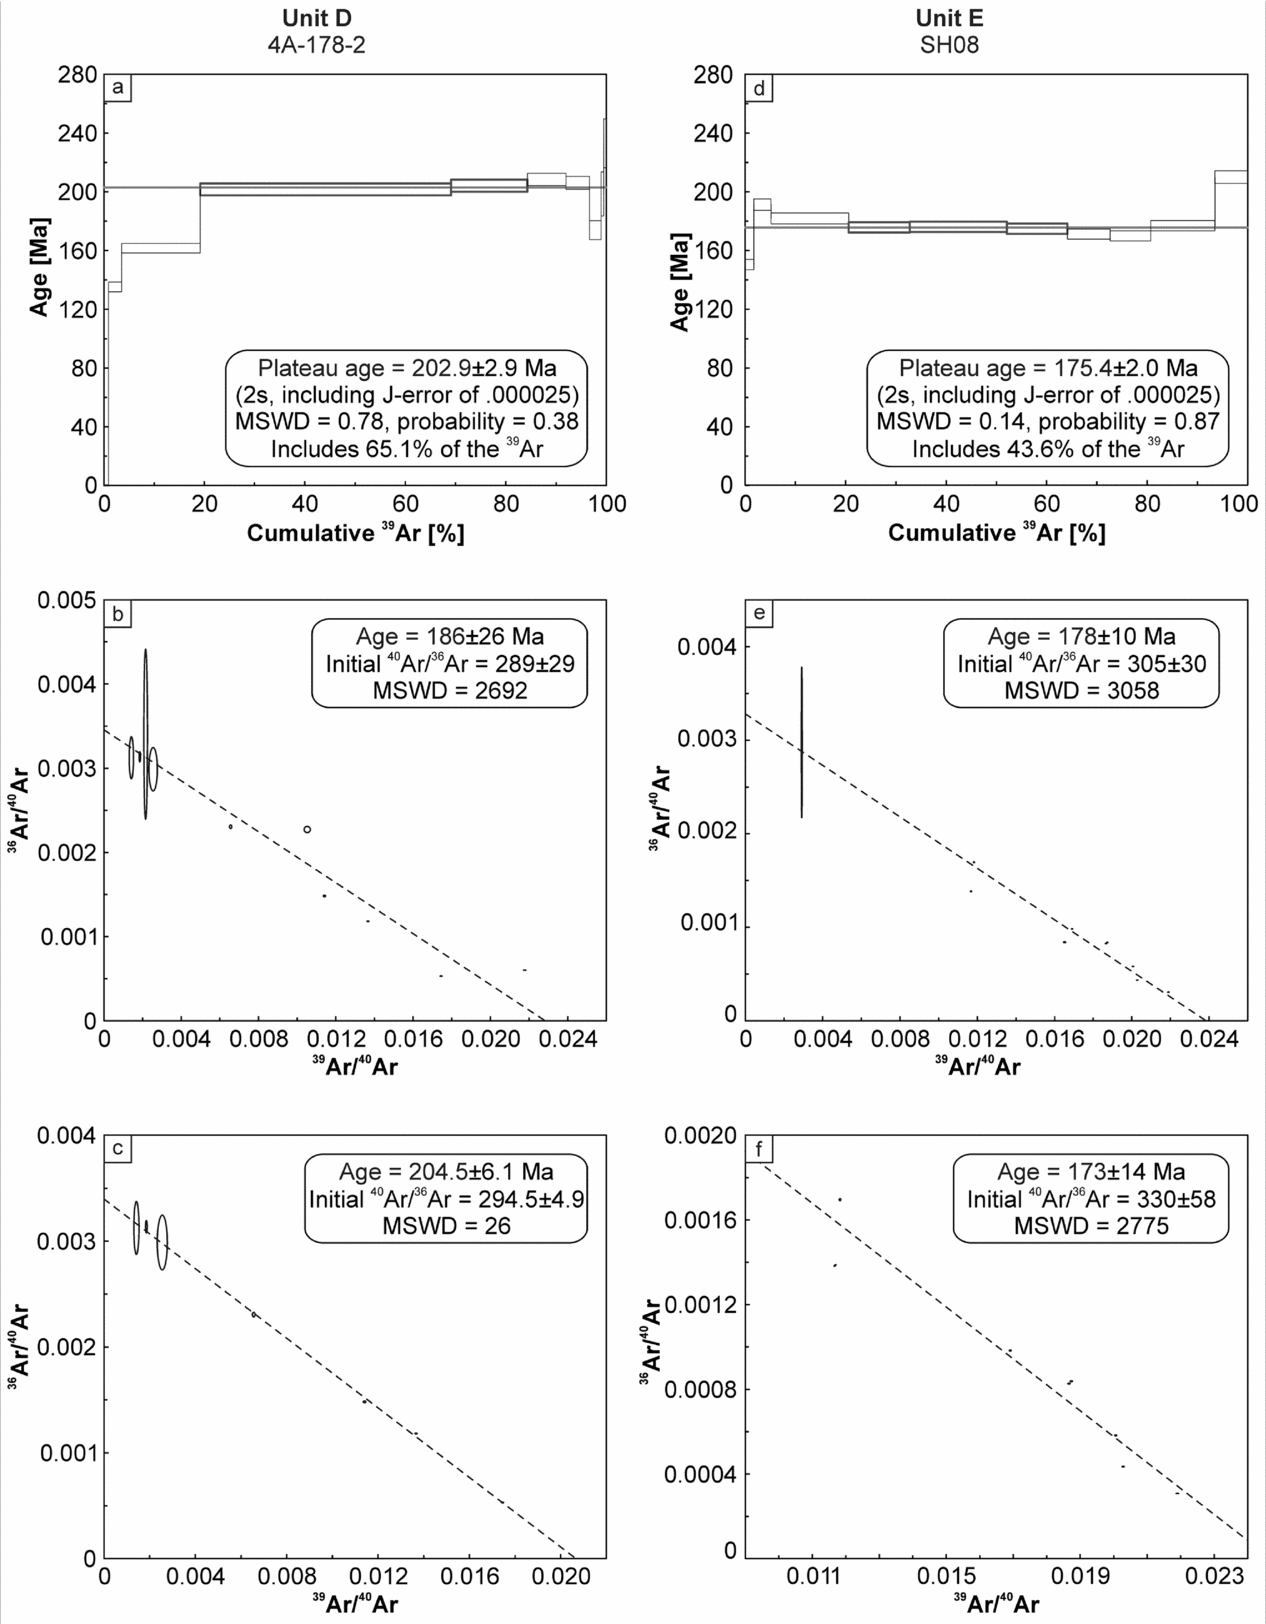
Buggisch et al. (Reference Buggisch, Kleinschmidt, Höhndorf and Pohl1994 b) performed 40K–39Ar whole-rock analyses on two fine-grained fractions (0.6–2 µm and 2–6 µm) from Unit D, and obtained ages of 181±2 Ma and 186±2 Ma, respectively. To define the time relationship between the top layers of the cover sequence, 40Ar/39Ar measurements were conducted on two samples from Units D and E (Table 2, Fig. 6, online supplementary material S1.4). Sample 4A-178-2 is a dark, fine-grained, feldspar-bearing sediment from Unit D. Thin-section analysis validates the observations made by Buggisch et al. (Reference Buggisch, Kleinschmidt, Höhndorf and Pohl1994 a), referring to a volcaniclastic rock. Limited sample material did not allow the separation of a pure feldspar fraction. A mixed separate consisting of quartz, Fe minerals, feldspar and minor biotite yielded a total fusion age of 193.1±2.0 Ma and involves a plateau age of 202.9±2.9 Ma (MSWD 0.78) for 65% of the released 39Ar with constant low Ca/K ratios (0.03–0.04). These ages are slightly older than the 40K–39Ar ages of Buggisch et al. (Reference Buggisch, Kleinschmidt, Höhndorf and Pohl1994 a). Dating of the >355 µm whole-rock fraction of sample SH08 from Unit E yielded a total fusion age of 178.2±2.2 Ma, and a plateau age of 175.4±2 Ma (MSWD 0.14) was calculated for 44% of the released 39Ar. Although this plateau age does not represent >50% of the released 39Ar, it is characterized by constant low Ca/K ratios (0.03–0.04) and is, within the error, identical to the total fusion age. The inverse isochron calculations of both samples yield ages with high MSWD values, and will therefore not be used further. We interpret the plateau ages of 203±3 Ma and 175±2 Ma as the currently best estimates for Unit D and Unit E, respectively, while being consistent with the stratigraphic order.
Ar/Ar data.

40Ar/39Ar data plots. (a) Age spectrum plot of sample 4A-178-2, Unit D. Bold rectangles show plateau steps; thin rectangles illustrate rejected plateau steps; box heights display the 2σ error; horizontal line shows plateau age. (b) Inverse isochron plot of all data points. (c) Inverse isochron point without outliers. (d) Age spectrum plot of sample SH08, Unit E (legend as for (a)). (f) Inverse isochron plot of all data points. (g) Inverse isochron point without outliers. (b, c, f, g) Ellipses display 2σ error.

3.e. Synopsis: Jurassic volcaniclastic rocks on Permian tillites
The metaluminous composition and overall geochemical character of SH08 refers to an I-type granite/rhyolite magma that was generated by partial melting of mafic lower crust. The sedimentary flow fabric of this sample in conjunction with abundant crystal fragments, as well as the occurrence of lapilli and bubble wall shards, is consistent with ash deposits from a violent rhyolite eruption. The 40Ar/39Ar ages of the sample from Units D/E bracket the volcanogenic sediment emplacement between 202 Ma and 175 Ma. Compared to Unit E, similar geochemical patterns and ages (163±13 – 183±11 Ma) of dolerite dykes and sills from the nearby LaGrange Nunataks, Whichaway Nunataks and Theron Mountains (Hofmann et al. Reference Hofmann, Kaiser, Klemm and Paech1980; Spaeth et al. Reference Spaeth, Hotten, Peters and Techmer1995; Leat et al. Reference Leat, Luttinen, Storey, Millar, Hanski, Mertanen, Ramo and Vuollo2005) imply a relation to the Ferrar event. Furthermore, the 40Ar/39Ar age of Unit E is consistent with the 40Ar/39Ar age of 176.6±1.8 Ma on the Ferrar tholeiitic rocks as a whole (Fleming et al. Reference Fleming, Heimann, Foland and Elliot1997).
The petrological, geochemical and geochronological analyses characterize Unit D and Unit E as products of the early and main phase of the Ferrar/Karoo magmatic cycle. These volcaniclastic sediments rest conformably or unconformably upon a few metres of basal Permo-Carboniferous sediments deposited during the initial Gondwana glaciation. These basal strata in turn nonconformably cover basement that has previously been truncated. The interpretation of our petrographic and geochemical data therefore indicates repeated basement (near-) surface exposition at least during early Permian and Late Triassic – Early Jurassic time, and defines a reliable frame for thermal history modelling of thermochronological data.
4. Thermochronology
4.a. Sampling
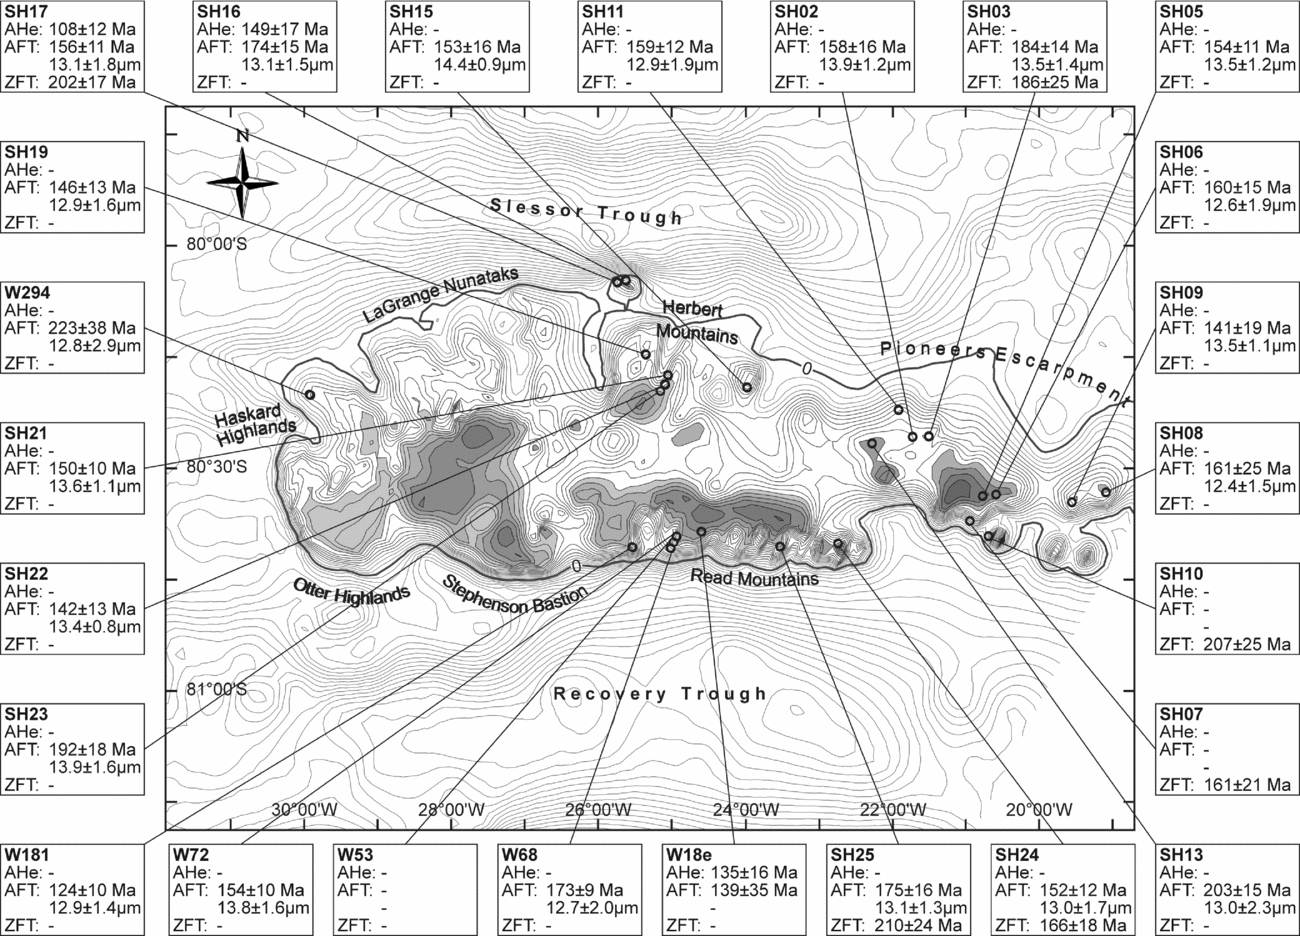
Twenty-eight in situ rock samples were collected from basement outcrops in the central and eastern Shackleton Range during GEISHA and EUROSHACK expeditions of the German Federal Institute for Geosciences and Natural Resources (BGR) in 1987/88 and 1994/95, mainly from the following mountain massifs: Herbert Mountains, Pioneers Escarpment, Read Mountains and Haskard Highlands (Fig. 7; online supplementary Table S1). Twenty-two specimens were used for AFT analysis, with 13 of them being re-analysed. Seven samples were suitable for AHe measurement. Zircons from seven locations had already been dated by ZFT thermochronology (Lisker, Schäfer & Olesch, Reference Lisker, Schäfer and Olesch1999). As a result, each of the 22 individual sample locations were analysed with up to three independent thermochronometers for maximum palaeotemperature coverage and resolution. The spatial coverage of the samples did not contain vertical profiles, so palaeogeothermal gradients could not be determined.
Bedrock elevation map with sample sites and thermochronological results for the Shackleton Range, including AHe ages, AFT ages and mean track lengths and ZFT ages. Dots mark the sites of the thermochronology samples. AHe ages reported reflect central ages calculated using HelioPlot (Vermeesch, Reference Vermeesch2010). Bedrock elevation is based on Bedmap2 data (Fretwell et al. Reference Fretwell, Pritchard, Vaughan, Bamber, Barrand, Bell, Bianchi, Bingham, Blankenship, Casassa, Catania, Callens, Conway, Cook, Corr, Damaske, Damm, Ferraccioli, Forsberg, Fujita, Gim, Gogineni, Griggs, Hindmarsh, Holmlund, Holt, Jacobel, Jenkins, Jokat, Jordan, King, Kohler, Krabill, Riger-Kusk, Langley, Leitchenkov, Leuschen, Luyendyk, Matsuoka, Mouginot, Nitsche, Nogi, Nost, Popov, Rignot, Rippin, Rivera, Roberts, Ross, Siegert, Smith, Steinhage, Studinger, Sun, Tinto, Welch, Wilson, Young, Xiangbin and Zirizzotti2013). Grey areas illustrate the remnants of the former plateau palaeosurface, recently exposed at different elevation levels in nearly all rock massifs (Stephenson, Reference Stephenson1966; Skidmore & Clarkson, Reference Skidmore and Clarkson1972; Marsh, 1985).

4.b. Published ZFT data
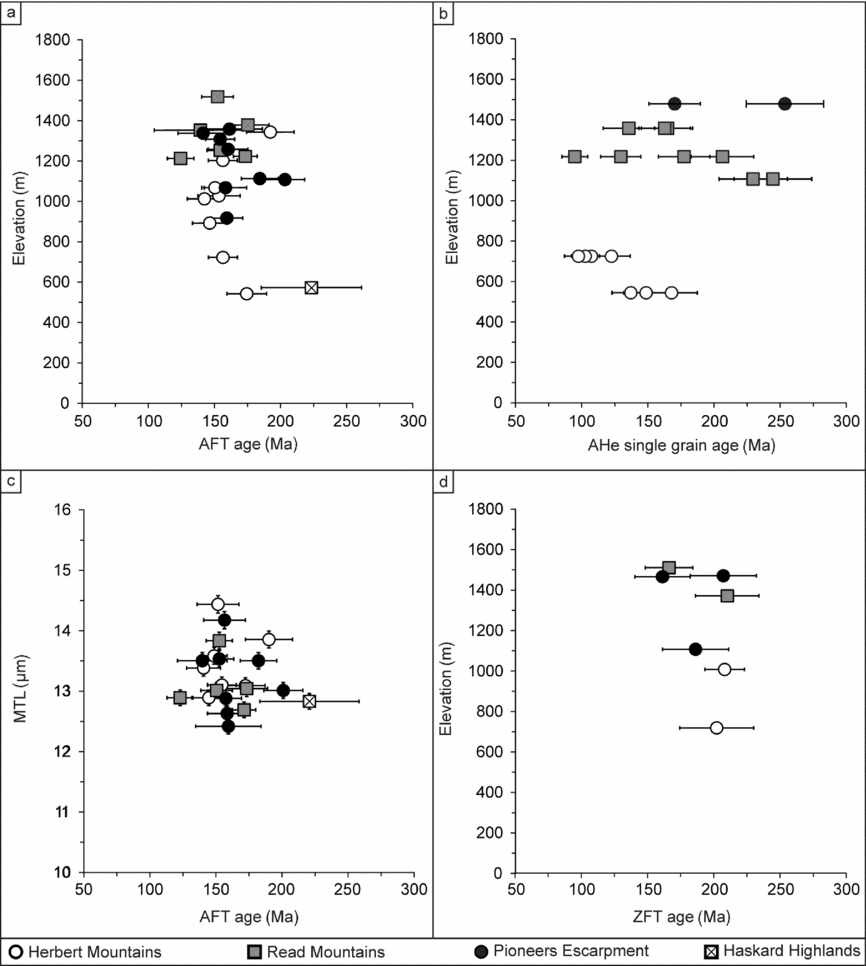
Lisker, Schäfer & Olesch (Reference Lisker, Schäfer and Olesch1999) published ZFT ages between 161±20 Ma and 214±24 Ma from seven locations in the southern and eastern Shackleton Range directly at or a few metres below the original palaeosurface (Fig. 7). Mean ZFT ages cluster narrowly around c. 190 Ma and are substantially younger than the time of rock formation and the latest Pan-African metamorphism (Will et al. Reference Will, Zeh, Gerdes, Frimmel, Millar and Schmädicke2009). Furthermore, the reported high χ² probabilities refer to single-age populations for all samples; all ages therefore reflect the same cooling event. The ages show no correlation with elevation and no trend between southern or northern units (Fig. 8d).
Thermochronological data plots. (a) Apatite fission track (AFT) age v. elevation. (b) Apatite (U–Th–Sm)/He single grain age v. elevation relation. (c) Mean track length (MTL) v. AFT age (‘boomerang plot’). (d) Zircon fission track (ZFT) age v. elevation. Symbols refer to the distinct massifs of the Shackleton Range.

4.c. AFT data
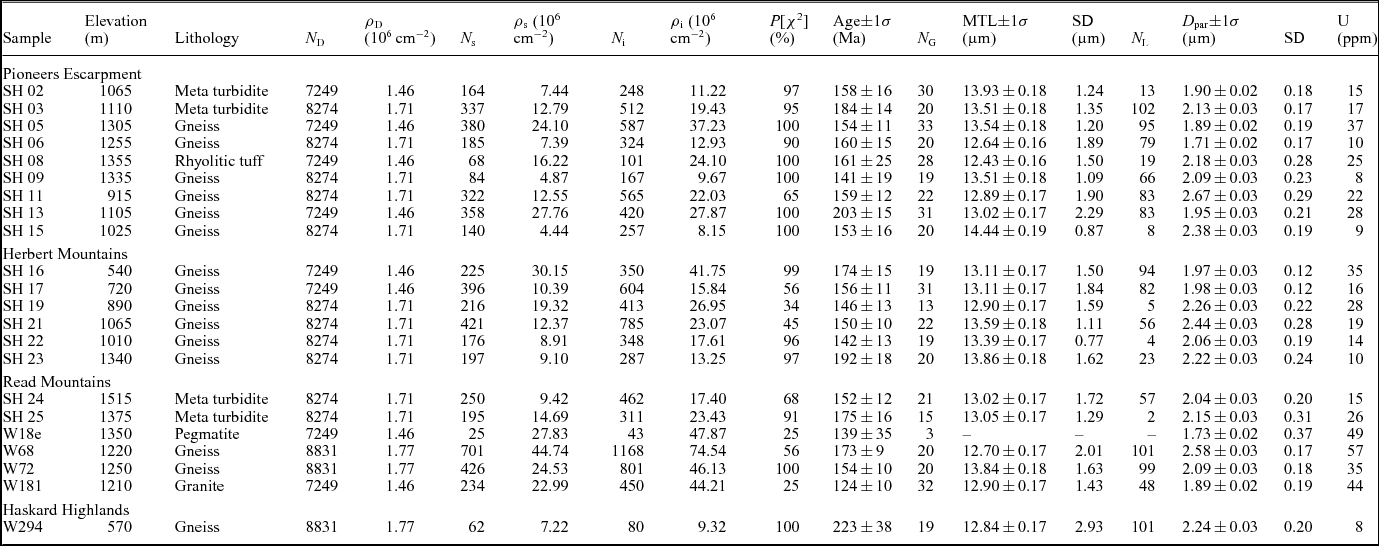
New AFT mounts were etched after the recommendations of Donelick, O'Sullivan & Ketcham (Reference Donelick, O'Sullivan and Ketcham2005). For etching conditions and calibration of existing mounts, see online supplementary material (S1.5). AFT sample ages vary between 124±10 and 223±38 Ma. Mean track lengths vary between 12.4±0.1 and 14.4±0.2 µm, with standard deviations of 1.0–2.9 µm. The kinetic parameter D par ranges from 1.73±0.35 to 2.38±0.25 µm. The ages of all individual samples pass the χ² test with high χ² probabilities, referring to a single-age population (Table 3; Figs 7, 8a–c; online supplementary material S1.5.2, Figs S1, S2). AFT ages of all samples are, within error, younger than the respective ZFT ages and postdate the last metamorphic overprint. There is no general correlation of AFT ages with mean track lengths, sample elevation or structural trends (Fig. 8a, c). However, the age spread within the different mountain massifs is similar: sample ages of the Pioneers Escarpment range over 141–203 Ma (with relief differences ∆h = 470 m), in the Herbert Mountains 142–193 Ma (∆h = 800 m) and in the Read Mountains 124–175 Ma (∆h = 385 m). The AFT age of 161±25 Ma from sample SH08 is little younger, but within error of the 40Ar/39Ar plateau age of 175±2 Ma obtained from the same site.
Apatite fission track results.

ζ= 332±6 for IRMM 540 Dosimeter glasses (N. Krohne). Ages were calculated using the software TRACKKEY, Version 4.2.g (Dunkl, Reference Dunkl2002). ρ D, ρ S, ρ i, N D, N s and N i denote the density and number of counted dosimeter, spontaneous and induced tracks; N G is number of counted apatite grains; N L is number of confined track lengths measured; P[χ2] is probability, where P[χ2]>5% indicates a single-age population (Galbraith, Reference Galbraith1981); 1σ errors: conventional method; Green (Reference Green1981).
4.d. AHe data
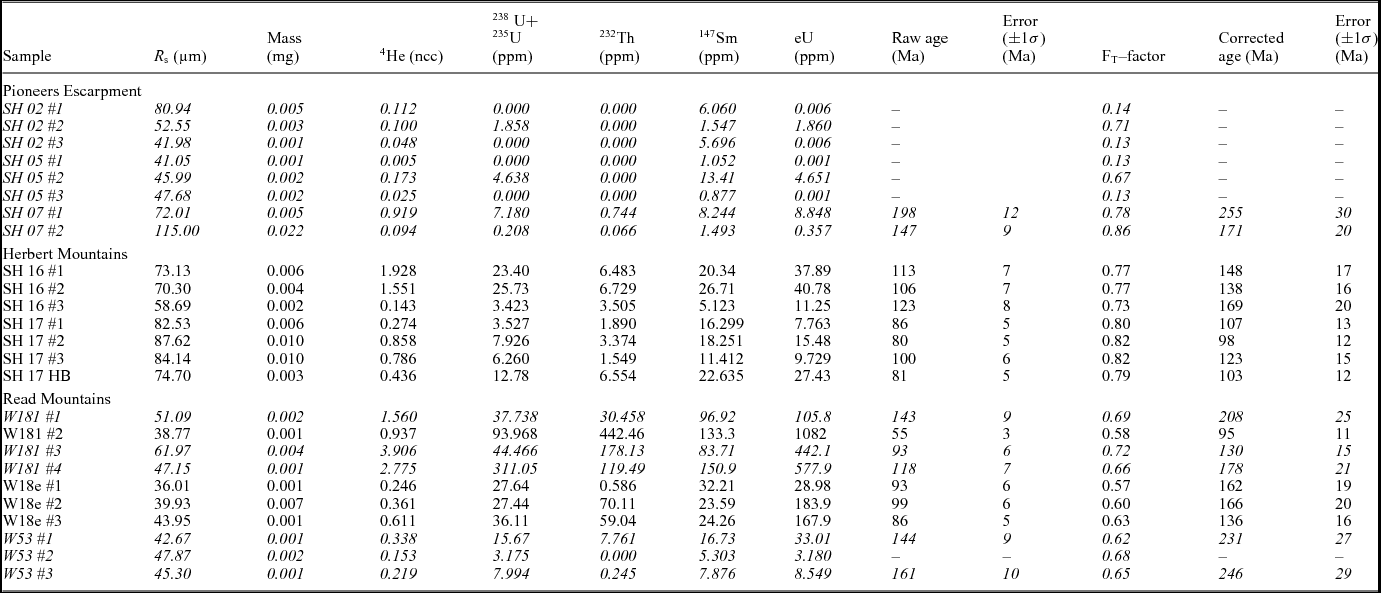
Apatite grains from seven samples yielded 3–5 aliquots that match the criteria for AHe measurement (e.g. Farley, Reference Farley2002; supplementary S1.5.3). A total of 19 of the 25 measured aliquots were considered for further interpretation, whereas either 238U or 232Th concentrations of aliquots SH02#1–3, SH05#1–3 and W53#2 were below the ‘hot blank’ of 0.0058 ng U and 0.0106 ng Th. Single grain ages were calculated using the 4He ingrowth equation, described by Farley (Reference Farley2002). FT-corrected single grain ages range from 95±11 to 255±30 Ma and replicate within error in most of the samples, except for SH07 and W181 (Table 4; Fig. 8b). Effective uranium (eU) values scatter strongly between 0.4 and 1082 ppm. FT-corrected single grain ages do not seem to correlate with eU (rxy = –0.29, r 2=0.08) and grain radius (rxy = –0.27, r 2=0.08). This excludes substantial 4He implantation from neighbouring U-, Th- or Sm-rich minerals (Spiegel et al. Reference Spiegel, Kohn, Belton, Berner and Gleadow2009) as well as enhanced 4He retention due to radiation damage (Shuster, Flowers & Farley, Reference Shuster, Flowers and Farley2006; Flowers et al. Reference Flowers, Ketcham, Shuster and Farley2009).
Apatite (U–Th–Sm)/He results.

4 He, 238U, 232Th and 147Sm were measured at the Department of Sedimentology and Environmental Geology of the University in Göttingen, Germany. Sample SH17 HB was measured at the Department of Geosciences, University of Bremen. The eU concentration calculated according to Shuster, Flowers & Farley (Reference Shuster, Flowers and Farley2006), Flowers et al. (Reference Flowers, Ketcham, Shuster and Farley2009) and Spiegel et al. (Reference Spiegel, Kohn, Belton, Berner and Gleadow2009). R S: sphere radius; FT-factor: α-ejection correction (Farley, Wolf & Silver, Reference Farley, Wolf and Silver1996). Discarded aliquots are formatted in italics (Section 4.d).
Single grain ages of SH16, SH17 and W18e replicate within error. They are, together with the age of W181#2, slightly younger than corresponding AFT ages. All other single grain ages are older than corresponding AFT and ZFT ages. Such ‘cross-over’ ages seem typical for old, slowly cooled metamorphic rocks (Flowers et al. Reference Flowers, Ketcham, Shuster and Farley2009). Ternary U–Th–He plots illustrate large intra-sample variations of isotopic compositions for the aliquots with cross-over AHe ages (online supplementary Fig. S3). Inhomogeneous fission track distributions within some apatite grains implies zoning of U (and probably also Th) concentration, which results in over- or under-correction of alpha-ejection (Fitzgerald et al. Reference Fitzgerald, Baldwin, Webb and O'Sullivan2006). As a consequence, aliquots with divergent intra-sample isotopic ratios from the replicating group (i.e. outside the 2σ error) and aliquots with cross-over AHe single grain ages are discarded from further interpretation.
The samples from the Herbert Mountains (SH16#1–3, SH17#1–HB) are located within a short distance of each other. They show consistent isotopic ratios and have similar ages that correlate tightly with AFT ages. The AHe ages of the whole sample suite do not correlate with elevation or with structural or lithological trends of the mountain massifs (Fig. 8b).
4.e. Thermal history modelling and interpretation
Thermal history modelling is a powerful tool to quantitatively deduce best-fitting time–temperature paths from the combined thermochronological dataset, covering a temperature range of 40–300°C. Modelling was conducted with HeFTy software, version 1.8.3 (Ketcham, Reference Ketcham2005). The program independently computes random time–temperature paths by applying various kinetic models and statistical tests. Modelled thermochronological data are compared to the observed thermochronological data, and characterized according to their matching (‘goodness of fit’). For this study we selected AFT samples comprising more than 50 confined track length measurements, and more than 19 dated single apatite grains if available, supplemented by AHe (up to three independent aliquot data) and ZFT age data. Sixteen samples from four mountain massifs matched these criteria. All input and model parameters for time–temperature history modelling are provided in the online supplementary data (Tables S3–S5). Thermal history modelling follows the approach described by Prenzel et al. (Reference Prenzel, Lisker, Balestrieri, Läufer and Spiegel2013). It relies on the basic assumption that a morphologically homogeneous mountain range topped by a palaeosurface results from uniform exhumation processes. Exhumation stages are identified by similar timing of cooling episodes for the whole sample suite, while maximum palaeotemperatures of individual samples may vary. At first, random thermal history paths produce best-fitting time–temperature paths for all samples individually by inverse HeFTy modelling. Afterwards, the best composite thermal history of individual HeFTy forward models serves as the base for a generic thermal history of all samples.
‘Inverse modelling’ was conducted on each sample to derive various best-fitting time–temperature paths according to ‘constraint boxes’ set on the basis of thermochronological data and geological markers (online supplementary Table S5). Geological time and temperature markers for the palaeosurface position are: (1) initial basement burial of tillites imply surface temperatures at c. 300 Ma; (2) ZFT data indicate cooling through the zircon partial annealing zone (c. 320–180°C) at c. 200 Ma (ZPAZ; Yamada et al. Reference Yamada, Tagami, Nishimura and Ito1995); (3) deposition of Jurassic volcaniclastic rocks mark Jurassic surface position (Jurassic atmospheric temperature was c. 20°C; Chandler, Rind & Ruedy Reference Chandler, Rind and Ruedy1992); and (4) recent surface temperatures with consideration of the orographic gradient are required due to recent surface exposure (online supplementary Table S6). All inverse modelling specifications were put into an input ASCII-textfile (‘batch mode’) to warrant equal modelling conditions for each sample run. A total of 250000 individual thermal history paths were tested and areas of the statistical best fitted paths were outlined.
Subsequent ‘forward modelling’ aimed to merge the individual thermal histories to one common, consecutive scenario for the whole sample suite. Resulting representative time–temperature paths rely on the distinct best-fit inverse modelling results and compelling constraints, such as timing of temperature changes and spatial relationships.
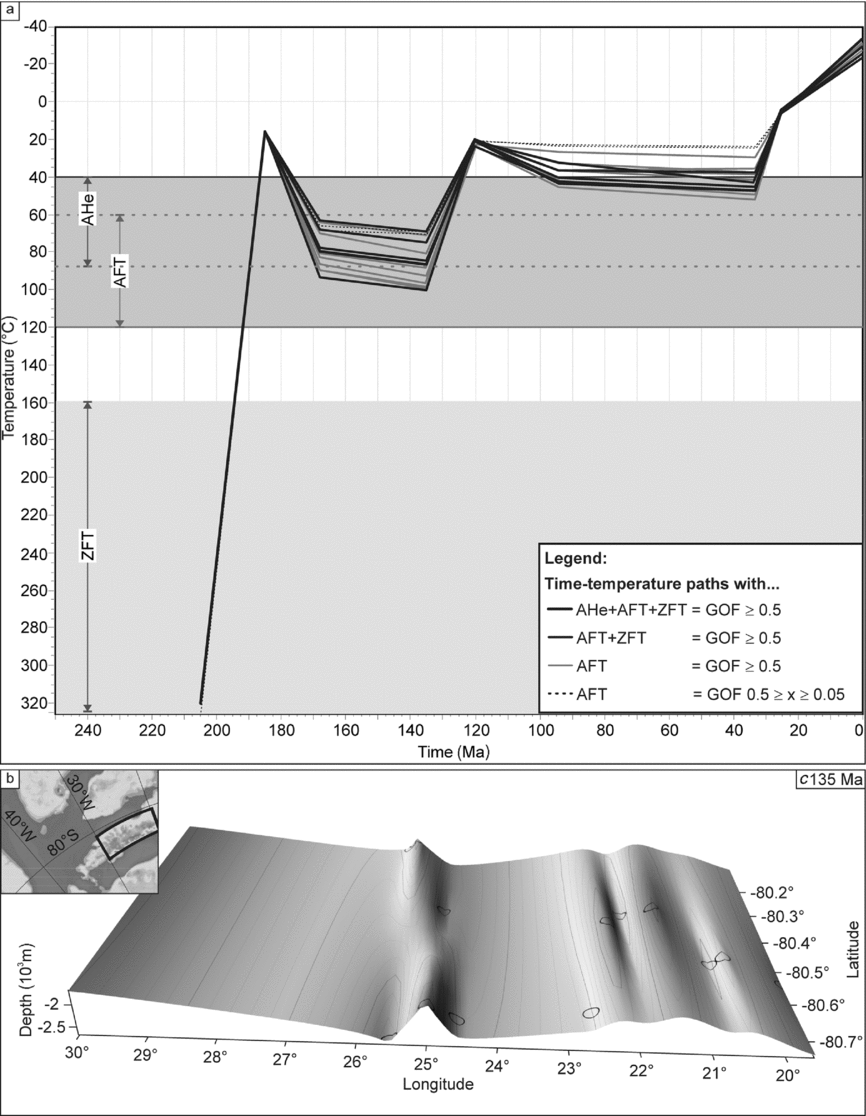
Inverse time–temperature models of all samples are very similar, with only minor variation. They imply: (1) fast cooling c. 200 Ma to Jurassic surface temperatures; (2) reheating during 175–130 Ma; and (3) cooling during 130–55 Ma to low temperatures (online supplementary Fig. S4). Common time–temperature paths obtained from forward modelling favour rapid cooling from 300–320°C to temperatures of 20±10°C between 205 and 175 Ma, subsequent reheating to 60–95°C at 170 Ma and to 70–100°C at 135 Ma (Fig. 9). Temperatures of all samples decrease below 40°C at 120 Ma. Furthermore, thermal history modelling of two samples with multiple AHe age data tentatively support a temperature increase of up to 50°C during 94–33 Ma, which is also integrated into thermal history models without AHe age information. Final cooling to recent surface temperatures is interpolated on the basis of the best fits of the thermochronological modelling program and the achievement of a common history valid for all samples. This scenario suggests rapid cooling from up to 50°C to 5°C at 25 Ma and ongoing surface cooling according to polar conditions.
(a) Compilation of common thermal history models from the Shackleton Range modelled with HeFTy. Grey areas illustrate the temperature sensitivity zones of the different thermochronometers: (U–Th–Sm)/He (AHe) over the range 40–85°C (Wolf, Farley & Silver, Reference Wolf, Farley and Silver1996), apatite fission track (AFT) over 60–120°C (Wagner, Reference Wagner1972) and ZFT over 160–320°C (Yamada et al. Reference Yamada, Tagami, Nishimura and Ito1995). For thermal history inversion of the particular samples see supplementary data (Fig. S3). (b) Interpolated 3D map of maximal depths of the Shackleton Range Basin at c. 135 Ma based on thermal history models. Circles indicate the sample positions. The map infers a general N–S-aligned trend of troughs, suggested here likely to represent N–S-trending faults. This is well in line with the geological observations for the Weddell Sea and Coats Land region (e.g. Ferris, Vaughan & Storey, Reference Ferris, Vaughan and Storey2000; Brommer, Millar & Zeh, Reference Brommer, Millar and Zeh1999). Thick rectangle in the inset provides an overview of the interpolated area. For a more detailed orientation according to sample locations and recent (sub-) ice morphology, see Figure 7.

5. Exhumation and long-term landscape evolution of the Shackleton Range
5.a. Transantarctic Basin
The Shackleton Range formed part of the active outer Panthalassan margin of Gondwana since the amalgamation of the supercontinent. Pan-African molasse fanglomerates and sandstones are preserved in the Ordovician Blaiklock Glacier Group in the western Shackleton Range (Clarkson & Wyeth, Reference Clarkson and Wyeth1983). Duration and original thickness of the respective basin are not constrained and cannot be specified by our data, but the nonconformity of Permo-Carboniferous tillites on basement indicates that most of the Blaiklock Glacier strata must have been eroded during late Palaeozoic time.
The glacial deposits in the eastern Shackleton Range are key to the late Palaeozoic – early Mesozoic evolution of the Weddell Sea region. Such tillite strata within Beacon rocks can be traced along the whole Panthalassan Gondwana margin in the adjacent Theron Mountains, Whichaway Nunataks, Pensacola Mountains and Ellsworth-Whitmore Mountains, but also throughout the massifs of the Transantarctic Mountains and in Dronning Maud Land and Namibia (Collinson et al. Reference Collinson, Isbell, Elliot, Miller, Miller, Veevers, Veevers and Powell1994; Isbell, Cole & Catuneanu, Reference Isbell, Cole, Catuneanu, Fielding, Frank and Isbell2008). They rest either above a nonconformity on basement or (e.g. in the central Transantarctic Mountains) disconformably on Devonian strata. Deposition of the largely unfossiliferous tillites commenced diachronously between Late Carboniferous time in the Ross Sea sector of the Transantarctic Mountains and Permian time in the Weddell Sea region. These sediments are referred to as the Pagoda Formation at the base of the Victoria Group, that piles up to a 1500 m thick Permian and 1200 m Triassic rock column in the central Transantarctic Mountains (Barrett, Reference Barrett and Tingey1992). They were deposited in the Permo-Triassic Transantarctic Basin, a series of narrow, subduction-related epicontinental- and back-arc basins along the Panthalassan margin of Gondwana (Collinson et al. Reference Collinson, Isbell, Elliot, Miller, Miller, Veevers, Veevers and Powell1994; Fig. 10).
Palaeogeographic and tectonic reconstruction of Permian – Early Jurassic Gondwana according to Veevers (Reference Veevers1988), Collinson et al. (Reference Collinson, Isbell, Elliot, Miller, Miller, Veevers, Veevers and Powell1994) and Harrowfield et al. (Reference Harrowfield, Holdgate, Wilson and McLoughlin2005). Position of the Ellsworth Whitmore Block (EWB) according to Grunow, Kent & Dalziel (Reference Grunow, Kent and Dalziel1991), Grunow (Reference Grunow1993), Flowerdew et al. (Reference Flowerdew, Tyrrell, Riley, Whitehouse, Mulvaney, Leat and Marschall2012) and Elliot, Fanning & Hulett (Reference Elliot, Fanning and Hulett2015). AP – Antarctic Peninsula; M – Madagascar; MBL – Marie Byrd Land; S – South America; SL – Sri Lanka; TI – Thurston Island.

The Permo-Triassic succession of the Shackleton Range was originally far thicker than the present remnants. Burial depths can be determined from maximum palaeotemperatures derived from geochronological and thermochronological data. On the one hand, the uniform ZFT age cluster at c. 190 Ma (Lisker, Schäfer & Olesch, Reference Lisker, Schäfer and Olesch1999) indicates a complete reset of the ZFT system. Depending on the degree of α damage, fission tracks in natural zircons are completely annealed at temperatures of 240–350°C during a heating duration of 10–25 Ma (Yamada et al. Reference Yamada, Tagami, Nishimura and Ito1995; Garver et al. Reference Garver, Brandon, Roden-Tice, Kamp, Ring, Brandon, Willett and Lister1999; Rahn et al. Reference Rahn, Brandon, Batt and Garver2004). On the other hand, amphibole and biotite 40K–39Ar ages of basement rocks of 499–598 Ma reflect post Pan-African cooling without any indication of 39Ar loss (Buggisch et al. Reference Buggisch, Kleinschmidt, Höhndorf and Pohl1994 b; Brommer, Reference Brommer1998; Brommer & Henjes-Kunst, Reference Brommer and Henjes-Kunst1999), and limit heating to the closure temperature of the biotite 40K–39Ar system, which is c. 350±50°C (e.g. Purdy & Jäger, Reference Purdy and Jäger1976). A combination of the thermal constraints and thermal history modelling therefore suggests heating of the Permian surface to Late Triassic temperatures of 240–350°C before rapid cooling to surface temperatures commenced around the time of the Karoo/Ferrar emplacement.
Permo-Triassic burial depths cannot be calculated in detail since the palaeogeothermal gradient of Coats Land is not yet known. However, the evolution of a volcanic back-arc basin in intermediate distance to the Shackleton Range would likely have enhanced heat flux and resulted in an increased gradient. The palaeogeographic reconstruction of Collinson et al. (Reference Collinson, Isbell, Elliot, Miller, Miller, Veevers, Veevers and Powell1994) locates the Shackleton Range c. 500 km from the magmatic trench. Recent geothermal gradients of volcanic back-arc basins (e.g. north Sumatra Basin, 400 km from the trench) are 35–63°C km–1, with an average of 44°C km–1 (Aadland & Phoa, Reference Aadland and Phoa1981; Humphreys et al. Reference Humphreys, Kemp, Lott, Bermanto, Dharmayanti and Samsori1994). Application of a geothermal gradient of 35–60°C km–1 stacks a sediment column of 4–10 km on the basement of the Shackleton Range. Even the minimum estimate of a 4 km thick Permo-Triassic Beacon overburden exceeds the thickness of the Victoria Group in the Transantarctic Mountains. It implies a systematic increase of this sequence along the Panthalassan margin from the present Australian towards the present African segment. The composition of this vanished rock section must necessarily remain speculative, but timing and thickness correlate well with the deposition pattern in adjacent regions. The abundance of calc-alkaline volcanic detritus in tightly to non-folded Permian sequences in central Transantarctic Mountains, Ellsworth-Whitmore Mountains and in the Theron Mountains marks the evolution of a volcanic forearc and back-arc basin system between the present Ross Sea and the proto-Weddell Sea region during the Permian – Late Triassic Gondwanide Orogeny with migration of the fold belt towards the east (Panthalassan margin by Collinson et al. Reference Collinson, Isbell, Elliot, Miller, Miller, Veevers, Veevers and Powell1994; Curtis, Reference Curtis2001; Flowerdew et al. Reference Flowerdew, Tyrrell, Riley, Whitehouse, Mulvaney, Leat and Marschall2012; Elliot, Fanning & Hulett, Reference Elliot, Fanning and Hulett2015). Coats Land, including the Shackleton Range, the Whichaway Nunataks and Theron Mountains, represents a main depocentre within an extensive Permo-Triassic Transantarctic Basin (system).
Our thermal history models and recognition of Ferrar/Karoo volcaniclastics suggest sudden Late Triassic – Early Jurassic cooling in the Shackleton Range until re-exposition of the Middle Ordovician – Carboniferous palaeosurface (Fig. 9). This exhumation episode is obviously caused by rapid erosion of almost the complete Permo-Triassic cover due to basin inversion. Near-surface emplacement of Ferrar/Karoo sills within the Permian strata of the Theron Mountains (Hutton, Reference Hutton2009) proves coeval exhumation there, and can also be assumed for the Whichaway Nunataks. Late Triassic basin inversion appears to be part of a distinctive erosional episode observed between at least 210 and 195–190 Ma along the whole length of the Transantarctic Mountains that separates two phases of deposition. This stage was associated with considerable magmatic activity, at first silicic then mafic, represented by Late Triassic – Early Jurassic deposition of volcaniclastic sandstones and rhyolitic tuffs followed by extrusion of the tholeiitic Ferrar basalts (and its intrusive correlatives) at c. 180 Ma in the Transantarctic Mountains (e.g. Collinson et al. Reference Collinson, Isbell, Elliot, Miller, Miller, Veevers, Veevers and Powell1994; Elliot & Fleming, Reference Elliot and Fleming2000; Elliot et al. Reference Elliot, Fleming, Foland, Fanning, Cooper and Raymond2007; Elsner et al. Reference Elsner, Schöner, Gerdes, Gaupp, Harley, Fitzsimons and Zhao2013).
5.b. Weddell Sea rifting
The Panthalassan margin of Gondwana was subject to Early Jurassic extension, accompanied by bimodal igneous activity within the previous Permo-Triassic Transantarctic Basin (Dalziel et al. Reference Dalziel, Storey, Garrett, Grunow, Herrod, Pankhurst, Coward, Dewey and Hancock1987; Collinson et al. Reference Collinson, Isbell, Elliot, Miller, Miller, Veevers, Veevers and Powell1994; Elliot & Fleming, Reference Elliot and Fleming2000; this study). In the Shackleton Range, extension and bimodal igneous activity is marked by the ejection of silicic volcaniclastic rocks and their deposition upon a few tens of metres thick Permo-Carboniferous basal strata overlying the palaeosurface, and the emplacement of almost vertical N–S-trending mafic dykes at 186–179 Ma (Spaeth et al. Reference Spaeth, Hotten, Peters and Techmer1995; Brommer & Henjes-Kunst, Reference Brommer and Henjes-Kunst1999; Brommer, Millar & Zeh, Reference Brommer, Millar and Zeh1999). Our thermal history models record subsequent Jurassic – Early Cretaceous basement heating to temperatures up to 100°C. This temperature increase cannot be explained by enhanced heat flux from magmatic activity as the Jurassic dykes in the Shackleton Range are just a few metres thick and not younger than c. 179 Ma (Spaeth et al. Reference Spaeth, Hotten, Peters and Techmer1995).
Instead, this long-term temperature increase implies burial of the basement, potentially in a structurally bound basin. Long-lasting subsidence, extension and crustal thinning of the Weddell Sea embayment is generally confirmed by stretching factors of 1.5–2 and by the formation of contemporaneous rift structures such as the Filchner Rift (Studinger & Miller, Reference Studinger and Miller1999; Ferris, Vaughan & Storey, Reference Ferris, Vaughan and Storey2000; King, Reference King2000; Jordan et al. Reference Jordan, Ferraccioli, Ross, Corr, Leat, Bingham, Rippin, Le Brocq and Siegert2013). The predominantly N–S- to NE–SW-oriented magnetic trends of Weddell Sea embayment and offshore Weddell Sea (Hübscher, Jokat & Miller, Reference Hübscher, Jokat, Miller, Storey, King and Livermore1996 a, b; Golynsky & Aleshkova, Reference Golynsky and Aleshkova2000; Jordan et al. Reference Jordan, Ferraccioli, Ross, Corr, Leat, Bingham, Rippin, Le Brocq and Siegert2013) prove orthogonal extension. Spaeth et al. (Reference Spaeth, Hotten, Peters and Techmer1995), Brommer & Henjes-Kunst (Reference Brommer and Henjes-Kunst1999) and Brommer, Millar & Zeh (Reference Brommer, Millar and Zeh1999) report similar trends of dykes and normal faults from the northern Shackleton Range. This structural coincidence and our thermal histories place the Shackleton Range in a basin that became involved later in the rifted margin of the Weddell Sea. Thermochronological data are not available from the Whichaway Nunataks and the Theron Mountains, but NE–SW-aligned faults are consistent with this scenario (Fig. 11).
Compilation of offshore faults, magnetic anomalies and general rifting directions during Jurassic and Cretaceous time (Brook, Reference Brook1972; Marsh, 1985; Peters, Reference Peters1989; Kristoffersen & Hinz, Reference Kristoffersen, Hinz, Thomson, Crame and Thomson1991; Hübscher, Jokat & Miller, Reference Hübscher, Jokat, Miller, Storey, King and Livermore1996 a; Leitchenkov, Miller & Zatzepin, Reference Leitchenkov, Miller, Zatzepin, Storey, King and Livermore1996; Ferris, Vaughan & Storey, Reference Ferris, Vaughan and Storey2000; Kovacs et al. Reference Kovacs, Morris, Brozena and Tikku2002; König & Jokat, Reference König and Jokat2006; Jordan et al. Reference Jordan, Ferraccioli, Ross, Corr, Leat, Bingham, Rippin, Le Brocq and Siegert2013). Outline of the Ferrar/Karoo province after Elliot (Reference Elliot, Storey, Alabaster and Pankhurst1992). Stippled lines indicate inferred faults. Contour lines originated from the Antarctic Digital Database. Inset: overview of the plate configuration and structures during 160–120 Ma, modified after Martin et al. (Reference Martin2007). Position of the Ellsworth Whitmore Block (EWB) according to Grunow, Kent & Dalziel (Reference Grunow, Kent and Dalziel1991). Abbreviations as for Figure 10.

A depocentre of similar spatial trend, the Mesozoic Victoria Basin, evolved contemporaneously along the Transantarctic Mountains (Lisker & Läufer, Reference Lisker and Läufer2013). The coexistence between Mesozoic Victoria Basin and the Jurassic basin along the eastern Weddell Sea margin favours a regional extension/transtension regime along the Panthalassan margin during Jurassic time, and may indicate initial passive margin transformation. Palaeogeothermal gradients within the Mesozoic Victoria Land Basin were calculated by means of combined thermochronological and organic maturity data by Prenzel et al. (Reference Prenzel, Lisker, Elsner, Schöner, Balestrieri, Läufer, Berner and Spiegel2014). They decrease from c. 45°C km–1 during the Ferrar event at c. 180 Ma to conventional 25°C km–1 during the Cenozoic. For this gradient and a Jurassic surface temperature of 15–20°C (e.g. Chandler, Rind & Ruedy, Reference Chandler, Rind and Ruedy1992), maximum palaeotemperatures of 70–100°C (Fig. 9a) refer to 2.0–3.4 km of Late Jurassic overburden. Varying burial depths may be related to a pre-rift topographic surface characterized by narrow N–S-trending valleys and ranges (Fig. 9b), perhaps induced by the Jurassic stress regime.
The post-Gondwana thermal history of the Shackleton Range is dominated by Early Cretaceous uniform cooling from 70–100°C to below 40°C. Fast erosion of the sedimentary overburden and basin inversion commencing at c. 135 Ma correlate with a significant change of spreading direction and plate movements in the Weddell Sea at 130 –135 Ma (e.g. Grunow, Kent & Dalziel, Reference Grunow, Kent and Dalziel1991; Kristoffersen & Hinz, Reference Kristoffersen, Hinz, Thomson, Crame and Thomson1991; Kovacs et al. Reference Kovacs, Morris, Brozena and Tikku2002; König & Jokat, Reference König and Jokat2006). This event led to stagnation of the N–S-trending rifts, including the Filchner Rift (Kristoffersen & Hinz, Reference Kristoffersen, Hinz, Thomson, Crame and Thomson1991; Martin, Reference Martin2007) and the initiation of sinistral transtensional movement in the Weddell Sea (Kristoffersen & Haugland, Reference Kristoffersen and Haugland1986). Plate motion changes offshore probably modified the onshore stress regime oblique to the rift structures of the Shackleton Range. Such a transition to oblique extension relative to basin margin faults often results in basin inversion (De Paola et al. Reference De Paola, Holdsworth, McCaffrey and Barchi2005), and incorporated the Shackleton Range into the Weddell Sea rift shoulder. A further active sinistral strike-slip movement between the Ellsworth-Whitmore Block and East Antarctica can be traced at the Filchner Rift and implies that the Shackleton Range was bordered by two divergent strike-slip faults trending oblique to the faults (Fig. 11; Grunow, Reference Grunow1993; Jordan et al. Reference Jordan, Ferraccioli, Ross, Corr, Leat, Bingham, Rippin, Le Brocq and Siegert2013). We suggest that oblique transtension (partitioned transtension) initiated basin inversion in the Shackleton Range.
5.c. Landscape evolution since Cretaceous time
Implementation of the AHe age information into the thermal history models indicates renewed heating of the palaeosurface on the Shackleton Range to temperatures of c. 50°C during c. 120–33 Ma, referring to shallow burial in the order of c. 1 km for a conventional geothermal gradient. Burial beginning at 120 Ma could be linked with the termination of the Ellsworth-Whitmore movement relative to East Antarctica and protracted extension, related to ongoing rifting and dispersion of Gondwana (e.g. Kristoffersen & Haugland, Reference Kristoffersen and Haugland1986; Hübscher, Jokat & Miller, Reference Hübscher, Jokat, Miller, Storey, King and Livermore1996 a, b; Leitchenkov, Miller & Zatzepin, Reference Leitchenkov, Miller, Zatzepin, Storey, King and Livermore1996; Martin, Reference Martin2007). The presence of a shallow Cretaceous basin close to the Weddell Sea embayment places the surface of the Shackleton Range near palaeo sea-level elevations. It challenges the hypothesis of the Eocene–Oligocene upland area in the Weddell Sea embayment by Wilson et al. (Reference Wilson, Jamieson, Barrett, Leitchenkov, Gohl and Larter2012) that relies on the interpolation of largely uncertain stratigraphic units from geophysical properties in the Weddell Sea.
Final cooling from c. 50°C to surface temperatures beginning at 35 Ma implies the erosion of the Late Cretaceous – Palaeogene sedimentary overburden and provides the minimum time constraint for basin inversion and uplift of wide parts of Coats Land. These processes do not appear to be associated with any significant tectonic event in the immediate vicinity, but could be related to large-scale plate processes of either the separation between Patagonia and the Antarctic Peninsula (Livermore & Woollett, Reference Livermore and Woollett1993) or the enhanced activity along the West Antarctic Rift system and uplift of the Transantarctic Mountains (Behrendt & Cooper, Reference Behrendt and Cooper1991; Prenzel et al. Reference Prenzel, Lisker, Elsner, Schöner, Balestrieri, Läufer, Berner and Spiegel2014). A similar influence of far-field tectonics on passive margins long after break-up is confirmed by the late reactivation of regional faults along African and Brazilian passive margins (Gallagher & Brown, Reference Gallagher and Brown1997). In this context, even minor far-field effects of remote tectonism would have been sufficient to initiate exhumation of the Shackleton Range.
Furthermore, the Eocene–Oligocene transition at 34 Ma marks a time of a major climate change that triggered the permanent glaciation of Antarctica and created an enormously efficient glacial erosion regime until Miocene time (Robert & Maillot, Reference Robert, Maillot, Barker and Kennett1990; Poole, Cantrill & Utescher, Reference Poole, Cantrill and Utescher2005; Thorn & DeConto, Reference Thorn and DeConto2006). Swift Neogene sedimentation of thick transitional continental and glacial deposits in the offshore Weddell Sea manifests as enhanced sediment supply due to increased onshore erosion which was, in turn, climatically influenced (Rogenhagen et al. Reference Rogenhagen, Jokat, Hinz and Kristoffersen2005; Huang, Gohl & Jokat, Reference Huang, Gohl and Jokat2014). Fast exhumation of the little consolidated Cretaceous and Palaeogene basin deposits again exposed the palaeosurface on the Shackleton Range, with only some protected remnants of its Permo-Triassic and Jurassic cover remaining preserved, and triggered uplift and relief formation. Subsequent surface modification and relief development is assumed to have been controlled by fluvial and glacial bedrock incision along pre-existing faults (Sugden et al. Reference Sugden, Fogwill, Hein, Stuart, Kerr and Kubik2014) and seem to be restricted to it. The rather homogenous, slight dip of the palaeosurface and sedimentary remnants indicates late tilting. Tilting, as well as the dissection and displacement of the palaeosurface patches, were likely provoked due to onwards uplift and associated with reactivation of local faults, now hosting local glaciers (Fig. 2). The uplift of the Shackleton Range to recent elevations appears to be mostly triggered by composed isostatic response to the removal of the sedimentary overburden, massive bedrock incision and vertical down-wearing close to valley/trough margins.
6. Conclusions
The study demonstrates the great potential of combined petrologic, geochemical and geochronological data to determine age and setting of unfossiliferous sequences and to serve as key constraints for the age determination of palaeosurfaces and thermal history modelling of thermochronological data. It also helps to substantially improve the resolution of the thermal history models.
The Shackleton Range was originally postulated to have been exposed during most of the Phanerozoic Eon, and to have experienced very little deposition during this time. Episodic exhumation and uplift was mainly assumed to have occurred during Jurassic and Cretaceous times. However, this scenario was rather unusual for the Panthalassan margin of Gondwana, and could be thoroughly revised in this study.
Instead, a regional erosion surface, similar to the Kukri peneplain on the Transantarctic Mountains, established soon after truncation of the Pan-African Orogen. Contrary to traditional perception, this surface was buried for most of the time beneath a kilometre-thick sedimentary cover, and became exposed only episodically. Permo-Triassic burial to depths of 4–10 km within the ‘Transantarctic Basin’ identifies this basin as a truly trans-Gondwanan feature with a general trend of increasing basin depth towards the Weddell Sea.
There are also striking similarities with the evolution of the Mesozoic Victoria Basin in the Ross Sea region (Lisker & Läufer, Reference Lisker and Läufer2013). Both basins are characterized by long-lasting basin extension initiated by the Jurassic Ferrar Event, diffuse crustal thinning accompanying the disintegration of Gondwana, and a final switch to discrete rifting and basin inversion. Rifting of the Weddell Sea commenced during Early Cretaceous time, while the Mesozoic Victoria Basin persisted until the late Eocene Epoch.
Inversion of both the Transantarctic Basin and the Jurassic (proto-) Weddell Sea Basin were controlled by regional-scale tectonic processes. In contrast, final exhumation and uplift of the Shackleton Range from early Oligocene time seems to be mainly driven by climatic influence, primarily by the glaciation of the Antarctic continent and resulting fast down-wearing, glacial incision, and the respective isostatic response. In summary, the geological history of the Shackleton Range revealed here is not in contrast to the established evolution of the active Panthalassa margin; rather, it represents a typical example for the transition from an active to passive margin setting along the outer rim of Gondwana (Fig. 12).
Conclusive sketch of the post Pan-African geological history for the uppermost crust of the Shackleton Range, based on geological and geomorphological evidence and the thermal history models. Arrows indicate the timing of deposition of the sediments and light grey text the inferred basin deposits. Bold text highlights the individual basins. Text within the figure and the boxes at the bottom mark the geodynamic background and the tectonic history for the (proto-) Weddell Sea/Coats Land. For detailed information see Section 5.

Acknowledgements
This work was supported by the German Research Foundation (DFG) in the framework of the priority programme SPP 1158 ‘Antarctic Research with comparative investigations in Arctic ice areas’ by grants LI 745/15 to F. Lisker and LA 1080/9 to A. Läufer. U. Schnellbach, M. Olesch and F. Henjes-Kunst collected the rock samples during the GEISHA and EUROSHACK Expeditions of the Federal Institute for Geosciences and Natural Resources (BGR). We thank R.X. Fischer and the crystallography research group of the University of Bremen for XRD analyses. P. Stutz and S. Heidrich (University of Hamburg) are acknowledged for the XRF analysis and Y. Kapusta (Actlabs Canada) for discussions on the Ar/Ar dating results. S. Boger, G. Eagles and W. Jokat are acknowledged for discussions and valuable comments, and M. Studinger for providing aerial photographs of the Shackleton Range. The comments of an anonymous reviewer are greatfully acknowledged. We thank M. Allan for editorial handling.
Supplementary material
To view supplementary material for this article, please visit https://doi.org/10.1017/S0016756815000461.