I. INTRODUCTION
Doped semiconductor nanocrystals (NCs) have been extensively explored in the past decades due to their additional unique properties as compared pure counterparts, such as improved thermal and photochemical stability, longer lifetime, and larger Stokes shift (to avoid self-absorption/energy transfer). Reference Wu and Yan1–Reference Srivastava, Jana and Pradhan10 These advantages make such doped NCs potentially excellent candidates for applications in solar cells, biomedical sensing, light-emitting diodes (LEDs), and so on. Reference Wu and Yan1–Reference Norris, Efros and Erwin5 To date, the research mainly focus on Mn or Cu ions doped NCs and have great achievements. Reference Zhang, Li, Zhang, Zhou and Zhong6–Reference Zhang, Lou, Ji, Zhao and Zhong15 For example, the Mn-doped NCs with a high photoluminescence (PL) quantum yield (QY) up to 70% have been reported. Reference Levchuk, Wurth, Krause, Osvet, Batentschuk, Resch-Genger, Kolbeck, Herre, Steinruck, Peukert and Brabec12 Meanwhile, the Cu-doped NCs with emissions covering from blue to near infrared with PL QY up to 85% have been also reported. Reference Zhang, Lou, Ji, Zhao and Zhong15 However, the Mn-dopant emission is restricted to the orange–red region because the emission comes from the intrinsic 4T1–6A1 transition of Mn ions, which is relatively independent of the nature and size of host NCs. Reference Zhang, Li, Zhang, Zhou and Zhong6–Reference Cao, Li, Wang, Shang, Wei, Zheng and Yang9,Reference Levchuk, Wurth, Krause, Osvet, Batentschuk, Resch-Genger, Kolbeck, Herre, Steinruck, Peukert and Brabec12 The emission of Cu dopants exhibits extremely weak stability in air exposure due to the easy-going oxidation of Cu ions by mercapto-ligand termination. In fact, Ag, as a group IB element, is usually a promising candidate for modifying semiconductor materials owing to its high exchange-current density and low activation energy. It is also reported that, besides the tunable PL from blue to near infrared, Ag-doped NCs have good stability since the energy barrier of the Ag ion oxidation by the mercapto-ligand is much higher. Reference Xuan, Liu, Yu, Xie and Li16 Unfortunately, up to now, there have been only a few reports on highly luminous Ag doped NCs. Reference Xuan, Liu, Yu, Xie and Li16–Reference Chen, Huang, Li and Pan20
It is known that the efficiently doped emissions were often achieved in the binary intrinsic/alloyed group II–VI semiconductor NCs, such as CdS, CdSe, ZnSe, and ZnCdS. These hosts contain the toxic elements of Cd and/or Se, which are against the environment-friendly applications. Reference Cao, Zheng, Zhao, Wang, Gao, Wei, Zeng, Tian and Yang8,Reference Karan, Sarma, Kadam and Pradhan11–Reference Zhang, Zhou and Zhong13,Reference Wang, Xu, Shao, Wang, Xu and Cui17–Reference Chen, Huang, Li and Pan20 Thus, it is necessary to choose suitable “green” host materials. As a typical ternary chalcogenide material, Zn–In–S, is considered to be a near-ideal candidate to serve as a doping host because of its high chemical stability and composition-tunable optical band gaps. Reference Li, Liu, Hua, Tian and Zhao21–Reference Cao, Zheng, Zhao, Yang, Shang, Li, Yang and Fang24 These advantages have boosted the researching enthusiasm of academia and business circles as well, which brings a great progress in this field. For example, Cao et al. reported Mn-doped Zn–In–S NCs with tunable band gaps and high PL QY up to 56%. Reference Cao, Zhao, Yang, Li and Zheng7 Zhang et al. reported Cu-doped Zn–In–S NCs with PL QY up to 85%, indicating the attractive application prospect of those doped Zn–In–S NCs. Reference Zhang, Lou, Ji, Zhao and Zhong15 Compared with the research on Mn Cu-doped Zn–In–S NCs, there still remain material- and fabrication-related obstacles in realizing high performance and environmentally friendly Ag-doped ternary Zn–In–S NCs. Reference Xuan, Liu, Yu, Xie and Li16,Reference Zhang, Tian, Wang and Chen25 It should be pointed out that, when we were preparing this paper, a great improvement was made by Xuan and his co-workers; they prepared Ag-doped ZnInS NCs by a simple one-step non-injection process with a high PL QY of 43.5%. Reference Xuan, Liu, Yu, Xie and Li16 Nevertheless, it is also strongly desirable to develop highly efficient and wider emission window cadmium-free doped NCs to meet versatile applications such as bioimaging and solid-state lighting.
In present work, we reported the growth of cadmium-free Ag-doped Zn–In–S NCs with a high PL QY via a hot-injection strategy. By tailoring the reaction time, nucleation temperature, and Ag ion concentration, color-tunable PL emissions covering a broad visible spectral window were accomplished with a PL QY of 33%. The relationship between dopant concentrations and optical properties of the NCs was discussed in detail to reveal the PL mechanism of Ag-doped Zn–In–S NCs.
II. EXPERIMENTAL SECTION
A. Raw materials
The raw materials of silver nitrate (AgNO3, 99.8%), sulfur powder (S, 99.99%), 1-dodecanethiol (DDT, 98%), and oleylamine (OLA, 70%) were commercially available from Aladdin Company (Shanghai, China). 1-Octadecene (ODE, 90%) was bought from Adamas-beta Company (Shanghai, China). Zinc acetate (Zn(Ac)2, 99.99% trace metal basis) and Indium(III) acetate (In(Ac)3, 99.99% trace metals basis) were purchased from Sigma-Aldrich Company (St. Louis, Missouri). All the chemicals were used directly without further purification.
B. Synthesis of Ag-doped Zn–In–S nanocrystals
The Ag-doped Zn–In–S NCs were synthesized by a hot-injection method. Reference Cao, Zhao, Yang, Li and Zheng7 In a typical experimental procedure, 0.2 mmol In(Ac)3, 0.2 mmol Zn(Ac)2, 2 mL DDT, 5 mL ODE, and a given amount of AgNO3 were transferred into a 100 mL three necked flask and were degassed for 20 min by bubbling them with Ar at 100 °C. The temperature was further increased to a designated nucleation temperature, (changed from 160 to 240 °C) and then the S stock solution (0.5 mmol S powders dissolved into 1 mL OLA + 1 mL ODE) was injected quickly into the flask and then annealed for 20 min to form Ag-doped Zn–In–S core NCs. After that, the temperature was set at 200 °C, and 2 mL Zn stock solution (0.1 M Zn(Ac)2 in ODE) was then introduced into the reaction mixture and annealed for 20 min to overcoat a ZnS shell on the core NCs to obtain Ag-doped Zn–In–S core/shell NCs. The resultant colloidal solution was cooled down naturally to room temperature, followed by repeated purification for three times using toluene/methanol with the volume ratio of about 2:1.
It should be noted that the doping concentration in the manuscript is defined as the molar ratio of the Ag dopant to the total amount of cationic for the core NCs without a ZnS shell. The doping levels of 1.5%, 4%, 7%, 10%, 13%, and 15% were referred to as Samples A, B, C, D, E, and F, respectively. Further increase of the Ag dopant will lead to some precipitation in our case, which may be due to the formation of Ag2S NCs.
C. Structure characterization and optical property measurements
The morphology, microstructure, and composition of the obtained NCs were characterized by high-resolution transmission electron microscopy (HRTEM; JEM-2100F, JEOL Ltd., Tokyo, Japan), X-ray diffraction (XRD; D8 Advance, Bruker Corporation, Karlsruhe, Germany), inductively coupled plasma optical emission spectrometer (ICP-OES; Ultima 2, Horiba Jobin Yvon, Longjumeau, France), and X-ray photoelectron spectroscopy (XPS; Thermo ESCALAB 250XI, ThermoFisher Scientific, Inc., Waltham, Massachusetts). The ultraviolet-visible (UV-Vis) measurements of the obtained NCs were performed on a UV-Vis scanning spectrophotometer (U-3900, Hitachi Corp., Tokyo, Japan). The PL spectra, PL QYs, and PL decay curves were recorded using a spectrometer (Fluromax-4P, Horiba Jobin Yvon, Longjumeau, France) equipped with a QY accessory and a time-correlated single-photon-counting (TCSPC) spectrometer. A pulsed NanoLED (wavelength: 370 nm) was utilized as the exciting source for PL decay measurements. The lifetime data were fitted by a triple exponential function:
 $$I\left( t \right) = {y_0} + {A_1}\exp \left( {{{ - t} \mathord{\left/ {\vphantom {{ - t} {{\tau _1}}}} \right. \kern-\nulldelimiterspace} {{\tau _1}}}} \right) + {A_2}\exp \left( {{{ - t} \mathord{\left/ {\vphantom {{ - t} {{\tau _2}}}} \right. \kern-\nulldelimiterspace} {{\tau _2}}}} \right) + {A_3}\exp \left( {{{ - t} \mathord{\left/ {\vphantom {{ - t} {{\tau _3}}}} \right. \kern-\nulldelimiterspace} {{\tau _3}}}} \right)\quad ,$$
where τ1, τ2, and τ3 are the time constants, respectively. A 1, A 2, and A 3 are the normalized amplitudes of the components, respectively. The average lifetime was calculated by:
 $${\tau _{{\rm{ave}}}} = {{{A_1}\tau _1^2 + {A_2}\tau _2^2 + {A_3}\tau _3^2} \over {{A_1}{\tau _1} + {A_2}{\tau _2} + {A_3}{\tau _3}}}\quad .$$
III. RESULTS AND DISCUSSION
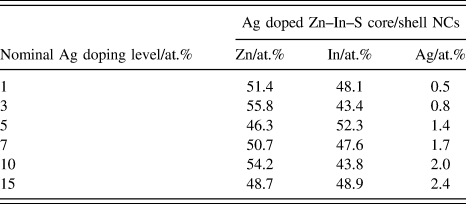
As we know, the real component in the final samples might greatly differ with the nominal values calculated from their precursor contents, especially for NCs with small sizes. Table I shows the relevant parameters for purified Ag-doped Zn–In–S core/shell NCs under different nominal Ag-doping levels by ICP-OES measurement. From Table I, it can be seen that the purified NCs exhibit an increase in Ag ion concentration from 0.5 to 2.4% with increasing the Ag precursor ratio from 1 to 15%. However, the calculated Ag-doping levels seem much lower than the nominal doping concentrations. It should be pointed out that, besides, due to the various chemical reactivates of Ag dopants and host precursors, the difference between the nominal concentration which is defined for the core NCs and the measured concentration for the core/shell NCs also should be noticed.
Relevant parameters for Ag doped Zn–In–S core/shell NCs with various nominal Ag-doping levels by ICP-OES measurement.

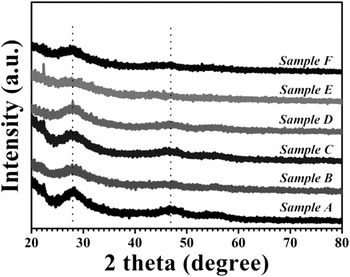
Figure 1 shows the typical XRD patterns of Ag-doped Zn–In–S cores with different nominal Ag-doping levels. The XRD patterns of the studied samples exhibit broad peaks, a typical feature of nanosized materials. All the diffraction peaks present for the samples with various doping concentrations correspond to the pattern of the cubic zinc-blende ZnS (JCPDS no. 05-0566), Reference Cao, Zhao, Yang, Li and Zheng7 indicating that doping Ag into the Zn–In–S host does not change the mother crystal structure.
Typical XRD patterns of Ag-doped Zn–In–S core NCs with various nominal Ag-doping levels.

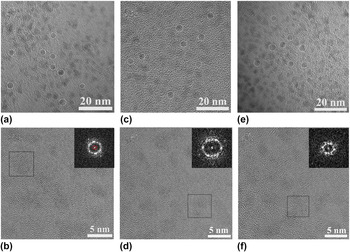
Figure 2 shows representative TEM and HRTEM images of the as-grown Ag-doped Zn–In–S core/shell NCs from Samples A, C, and F (i.e., with nominal doping levels of 1.5, 7, and 15%). As shown in Figs. 2(a)–2(c), the resultant NCs appear to be nearly spherical in shape and fairly monodisperse size distributions with average sizes of ∼3.2, 3.4, and 3.3 nm, corresponding to Samples A, C, and F, respectively. These almost identical size NCs with individual nominal Ag-doping levels confirm that the size of the Ag-doped Zn–In–S NCs host does not change. Figures 2(b), 2(d), and 2(f) show the HRTEM images of Samples A, C, and F, respectively, in which, the lattice fringes can be observed clearly. Together with the observed spots presented in the corresponding fast Fourier transform (FFT) patterns, [insets of Figs. 2(d)–2(f)] suggest that the as-prepared NCs are single-crystalline structures, rather than amorphous.
(a, c, and e) Typical TEM images and (b, d, and f) HRTEM images of Ag-doped Zn–In–S core/shell NCs from Samples A, C, and F, respectively. The insets in (b, d, and f) present the FFT patterns of a single NC recorded from the marked area.

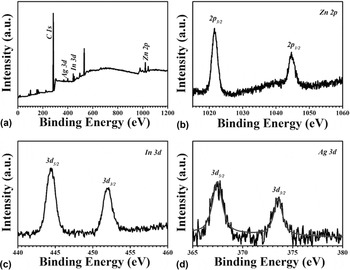
Figure 3 shows the XPS spectra of the as-prepared Ag-doped Zn–In–S core/shell NCs (Sample C). As indexed in Fig. 3(a), the main peaks of the survey spectrum belong to Ag, In, Zn, and C elements. The C signal is attributed to adventitious carbon, and the peak positions are calibrated by using the C 1s peak as a reference at 284.6 eV. The high-resolution XPS spectra of Zn 2p, In 3d and Ag 3d, are shown in Figs. 3(b)–3(d), respectively. The binding energies of Zn 2p 3/2 and Zn 2p 5/2 are located at 1021.6 and 1044.6 eV, respectively, as shown in Fig. 3(b), which is consistent with the standard-reference XPS spectrum of Zn(II). Reference Cao, Zheng, Zhao, Yang, Shang, Li, Yang and Fang24 Similarly, the peak spacing of In 3d 5/2 and In 3d 3/2 with binding energies of 444.5 and 452.0 eV, respectively, is 7.5 eV, matches well with In(III), Reference Cao, Ji, Zhao, Yang, Li and Zheng26 as shown in Fig. 3(c). Figure 3(d) shows the high-resolution XPS signal of the Ag dopant. The binding energies of Ag 3d 5/2 and Ag 3d 3/2 are 367.5 and 373.5 eV with a spacing of 6.0 eV agrees well with the standard-reference XPS spectrum of Ag(I). Reference Xiang, Xie, Wang, Zhong, Liang, Yang, Luo and Chen27 The above XPS data indicate that the as-synthesized products are constructed by Zn2+, In3+, and Ag+. Therefore, combining with the results of XRD, it is illuminated that the dopant of Ag has been successfully incorporated into Zn–In–S lattice.
XPS spectra of the as-prepared Ag-doped Zn–In–S core/shell NCs (Sample C): (a) survey; (b) Zn 2p; (c) In 3d; (d) Ag 3d.

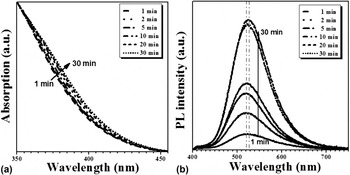
Since the chemical and physical properties of materials are always closely related to their microstructure, the growth process of the Ag-doped Zn–In–S core NCs was carefully monitored at the nucleation temperature of 220 °C for optimizing the optical properties of those NCs. Figure 4 shows the typical UV-vis absorption and PL spectra of the Ag-doped Zn–In–S core NCs (Sample C) under different reaction times. Similar to the reported results, broad absorption bands instead of well-defined exciton absorption peaks are observed [Fig. 4(a)], which is a typical characteristic of ternary and quaternary alloyed NCs. Reference Cao, Li, Wang, Shang, Wei, Zheng and Yang9,Reference Zhang, Lou, Ji, Zhao and Zhong15,Reference Cao, Ji, Zhao, Yang, Li and Zheng26 The absorption spectrum slightly shifts to the longer wavelength with increasing the reaction time, due to the continuous growth of doped NCs. With a similar trend of the absorption spectrum, the PL-emission spectrum also shows a slight redshift but with a significant enhancement of the intensity at the first 20 min [Fig. 4(b)], suggesting fast nucleation and continuous growth process under the reaction conditions. It is noted that when the growth time further increases from 20 to 30 min, the PL intensity is hardly enhanced, thus the 20 min was set as the optimal reaction time in our case.
Typical normalized UV-vis absorption (a) and PL spectra (b, λex = 365 nm) of Ag-doped Zn–In–S core NCs (Sample C) with various reaction times at the nucleation temperature of 220 °C.

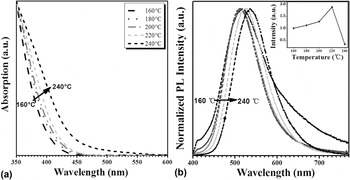
To optimize the optical properties of Ag-doped Zn–In–S NCs, the nucleation temperature was varied from 160 to 240 °C. As shown in Fig. 5, the absorption spectrum apparently shifts to a longer wavelength with increasing the nucleation temperature, due to the accelerated growth of Ag-doped Zn–In–S NCs, resulting from the enhanced reaction mobility of the ligand and precursors. Differing from the absorption spectrum, the normalized emission spectrum shows only a very slight redshift when the temperature is below 200 °C, and then redshifts about 20 nm were shown with further increasing the temperature to 240 °C, while the PL intensity increases firstly and reaches the maximum at the optimal nucleation temperature of 220 °C and then decreases with a further increase in the temperature to 240 °C [as shown in the inset of Fig. 5(b)]. The firstly increase of the PL intensity could be attributed to the adequate nucleation of the Ag-doped Zn–In–S core NCs and with the decreased surface and bulky defects due to the higher temperature. However, at a very high temperature of above 220 °C, it will inevitably accelerate the decomposition of the capping ligand (DDT), thus deteriorating the optical properties of the as-synthesized NCs.
Typical normalized UV-vis absorption (a) and normalized PL spectra (b, λex = 365 nm) of Ag-doped Zn–In–S core NCs (Sample C) with various nucleation temperature. The inset within (b) provides the relationship between the PL intensity and the nucleation temperature.

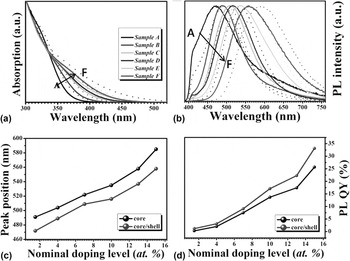
The UV-vis absorption and PL emission spectra of the Ag-doped Zn–In–S core and core/shell NCs with various nominal Ag-doping levels are shown in Figs. 6(a) and 6(b). As shown in Fig. 6(a), with the increase of the Ag dopant, whatever for the Ag-doped Zn–In–S core and/or core/shell NCs, a systematic redshift of absorption onset is observed. A similar trend is also presented in the PL spectra [Fig. 6(b)], indicating that the doping levels greatly influence the optical properties of the resulting Ag-doped Zn–In–S NCs, which may be a result from the fact that the valence band and conduction band will move closely to each other with the increase of the Ag-doping levels. Reference Cao, Zheng, Zhao, Yang, Shang, Li, Yang and Fang24 It should be pointed out that, the hybridization of the surface plasmon effects between the metal and dielectric medium also will affect the absorption onset of the Ag-doped Zn–In–S core and core/shell. Reference Prodan, Radloff, Halas and Nordlander28–Reference Chau, Jheng, Joe, Wang, Yang, Jheng, Sun, Chu and Wei31 After growing a ZnS shell around the Ag-doped Zn–In–S core NCs, an abnormal blueshift in the absorption and PL peak position is observed. It reveals that a small amount of zinc ions diffuse into the Zn–In–S cores and partially replace In ions, which enlarge the band gap of NCs. This observation is well consistent with those of CuInS2/ZnS and AgInS2/ZnS core/shell NCs in the literature. Reference Zhang, Lou, Ji, Zhao and Zhong15,Reference Xuan, Liu, Yu, Xie and Li16 Figures 6(c) and 6(d) depict the evolution of the peak position and PL QY of the Ag-doped Zn–In–S core and core/shell NCs with different Ag-doping levels, respectively. With increased the doping level, the emissions of as-produced NCs exhibit a significant redshift by about 90 nm (i.e., 491–585 nm for core NCs and 472–558 nm for core/shell NCs) and a wider trend of the full width at half maximum (FWHM). Similar to the previous reports, the transition involves recombination of an electron from the NC conduction band with a hole localized at a dopant, thus the broad tunable color emission is attributed to the altered host band gaps controlled by the amount of dopant. Reference Zhang, Tian, Wang and Chen25 While the broad FWHM intrinsically originates from strong electron–phonon coupling in the Ag ion excited state, as well as the inhomogeneous distribution of Ag active in a signal NC in heavy-doped NCs. Reference Knowles, Hartstein, Kilburn, Marchioro, Nelson, Whitham and Gamelin32 More importantly, it is found that the PL QY of these core NCs shows an enhance in trend from 0.3 to 25.7% as the Ag concentration increases from 1 to 15%, which results from the increased concentration of Ag ions incorporated into host NCs, indicating that more holes recombine with electrons from the bottom of the conduction band. Reference Xuan, Liu, Yu, Xie and Li16 After growing a ZnS shell around Ag-doped Zn–In–S core NCs, the PL intensity is further improved [Fig. 6(d)], owing to the evident removal of surface trap states. The highest PL QY (33%) of as-produced NCs was obtained at an Ag-doped concentration of 15%. Further increase of the Ag dopant will lead to some precipitation in our case, which may be due to the formation of Ag2S NCs. Reference Zhang, Tian, Wang and Chen25 It is worth noting that the highest PL QY of our Ag doped Zn–In–S NCs remains inferior as compared to those of the previously developed Cu-doped NCs. One plausible reason for the poor performance of Ag-doped NCs is likely that the Ag dopant is active and vulnerable to the interference of oxygen. To further enhance the performance of Ag-doped NCs, much complex surface modifications, such as coating thick gradient alloy shell, are needed to be performed. Reference van Embden, Chesman and Jasieniak33
Typical normalized UV-vis absorption (a) and normalized PL spectra (b, λex = 365 nm) of Ag-doped Zn–In–S core (dot lines) and core/shell (solid lines) NCs with various nominal Ag-doping levels. The evolutions of PL peak positions (c) and QYs (d) of Ag-doped Zn–In–S core and core/shell NCs with different nominal Ag-doping levels.

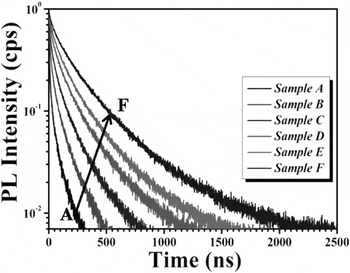
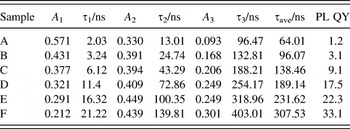
To explore the dynamical features of such dopant concentration-dependent PL properties, time-resolved PL spectra of Ag-doped Zn–In–S core/shell NCs with various nominal Ag-doping levels were performed, and the results are shown in Fig. 7. The lifetime data were fitted by the triple exponential function and the time constants. The normalized amplitudes of the components and the average lifetimes of the Ag doped Zn–In–S NCs are summarized in Table II. The fast components, τ1 and τ2, may be attributed to certain processes like fluorescent deactivation of the Zn–In–S host, e.g., nonradiative recombination due to the inner and/or surface defects, while the slow component, τ3, should be related to the emission via dopant energy levels. Reference Zeng, Sun, Cao, Shen, Liu, Long, Zheng, Shen and Lin19,Reference Sotelo-Gonzalez, Roces, Garcia-Granda, Fernandez-Arguelles, Costa-Fernandez and Sanz-Medel34 Generally, the emission of such doped NCs is attributed to the transition from the conduction band of the host to the level of the excited Ag d-state, thus resulting in much longer lifetime than that of band–edge transition. Reference Xuan, Liu, Yu, Xie and Li16 As shown in Table II, the PL lifetime of these doped NCs increases with increasing the doping level. Specially, besides the increased time constants of the lifetime similar to previously reported, Reference Xuan, Liu, Yu, Xie and Li16 and it is found that the proportion of fast components decrease while the slow ones increase obviously; this suggests that the slow component, which is related to the emission via dopant energy levels, becomes a powerful competitive advantage for the NCs with higher Ag-doping levels. The result is consistent with the change in trend of PL QY and can be attributed to the fact that the increased concentration of Ag ions provides more holes to recombine with electrons from the bottom of the conduction band.
PL decay curves of Ag-doped Zn–In–S core/shell NCs with various nominal Ag-doping levels.

Fitting parameters of PL decay curves of Ag-doped Zn–In–S core/shell NCs with various nominal Ag-doping levels.

IV. CONCLUSIONS
In conclusion, we have demonstrated the growth of cadmium-free Ag doped Zn–In–S NCs with effective PL via a hot-injection strategy. The key experimental parameters, such as reaction times, nucleation temperatures, as well as the Ag dopant concentrations, have a profound effect on the PL properties of NCs. The as-synthesized Ag doped Zn–In–S NCs exhibit color-tunable PL emissions, which cover a broad region of the visible range (approximately 472–585 nm) with a PL QY up to 33%. The steady-state and time-resolved PL spectroscopy reveal that the PL QY and PL lifetime of Ag-doped Zn–In–S NCs increase with the doping level, because the improved concentration of Ag ions provides more holes to recombine with electrons from the bottom of the conduction band. The results suggest tailoring that the Ag-doping level can be a powerful tool to control the PL of Ag doped Zn–In–S NCs.
ACKNOWLEDGMENTS
This work was financially supported by National Natural Science Foundation of China (NSFC, Grant No. 61106066), Zhejiang Provincial Science Foundation (Grant No. LY14F040001), and Ningbo Municipal Natural Science Foundation (Grant No. 2016A610104).