Implications
As reproductive performance has a substantial impact on the economic profitability of dairy farms, many studies have focused on the relationship between milk urea concentration and reproduction with the objective of obtaining a monitoring or diagnostic tool for reproductive performance. Clearly, the association between milk urea nitrogen and reproductive performance requires more clarification.
Introduction
Urea is an end product of nitrogen conversion and there are two origins of it in ruminants. First, the unused ammonia formed in the rumen is converted into urea in the liver; second, the urea is created during amino acid catabolism in the body (Nousiainen et al., Reference Nousiainen, Shingfield and Huhtanen2004). A small molecule of urea is able to diffuse through cell membranes including the mammary gland. Milk urea concentration (MU) is strongly correlated with blood plasma urea concentration (PU; 0.88 to 0.98; Butler et al., Reference Butler, Calaman and Beam1996; Broderick and Clayton, Reference Broderick and Clayton1997), moreover the measurement of MU is convenient and non-invasive and may be useful as a management tool to improve the efficiency of production (Godden et al., Reference Godden, Lissemore, Kelton, Leslie, Walton and Lumsden2001).
As reproductive performance has a substantial impact on the economic profitability of dairy farms, many studies have focused on the relationship between MU concentration and reproduction with the objective of obtaining a monitoring or diagnostic tool for reproductive performance. Several studies have reported the negative effect of blood urea or MU on reproductive performance in dairy cows (Butler et al., Reference Butler, Calaman and Beam1996; Rajala-Schultz et al., Reference Rajala-Schultz, Saville, Frazer and Wittum2001). Rhoads et al. (Reference Rhoads, Rhoads, Gilbert, Toole and Butler2006) tested the pregnancy rate after embryo transfer from donors with medium or high PU concentration to the heifers with medium or high PU concentration. Their results indicated that a high PU concentration in lactating dairy cows decreases embryo viability through affecting the oocyte or embryo before recovery from the uterus 7 days after insemination.
Some studies have reported a negative effect of high milk urea nitrogen (MUN) on fertility in dairy cattle in general (Butler et al., Reference Butler, Calaman and Beam1996), although others have reported reduced conception risks only when MUN was either very low (<7 mg/dl) or very high (>17.6 mg/dl; Carlsson and Pehrson, Reference Carlsson and Pehrson1993). Other studies, in spite of finding a positive relationship between dietary crude protein (CP) and PU–nitrogen concentrations or MUN (Godden et al., Reference Godden, Lissemore, Kelton, Leslie, Walton and Lumsden2001), did not find an association between urea–nitrogen concentrations and reproduction. The amount of MUN at which substantial impairment of reproductive performance occurs remains unclear, particularly among herds under commercial conditions (Godden et al., Reference Godden, Lissemore, Kelton, Leslie, Walton and Lumsden2001; Rajala-Schultz et al., Reference Rajala-Schultz, Saville, Frazer and Wittum2001). In addition, it remains unclear whether the MUN immediately before or after a breeding are important considerations in interpreting the relationship between MUN and reproductive performance (Godden et al., Reference Godden, Lissemore, Kelton, Leslie, Walton and Lumsden2001), with the exact mechanism of action yet to be determined. Some studies speculate that other factors might be involved in the association between MUN and reproduction performance, such as health problems or heat stress (Melendez et al., Reference Melendez, Donovan and Hernandez2000).
Clearly, the association between MUN and reproductive performance requires clarification and there are also no published reports of association between MUN and reproductive performance in Iranian Holstein dairy cows. Therefore, the aim of this study was to evaluate the relationship between MUN and some of the reproductive parameters in the Holstein dairy cows.
Material and methods
Data set
MUN data obtained from 57 301 dairy cows on 20 large dairy herds in Iran between January 2005 and June 2009. The herds used in this study belong to herds with purebred Holsteins, which are under official performance and pedigree recording. Artificial insemination is used in herds for almost all cows and 60% to 80% of semen is usually of US- and Canadian-proven sires (Ghavi Hossein-Zadeh et al., Reference Ghavi Hossein-Zadeh, Nejati-Javaremi, Miraei-Ashtiani and Kohram2008). Each cow used in the analyses had records of the four reproductive traits (days from calving to first service (DCFS), days from first service to conception (DFSC), days open (DO), first-service conception rate (FSCR)) and was required to have a MUN value and a verified reproductive status for a lactation. Edits were made to exclude records with days to first service <25 or >200 and DO <25 or >365. The pedigree information used in this study was extracted from the database used for the national genetic evaluation of dairy traits in Iran, which had been provided by the Animal Breeding Center of Iran and reported by Ghavi Hossein-Zadeh et al. (Reference Ghavi Hossein-Zadeh, Nejati-Javaremi, Miraei-Ashtiani and Kohram2009) at previous study. Records from DIM (days in milk) <5 and >305 days were eliminated. Records were also eliminated if no registration number was present for a given cow, because for these animals no pedigree information would be available for the genetic analysis. Ages at calving were required to be between 18 and 40, 28 and 49 and 40 and 68 months in lactations one, two and three, respectively. Months of birth were grouped into four seasons: January through March (winter), April through June (spring), July through September (summer) and October through December (fall). Only records from the first three parities that had data for MUN and selected reproductive traits were kept. The final edited data set contained 458 408 test-day records. MUN concentrations were measured by infrared method on test-day samples routinely collected by the Animal Breeding Center of Iran. Infrared measures of MUN are indirect measures of MUN. Infrared MUN values are calculated from prediction equations that use spectrum analyses.
Analysis
Variance components and genetic parameters for MUN and reproductive traits were estimated with a five-trait model using ASREML program (Gilmour et al., Reference Gilmour, Gogel, Cullis, Welham and Thompson2002). Random regression models (RRM) were chosen for the genetic analysis of test-day data because RRM are able to model differences in genetic effects across time and, therefore, estimate unique lactation curves for every animal (Jamrozik and Schaeffer, Reference Jamrozik and Schaeffer1997). Random regression test-day models were used to estimate heritability separately for MUN from first lactation, for MUN from second lactation and for MUN from third lactation. The RRM for the genetic analysis of MUN can be written as:
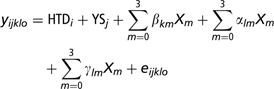
where yijklo = observations of MUN; HTDi = the ith herd-test-day for the observations of the MUN; YSj = the jth year-season of calving; βkm = the kth fixed regression coefficients; αm = the random regression coefficients for the additive genetic effects of the lth animal; γlm = the random regression coefficients for the permanent environment of the lth animal; Xm = Legendre polynomial of 3th-degree corresponding to days in milk and age at calving of each cow; eijklo = random residual effect. In addition, animal models were used to estimate variance components and heritability separately for reproductive traits from lactations one through three. The final model fitted for the genetic analysis of the reproductive traits can be written as:
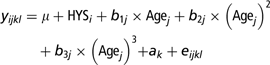
where yijkl = single observations of the reproductive traits; μ = general mean; HYSi = the herd-year-season for the single observations of the reproductive traits; ak = the random animal effect; b 1j, b 2j and b 3j = regression coefficients on the three orders for age at calving (Agej); eijkl = random residual effect. Random animal effects were assumed correlated based on their genetic relationships calculated from all known pedigrees.
Linear animal models were used in this study for the genetic analysis of FSCR although this trait was a binary trait. Theoretically, threshold models were shown to be more appropriate than linear models for analysis of categorical data (Gianola, Reference Gianola1982). Advantages of threshold over linear models have been shown with simulated data (Meijering and Gianola, Reference Meijering and Gianola1985). Heritabilities obtained using threshold models were usually higher than those obtained with linear models (Weigel and Rekaya, Reference Weigel and Rekaya2000). Smaller differences were reported for estimated breeding values from threshold and linear models. Correlations between corresponding threshold and linear model random effect solutions were high (Ramirez-Valverde et al., Reference Ramirez-Valverde, Misztal and Bertrand2001) indicating little change in ranking of animals between these models. Routine genetic evaluation of categorical fertility and calving traits is mostly based on linear models. Applications of threshold methodology have been restricted to sire and sire-maternal grandsire models. Application of threshold animal models to categorical traits was often problematic because of the ‘extreme category problems’ where all observations for some subclasses are in the same category (Misztal et al., Reference Misztal, Gianola and Foulley1989). Luo et al. (Reference Luo, Boettcher, Schaeffer and Dekkers2001) showed also that threshold animal models had problems with convergence, and yielded biased estimates when convergence was reached. The threshold model gave biased variances for herd-year and additive genetic effects. Treating effects as random was recommended to lessen the extreme category problems in threshold models (Tempelman, Reference Tempelman1998). Threshold models are more demanding computationally than linear models (Misztal et al., Reference Misztal, Gianola and Foulley1989). Ramirez-Valverde et al. (Reference Ramirez-Valverde, Misztal and Bertrand2001) showed that switching to multiple-trait from single-trait models increased accuracy more than switching from threshold to linear models. Taking into account all above arguments, no attempt was made at this time to apply threshold model for categorical trait.
A three-trait animal model was used to estimate genetic and phenotypic correlations among first-, second- and third-lactation MUN values. This three-trait model had the same effects as in the above-mentioned model, but considered MUN in separate lactations as three different traits. In addition, five-trait animal models were used to estimate genetic and phenotypic correlations among MUN and reproductive traits. The models applied in the multivariate analyses were the same as those fitted for each of the traits in the single-trait model. For better clarification of the genetic relationships between MUN and fertility traits, four intervals within each lactation were defined as 5 to 45 DIM (period 1), 46 to 115 DIM (period 2), 116 to 205 DIM (period 3) and 206 to 305 DIM (period 4).
Results and discussion
Descriptive statistics
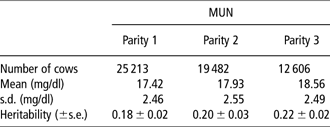
Summary statistics for MUN and reproductive performance traits over the three lactations are in Tables 1 and 2, respectively. Average DCFS was 76.2 in first lactation, 79.6 in second lactation and 83.4 in third lactation (Table 2). DO averaged 137.5 in first lactation, 141.3 in second lactation and 144.9 in third lactation. Average DFSC was 49.3 in first lactation, 55.7 in second lactation and 61.1 in third lactation. FSCR averaged 28.4% in services following first calving, 23.9% in services following second calving and 19.8% in services following third calving. The average of DO in this study was consistent with the result of the previous study (Ghavi Hossein-Zadeh, Reference Ghavi Hossein-Zadeh2010) which reported the average of DO as 137.08 in Iranian Holsteins. DCFS is highly affected by the length of the voluntary waiting period, which differs among herds and among management groups within a herd. Nevertheless, selection for this trait would favor cows that demonstrate visible estrus early in lactation. Mitchell et al. (Reference Mitchell, Rogers, Dechow, Vallimont, Cooper, Sander-Nielsen and Clay2005) reported average DCFS was 85.8 in first lactation and 85.9 in second lactation. DO averaged 140.3 in first lactation and 144.3 in second lactation and FSCR averaged 27.3% in services following first calving and 23.4% in services following second calving in their study (Mitchell et al., Reference Mitchell, Rogers, Dechow, Vallimont, Cooper, Sander-Nielsen and Clay2005). Their results were consistent with the results of this study. Average MUN concentrations were 17.42, 17.93 and 18.56 mg/dl for parities 1, 2 and 3, respectively. Consistent with our result, Stoop et al. (Reference Stoop, Bovenhuis and Van Arendonk2007) reported the MUN concentration of 20.39 mg/100 g for primiparous Holstein cows. Butler et al. (Reference Butler, Calaman and Beam1996) reported a MUN of 22.8 mg/dl for non-pregnant cows, 21.3 mg/dl for cows later identified pregnant and overall mean values of 22.3 mg/dl. Other studies reported lower means of around 12 to 13 mg/dl (Wood et al., Reference Wood, Boettcher, Jamrozik, Jansen and Kelton2003; Mitchell et al., Reference Mitchell, Rogers, Dechow, Vallimont, Cooper, Sander-Nielsen and Clay2005), although the range was similar to our results (1 to 50 mg/dl). MU concentration is influenced mainly by dietary factors, such as CP, RDP (rumen degradable protein), RUP (rumen undegradable protein), energy : protein ratio and NFC (non-fiber carbohydrates; Broderick and Clayton, Reference Broderick and Clayton1997; Godden et al., Reference Godden, Lissemore, Kelton, Leslie, Walton and Lumsden2001). The international use of AI bulls makes it unlikely that the large difference in mean is due to different genetic level of Holstein populations. More likely, the difference is due to feed because the protein content of Iranian dairy rations is generally high. In all lactations, the concentrations of MUN were slightly elevated at the start of lactation, reaching minimal level in early lactation, and then rising steadily to maximum values at the end of the lactation. Wood et al. (Reference Wood, Boettcher, Jamrozik, Jansen and Kelton2003) reported similar trends in MUN with stage of lactation. Jonker et al. (Reference Jonker, Kohn and Erdman1998) found a decrease of MUN with advancing DIM from around the second month onward, leading to a curve for MUN similar to that for milk yield. Jorritsma et al. (Reference Jorritsma, Wensing, Kruip, Vos and Noordhuizen2003) hypothesized that MUN might be increased under a negative energy balance, suggesting a peak in MUN during early lactation like Jonker et al. (Reference Jonker, Kohn and Erdman1998). Broderick and Clayton (Reference Broderick and Clayton1997) also found a positive relationship between MUN and DIM, but the data analyzed by Spicer et al. (Reference Spicer, Francisco, Jones and Waldner2000) indicated that MUN increased during the first 3 weeks of lactation, then remained steady for the remainder of the lactation. The increase in MUN after the peak of lactation may be due to physiological changes and the decreasing metabolic demands of lactation.
Descriptive statistics and estimates of heritabilities for MUN in the first three lactations of Holstein dairy cows
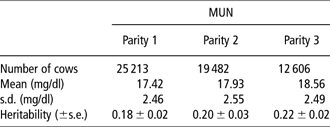
MUN = milk urea nitrogen.
Descriptive statistics for reproductive performance traits in the first three lactations of Holstein dairy cows

DO = days open; DCFS = days from calving to first service; DFSC = days from first service to conception; FSCR = first service conception rate.
Heritability estimates
Heritability estimates for MUN and reproductive performance traits are in Tables 1 and 3, respectively. Heritability estimates for MUN in the first lactation, second lactation and third lactation were 0.18, 0.20 and 0.22, respectively, which were greater than the corresponding values for reproductive traits. The heritability estimate was low for reproductive traits, which ranged from 0.02 to 0.06 for different traits and across parities. Consistent with our results, for test-day MUN, Mitchell et al. (Reference Mitchell, Rogers, Dechow, Vallimont, Cooper, Sander-Nielsen and Clay2005) estimated heritability for first parity cows of 0.22 when using infrared spectroscopy, and 0.14 when using wet chemistry techniques to determine MUN. In addition, Stoop et al. (Reference Stoop, Bovenhuis and Van Arendonk2007) reported the MUN heritability of 0.14 for primiparous Holstein cows, which was roughly similar to the estimates found in our study. Wood et al. (Reference Wood, Boettcher, Jamrozik, Jansen and Kelton2003) estimated a higher heritability for infrared-determined MUN of 0.44, using random regression analysis of at least four test-day samples per cow with heterogeneous variance structures based on DIM. Miglior et al. (Reference Miglior, Sewalem, Jamrozik, Bohmanova, Lefebvre and Moore2007) reported average daily heritabilities were moderately high for MUN (from 0.38 to 0.41) in the Canadian Holstein dairy cows. Their estimates were greater than ours. König et al. (Reference König, Chang, v.Borstel, Gianola and Simianer2008) reported lower estimate of heritability for MUN (0.13) in Holstein dairy cows. Heritabilities for the reproductive traits in our study are similar to heritabilities found in other studies (Andersen-Ranberg et al., Reference Andersen-Ranberg, Klemetsdal, Heringstad and Steine2005). Consistent with the results of this study, Mitchell et al. (Reference Mitchell, Rogers, Dechow, Vallimont, Cooper, Sander-Nielsen and Clay2005) reported heritability of DCFS was 0.04 in first lactation and 0.03 in second lactation. In addition, they reported that the heritability of DO was 0.05 for both parities and estimates of heritability for FSCR was 0.01 in first lactation and 0.0 in second lactation. Consistent with our results, Jamrozik et al. (Reference Jamrozik, Fatehi, Kistemaker and Schaeffer2005) reported heritabilities of most reproductive traits were generally below 0.10.
Genetic and phenotypic correlations
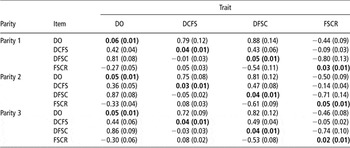
Table 3 shows genetic and phenotypic correlations among reproductive performance traits and Table 4 shows genetic and phenotypic correlations among MUN and reproductive performance traits. In addition, the phenotypic and genetic correlations between MUN at different parities are shown in Table 5. With the exception of DO, phenotypic and genetic correlations between MUN and reproductive performance traits were low and generally not different from zero. Genetic correlations between MUN and DO were 0.23 in first lactation, 0.35 in second lactation and were 0.45 in third lactation. Higher MUN concentrations may be genetically associated with increased DO. All phenotypic relationships between MUN and all measures of reproductive performance were close to zero. It is shown that the greatest genetic correlations between MUN and reproductive traits were obtained in period 1 and these values experienced a decreasing trend from period 1 onwards. In the first, second and third parities, genetic correlations between MUN and DO at the same DIM tended to be between −0.11 and 0.68; between MUN and DCFS at the same DIM, they tended to be between −0.32 and 0.34; between MUN and DFSC at the same DIM, they tended to be between −0.24 and 0.30; and finally, between MUN and FSCR at the same DIM, they tended to be between −0.19 and 0.31 during full lactation. However, the phenotypic correlation between MUN at different parities were moderate (0.28 to 0.35), but the genetic correlation between MUN across different parities were high and ranged from 0.84 to 0.97. Absolute genetic correlations between many reproductive traits were high, as would be expected from the biological relationships between these traits. The highest absolute genetic correlation was between DO and DFSC, but the lowest absolute genetic correlation was between DCFS and FSCR. The range of genetic correlations between reproductive traits was −0.80 to 0.88 for first parity cows, −0.71 to 0.81 for second parity cows and −0.74 to 0.82 for third parity cows. The highest phenotypic correlations were between DO and DFSC (0.81 to 0.87). All genetic relationships between FSCR and other reproductive traits were negative. In contrast, the phenotypic correlations between FSCR and other reproductive traits were close to zero or negative. In addition, the phenotypic correlations between DFSC and DCFS were close to zero. The other phenotypic correlations among reproductive traits ranged from medium to high (Table 3). Inconsistent results concerning the relationship between MUN concentration and reproduction can be found in the literature. Hypotheses suggest that a high urea concentration impairs reproduction through an indirect effect on the energy status (Broderic and Clayton, 1997). Hojman et al. (Reference Hojman, Kroll, Adin, Gips, Hanochi and Ezra2004) reported increase in the levels of MU was negatively related to reproductive performance of dairy cows. An excessive intake of degradable protein and a relative shortage of energy to synthesize bacterial proteins will result in the accumulation of excessive ammonia in the rumen, which is absorbed through the ruminal wall and converted into urea in the liver. This detoxification process consumes energy and thus may exacerbate negative energy balance (NEB) early post partum (Leroy et al., Reference Leroy, Opsomer, Van Soom, Goovaerts and Bols2008). The effect of NEB on the reproductive performance is reviewed in Leroy et al. (Reference Leroy, Opsomer, Van Soom, Goovaerts and Bols2008). NEB is associated with a high incidence of irregular cycles that can both increase the interval to first service and reduce conception rates. Important was a hypothesis introduced by Oltner and Wiktorsson (Reference Oltner and Wiktorsson1983), who reported that urea concentrations were not the results of absolute levels of either dietary protein or energy, but of the protein : energy (P : E) ratio. Three different P : E circumstances could occur: when the absolute levels of protein and energy fed are both underfed at low levels; when both are fed at recommended moderate levels or when both are overfed at high levels. While each of these circumstances could result in similar and moderate urea concentrations, we would not necessarily expect cows to reach the same fertility among these three circumstances. Řehák et al. (Reference Řehák, Rajmon, Kubešová, Štípková, Volek and Jílek2009) reported a significant relationship (P < 0.05) between MUN and calving to first service interval and the probability of conception at first service was almost consistent in the cows with medium and low MUN and the probability of conception in the cows with high MUN tended to be the lowest. Two reports (Vallimont et al., Reference Vallimont, Rogers, Holden, O’Connor, Cooper, Dechow and Clay2003; Guo et al., Reference Guo, Russek, Cohen, Varner and Kohn2004) indicated some relationship between MUN and reproductive traits on a within-herd basis. Guo et al. (Reference Guo, Russek, Cohen, Varner and Kohn2004) reported that cows with higher MUN had reduced conception rates. Vallimont et al. (Reference Vallimont, Rogers, Holden, O’Connor, Cooper, Dechow and Clay2003) found that cows with a very high and very low MUN within the 2-week period before insemination had reduced conception rates. The genetic and phenotypic correlations estimated in this study would not, of course, be able to detect the non-linear phenotypic relationship between MUN and conception rate as described by Vallimont et al. (Reference Vallimont, Rogers, Holden, O’Connor, Cooper, Dechow and Clay2003). In addition, the genetic correlations between MUN and DCFS in this study (−0.12 to 0.19) were lower than the report of König et al. (Reference König, Chang, v.Borstel, Gianola and Simianer2008). Average genetic correlations among parities for MUN were quite high. These high genetic correlations indicated that MUN at different parities were considered as genetically similar traits. The genetic correlation between MUN in the second and third parities was greater than the genetic correlations between MUN in the first and third parities, and between MUN in the first and second parities. Consistent with this result, Miglior et al. (Reference Miglior, Sewalem, Jamrozik, Bohmanova, Lefebvre and Moore2007) reported the genetic correlations between MUN at different parities were high in the Canadian Holstein dairy cows. Except for FSCR, genetic correlations among many fertility traits were high, as would be expected from the close link between various fertility measurements and that most of the traits could be expressed as a function of another trait. High and favorable genetic correlations among many fertility traits indicated that animals ranked for one trait would rank similarly in the other correlated traits. This means that genetic improvement of one fertility trait could be expected to cause similar parallel improvement in the highly correlated trait. Genetic parameters for female reproductive traits have been a subject of numerous publications in recent years (e.g. Weigel and Rekaya, Reference Weigel and Rekaya2000; Ranberg et al., Reference Ranberg, Heringstad, Klemetsdal, Svendsen and Steine2003). Genetic correlations among various fertility traits generally agreed with previous findings (Kadarmideen et al., Reference Kadarmideen, Thompson, Coffey and Kossaibati2003; Liu et al., Reference Liu, Jaitner, Reinhardt, Pasman, Rensing and Reents2008). Consistent with our results, Kadarmideen et al. (Reference Kadarmideen, Thompson, Coffey and Kossaibati2003) reported genetic correlations among fertility traits were generally high. Our estimates for the genetic correlations of DO with DCFS and between DCFS and DFSC were similar to the report of González-Recio and Alenda (Reference González-Recio and Alenda2005).
Estimates of heritabilities (in bold on diagonal), genetic correlations (above the diagonal) and phenotypic correlations (below the diagonal) for reproductive traits in the first three lactations of Holstein dairy cows (s.e. are within the parantheses)

DO = days open; DCFS = days from calving to first service; DFSC = days from first service to conception; FSCR = first service conception rate.
Phenotypic and genetic correlations among MUN and reproductive traits (s.e. are within the parantheses) in Iranian Holsteins

DO = days open; DCFS = days from calving to first service; DFSC = days from first service to conception; FSCR = first service conception rate.
Genetic and phenotypic correlation estimates (s.e. are within the parantheses) between MUN measured in the first, second and third lactations

MUN = milk urea nitrogen.
Conclusions
The estimated heritability of MUN ranged from 0.18 to 0.22 and was greater than the estimates of heritability for reproductive traits. The heritability of MUN was low, but within the range reported by other studies. With the exception of DO, genetic and phenotypic correlations between MUN and several measures of reproductive performance were close to zero. Higher MUN concentrations may be genetically associated with increased DO. Our results indicate a limited application of MUN for use in selection programs to improve reproductive performance. The results of this study showed that MUN is correlated with fertility traits at the beginning of lactation and if there is a possibility to genetically change MUN, it is better to focus on the earlier parts of lactation in Holstein dairy cows.
Acknowledgment
The authors wish to thank two anonymous reviewers for their constructive comments about the earlier versions of this manuscript.