Implications
Grazing lucerne with barley supplementation (LUC) has proven to be an interesting alternative to concentrate feeding (Feedlot) in young bulls, because of their acceptable weight gains at lower economic cost. Finishing young bulls on concentrates after grazing on lucerne (LUC + Feedlot) improved overall weight gains, but costs were also greater than those of bulls slaughtered directly from grazing. Serum IGF-I, leptin and carotenoid pigment concentrations were affected by the fattening management, reflecting the different nutritional status among them, but they were not able to predict the performance in the long term. Finally, the use of subcutaneous fat colour traits offers the possibility to trace forage feeding in young bulls and could accomplish the consumer demand for information regarding the production system.
Introduction
In Mediterranean areas, young bulls are usually fed concentrates and straw from weaning until slaughter. However, the interest of both beef producers and consumers in extensive systems has increased in the last few years for several reasons. First, the European Agricultural Policy increasingly favours extensive production, which may also be enhanced because of the uncertainties associated with the fluctuation in grain prices in recent years. Second, consumers consider pasture-based production systems to be more environmentally friendly and provide better animal and human welfare because of the better nutritional quality of the meat; hence, they are socially more acceptable than intensive concentrate-based systems (Steen et al., Reference Steen, Lavery, Kilpatrick and Porter2003).
An alternative to intensive fattening in Mediterranean conditions could be provided by lucerne pastures. Lucerne is a widespread traditional crop that accounts for 67% of the forage land area in the irrigated areas of Spain (Ministerio de Medio Ambiente, Medio rural y Marino (MARM), 2009). However, grazing may result in lower weight gains and subcutaneous fat cover than conventional grain feeding (Steen et al., Reference Steen, Lavery, Kilpatrick and Porter2003), issues that can be overcome by grain supplementation during grazing (Drouillard and Kuhl, Reference Drouillard and Kuhl1999) and by subsequent concentrate finishing (Muir et al., Reference Muir, Deaker and Bown1998a).
The study of animal nutritional status under different production systems can provide information on the physiological pathways of the effect of management on performance. Changes in this status can alter concentrations of blood metabolites like non-esterified fatty acids (NEFA), which reflect fat mobilization, and hormones such as IGF-I and leptin (Lee et al., Reference Lee, Hong, Kim, Kang, Xu, Cho, Seo, Rho and Choi2006). Serum IGF-I concentration is related to nutritional status and protein deposition (Ellenberger et al., Reference Ellenberger, Johnson, Carstens, Hossner, Holland, Nett and Nockels1989; Hornick et al., Reference Hornick, Van Eenaeme, Gérard, Dufrasne and Istasse2000), while leptin concentration is related to adiposity and feed intake (Chilliard et al., Reference Chilliard, Bocquier, Delavaud, Faulconnier, Bonnet, Guerre Millo, Martin and Ferlay1999), and therefore they might be useful to predict performance at key moments of the production cycle.
Reliable information regarding the system of production, the traceability and the quality control of the meat is essential for European beef consumers (Bernués et al., Reference Bernués, Olaizola and Corcoran2003). The authentication of forage feeding in meat from ruminants can be achieved by measuring carotenoid pigments in plasma and fat deposits. Serrano et al. (Reference Serrano, Prache, Chauveau-Duriot, Agabriel and Micol2006) used the reflectance spectrum of fat in the zone of light absorption by carotenoid pigments to discriminate carcasses of growing cattle with different proportions of grass and concentrates in their diets. They concluded that it could be useful to trace grass feeding in young bulls, although its reliability depended on the fatty tissue, animal age and production system.
Therefore, the overall objective of this study was to propose and evaluate new fattening systems for young bulls, based on different supplies of concentrate and lucerne. The partial aims were, first, to determine the effects of intensive concentrate feeding during the fattening period v. lucerne grazing and lucerne grazing + concentrate finishing on the technical and economic performance of young bulls and on their nutritional status. The second objective was to analyse the feasibility of using subcutaneous fat colour traits to discriminate among carcasses from different feeding treatments, for diet authentication purposes.
Material and methods
All procedures were conducted according to the guidelines of the Council Directive 86/609/EEC (European Communities, 1986) on the protection of animals used for experimental and other scientific purposes.
Animals and handling
Twenty-one Parda de Montaña male calves were born (19 October ±15 days) in La Garcipollera Research Station (Spain, 42° 37′ N, 0° 30′ W; 945 m a.s.l.). Parda de Montaña breed is one of the most common cattle breeds in the Spanish Pyrenees that derives from the former Brown Swiss and was selected for meat production. During lactation, calves did not receive other feedstuffs but their dams’ milk and straw. After weaning at 150 days, they were transported to CITA research centre (41° 43′ N, 0° 48′ W; 225 m a.s.l.) in the Ebro Valley (Spain).
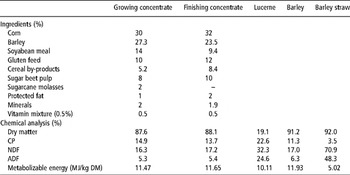
On the day after arrival, young bulls were weighed, blocked by body weight (BW) and randomly assigned to one of three fattening management systems conducted over two periods, period 1 (first 3 months) and period 2 (from the end of period 1 until animals reached the target slaughter weight of 450 kg), with a 10-day pre-experimental adaptation period. A group of animals was allocated in a straw-bedded pen to follow a commercial feeding programme, with concentrates and straw on an ad libitum basis until slaughter (Feedlot). During the pre-experimental adaptation period, these Feedlot young bulls received increasing amounts of the growing concentrate plus straw. Thereafter, concentrates, barley straw and water were offered ad libitum in each pen. During the experimental period, the composition of the concentrates was adapted to meet their energy and protein requirements: from arrival until 350 kg BW, animals were fed a growing concentrate, and from 350 to 450 kg they received a finishing concentrate (Table 1).
Feedstuff composition

A second group of animals (LUC) received lucerne hay on an ad libitum basis plus 1.8 kg dry matter (DM) barley/day during the 10-day pre-experimental adaptation period, and thereafter grazed rotationally on lucerne pastures with a daily supplementation of 1.8 kg DM barley/head until slaughter at 450 kg. Two 0.9-ha plots were seeded the spring previous to the experiment with 25 kg/ha of lucerne seed (Medicago sativa L. var. Aragón). They were fertilized yearly with 400 kg/ha of 15 : 15 : 15 (Nitrogen:Phosphorus:Potassium) and irrigated fortnightly. Each plot was divided into three paddocks for rotational grazing and had a shed to provide shade during the summer. Animals were changed to a new paddock fortnightly to ensure that the lucerne stubble height was above 10 cm. At 0800 h, 1.8 kg DM barley/head was delivered. Water, barley straw and minerals were offered on an ad libitum basis in both plots.
The third group of young bulls (LUC + Feedlot) had the same management as LUC animals during the pre-experimental period and for the first 3 months of the experiment (period 1), and thereafter they were fed the same concentrates as Feedlot animals on an ad libitum basis until they reached slaughter weight (period 2). During the 1st week of period 2, LUC + Feedlot animals received increasing amounts of concentrates plus straw and lucerne hay, for a gradual adaptation to the feedlot diet.
When animals reached 450 kg BW, they were transported to a commercial abattoir (MercaZaragoza, Zaragoza, Spain) 6 km from the Research Centre. They were slaughtered immediately on arrival to minimize pre-slaughter stress, stunned by a captive bolt pistol and dressed according to standard commercial practices. Hot carcass weight, conformation and degree of fat cover have been reported in Blanco et al. (Reference Blanco, Casasús, Ripoll, Panea, Albertí and Joy2010a).
Measurements
All measurements and blood samples were obtained after the pre-experimental adaptation period. Individual BW was obtained weekly for all the young bulls at 0800 h without deprivation of feed and water. These measurements were used to calculate overall average daily gain (ADG) by linear regression of BW on date and ADG for Periods 1 and 2.
Concentrate intake was recorded daily on a group basis. Lucerne mass in each paddock was measured before (pre-grazing) and after grazing (post-grazing) by clipping with an electrical mower all plant material 5 cm above ground level in 20 0.25 m2 quadrats randomly located in the paddock. Lucerne pre-grazing mass was on average 2818 kg DM/ha (ranging from 1420 to 4213 kg DM/ha during the grazing season) with 22.3% CP content (from 18.5% to 27.6%). Post-grazing mass was on average 1296 kg DM/ha (ranging from 350 to 2475 kg DM/ha) with 15.0% CP content (from 9.1% to 20.2%).
Feedstuffs were oven-dried to determine DM content, and CP content was determined following the Dumas Procedure (Association of Official Analytical Chemists (AOAC), 1999) using a Nitrogen and Protein analyzer (Model NA 2100, CE Instruments, Thermoquest S.A., Barcelona, Spain). Neutral-detergent fibre (NDF) and acid-detergent fibre (ADF) analyses were carried out following the sequential procedure of van Soest et al. (Reference Van Soest, Robertson and Lewis1991), with the Ankom fibre analyzer (Model 200/220, Ankom Technology, Gomensoro, Madrid, Spain). Lucerne intake was estimated as the difference between pre- and post-grazing mass and lucerne growth between measurements, according to the estimated daily growth rate proposed by Delgado et al. (Reference Delgado, Muñoz and Joy2004). Metabolizable energy (ME) of the feedstuffs was calculated with the equations proposed by Mertens (Reference Mertens1983). Gain to feed (G : F) ratios for each period were estimated from concentrate, lucerne, straw and barley intake as gram gain/MJ ME intake.
Blood sampling and analyses
Animals were bled monthly at 0800 h by puncture of the coccygeal vein. Samples for IGF-I and leptin concentrations were collected into test tubes without anti-coagulant to obtain serum. They were allowed to clot for 24 h at room temperature and stored in aliquots before the serum was frozen at −20°C. Circulating IGF-I concentrations were quantified using a commercial EIA kit (OCTEIA® IGF-I, IDS, Boldon, UK), and the intra- and inter-assay coefficients of variation were 3.4% and 6.2%, respectively. Leptin concentrations were determined using a competitive EIA for leptin in domestic animals (Sauerwein et al., Reference Sauerwein, Heintges, Hennies, Selhorst and Daxenberger2004) with 6.6% and 11.5% intra- and inter-assay coefficients of variation, respectively.
Samples for NEFA and carotenoid pigments were collected into test tubes containing potassium-ethylenediaminetetraacetic acid to obtain plasma. Blood samples for carotenoid pigment quantification were immediately wrapped with aluminium foil to protect them from natural light. Afterwards, blood samples were centrifuged at 2122×g for 5 min, and plasma was extracted and frozen at −20°C for subsequent assay. A commercial enzymatic colorimetric kit (Randox Laboratories Ltd, Crumlin, Co. Antrim, UK) was used to quantify NEFA concentrations, with 5.1% and 7.4% intra- and inter-assay coefficients of variation, respectively. Plasma carotenoid pigment determination was performed following the procedures of Prache et al. (Reference Prache, Priolo and Grolier2003a).
Subcutaneous fat colour and carotenoid content
Twenty-four hours after slaughter, subcutaneous fat colour Commission Internationale de l’Eclairage ((CIE) L* (lightness), a* (redness), b*(yellowness)) was measured between the 6th and the 11th ribs of each left half carcass using a Minolta CM-2600d spectrophotometer (Konica Minolta Holdings, Inc., Osaka, Japan). Reflectance measurements were collected from a 10°-viewing angle with CIE illuminant C lighting conditions. Fat colour values were recorded from three locations randomly selected avoiding blood dots, air bubbles and less covered areas.
The proportion of reflected light each 10 nm between 450 and 510 nm in subcutaneous fat was collected and the absolute value of the integral of the translated reflectance spectrum (SUM) was calculated according to Prache and Theriez (Reference Prache and Theriez1999), who proposed the use of SUM as an estimator of fat carotenoid pigment content. The reflectance spectrum was translated to make reflectance value at 510 nm equal zero (TR). On the translated spectrum, the integral value was calculated using the following equation, where TRi was the reflectance value at i nm:

Economic analysis
The costs and incomes associated with each fattening management were estimated to compare them in economic terms. The costs considered were: purchase price of the calf, which depended mainly on calf weight; veterinary costs, which were estimated at €12; costs associated with grazing considering lucerne seed, fertilizers, herbicides, insecticides, barley supplementation, water supply and labour; costs associated with concentrate feeding such as concentrate cost and yardage expenses, which include management and fixed costs. In addition, the lucerne produced during period 2 in the plot where LUC + Feedlot animals had been grazing in period 1 was destined for hay production, which produced extra costs associated with the harvesting and transport of lucerne. On the other hand, income achieved per animal at slaughter was calculated according to carcass weight and conformation, and was not different among management strategies (Blanco et al., Reference Blanco, Casasús, Ripoll, Panea, Albertí and Joy2010a). Furthermore, LUC + Feedlot treatment generated an economic return from hay production. The economic margin was calculated as the income achieved minus the above-mentioned costs. Actual selling prices of products and labour during 2004 were considered. In order to determine the economic efficiency of each treatment under different scenarios, a sensitivity analysis was performed considering recent changes in commodity prices (Food and Agriculture Organization of the United Nations (FAO), 2009), such as 25% and 50% increase in cereal prices, and changes in fossil fuel price, which could lead to a 10% and 20% increase in labour costs.
Statistical analyses
Statistical analyses were performed with SAS version 9.1. (SAS Inst. Inc., Cary, NC, USA). Before further analyses, the normality of the residues of all the variables was tested with the Shapiro–Wilk test. The residues of BW, serum IGF-I and leptin concentrations and plasma NEFA concentrations, fat colour and carcass traits were normally distributed. BW, IGF-I, leptin and NEFA concentrations were analysed using mixed models based on Kenward–Roger’s adjusted degrees of freedom solution for repeated measures including feeding treatment, time and their interaction as fixed effects and animal as the random effect. A first-order autoregressive structure with heterogeneous variances for each date was used to model heterogeneous residual error. In the case of plasma carotenoid pigments, the normal distribution of the residues could not be verified and means were compared with the Kruskal–Wallis non-parametric test of the NPAR1WAY procedure of SAS. Differences in weight gains, fattening period length and subcutaneous fat colour were analysed by ANOVA using the GLM procedure with feeding treatment as the fixed effect. Least square means (LS means) were estimated and differences between LS means were tested using a t-test. Pearson’s correlation coefficients between variables were calculated. For all tests, the level of significance was set at 0.05. Trends were discussed when P-values were <0.10.
A forward stepwise discriminant analysis was carried out for subcutaneous fat colour traits, with L*, a*, b*, C*, H* and SUM as the variables evaluated. The Wilks’ lambda method shows which variables contribute significantly to the discriminant function. The selection of variables is done when a variable explains a part of the observed variability (P < 0.05). Selected variables were included in a multinomial logistic regression to calculate the probability of a carcass belonging to a group that had grazed on lucerne (LUC) and the probability of a carcass belonging to a group that had grazed on lucerne and had been finished on concentrates (LUC + Feedlot). When the probability of a carcass belonging to a LUC or LUC + Feedlot was low, then the carcass belonged to the Feedlot treatment.
Intake, G : F ratios and economic analysis were not tested statistically as the data recorded to calculate them were registered on a group basis, and hence only absolute data are presented.
Results
Animal performance
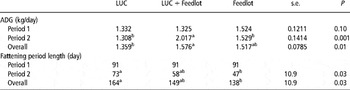
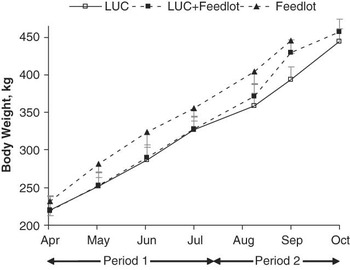
During the first 3 months (period 1), weight gains tended to be greater for Feedlot young bulls than for their grazing counterparts (Table 2), and thus BW at the end of period 1 was similar among management systems (353, 351 and 387 kg in LUC, LUC + Feedlot and Feedlot young bulls, respectively; s.e. = 9.7, P = 0.28; Figure 1). Feedlot animals had an average concentrate intake of 5.5 kg DM/day and a G : F ratio of 22.2 g gain/MJ ME intake, whereas LUC and LUC + Feedlot animals had similar lucerne intake (4.7 and 4.6 kg DM/day, respectively), barley intake (1.8 kg DM/day) and G : F efficiency (19.2 and 19.3 g gain/MJ ME intake, respectively).
Effect of fattening managementFootnote 1 on animal performance

1 Feedlot: concentrate feeding; LUC: lucerne grazing + 1.8 kg DM barley/day; LUC + Feedlot: lucerne grazing + 1.8 kg DM barley/day for 3 months and finishing on concentrates. Within a row, means with different superscript differ at P < 0.05.
Live weight evolution according to fattening management. BW according to the fattening management. Feedlot: concentrate feeding; LUC: lucerne grazing + 1.8 kg DM barley/day; LUC + feedlot: lucerne grazing + 1.8 kg DM barley/day for 3 months and finishing on concentrates.

During period 2, weight gains were the lowest in LUC, intermediate in Feedlot and the greatest in LUC + Feedlot animals (P = 0.001). Weight gains in periods 1 and 2 were similar in LUC (P = 0.48) and Feedlot (P = 0.49) calves but were greater in period 2 than in period 1 in LUC + Feedlot animals (P = 0.001). Feedlot animals had greater concentrate intake (6.4 kg DM/day) and lower G : F (19.2 g gain/MJ ME intake) in this period than in period 1, whereas LUC animals had similar feed intake (5.0 kg DM of lucerne and 1.8 kg DM barley) and 6% lower G : F (18.1 g gain/MJ ME intake) than in period 1. LUC + Feedlot animals had a high concentrate intake (8.5 kg DM/day) and a G : F ratio of 19.6 g gain/MJ ME intake, similar to that of the Feedlot group.
Overall ADG was greatest for LUC + Feedlot, intermediate for Feedlot and the lowest for LUC animals (P = 0.01), and consequently, animals in the LUC treatment needed 26 additional days compared to Feedlot treatment to reach the target slaughter weight (P = 0.03). Overall G : F efficiency was 19.2, 19.3 and 21.0 g gain/MJ ME intake in LUC, LUC + Feedlot and Feedlot treatments, respectively.
Bloat only occurred in two animals, one of LUC and another of LUC + Feedlot treatment, during 1 week and had no further consequences on their performance. Bloated animals were treated with a dilution of sodium (25 g/l per 50 kg BW) and magnesium sulphate (25 g/l per 50 kg BW).
IGF-I, leptin and NEFA concentrations
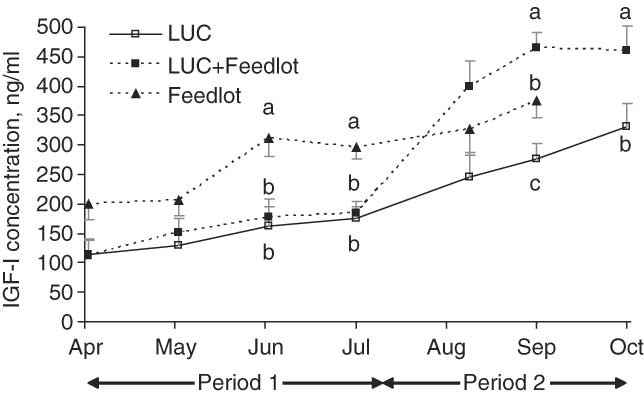
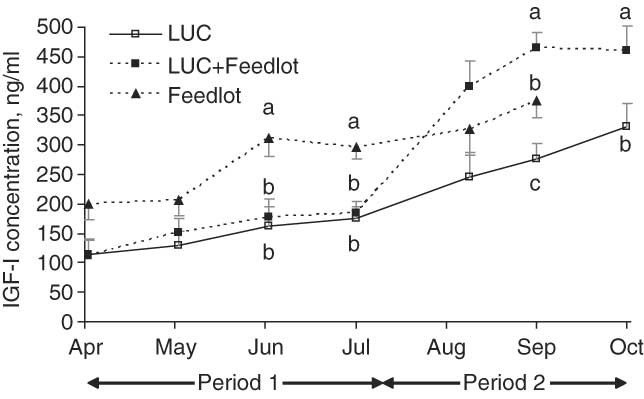
There was a significant interaction between fattening management and measurement date for IGF-I concentrations (P = 0.001), showing different patterns of change during the experiment (Figure 2). Serum IGF-I concentrations of Feedlot animals tended to be greater than those of their grazing counterparts at the beginning of the experimental period (P = 0.05). Then, they had their largest increase (50%) in the 2nd month and remained higher than those of LUC and LUC + Feedlot animals until the end of period 1 (P = 0.001). In period 2, IGF-I concentrations of LUC + Feedlot animals doubled after the 1st month on concentrates and reached their maximum 2 months after the start of this phase. At that moment, IGF-I concentrations were greatest in LUC + Feedlot, intermediate in Feedlot and lowest in LUC animals (P = 0.001).
Circulating IGF-I concentration according to the fattening management. Feedlot: concentrate feeding; LUC: lucerne grazing + 1.8 kg DM barley/day; LUC + Feedlot: lucerne grazing + 1.8 kg DM barley/day for 3 months and finishing on concentrates. Within a date, means with different letters (a, b, c) differ at P < 0.05.
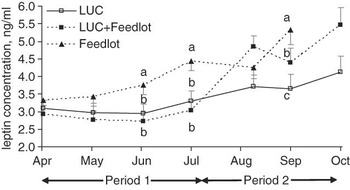
Leptin concentration remained constant in the grazing treatments throughout period 1 (Figure 3), while it increased in Feedlot animals. As a result, leptin concentration of the latter at the end of period 1 was 35% greater than that of their grazing counterparts (P = 0.003). In period 2, leptin concentration of LUC + Feedlot young bulls increased sharply after 20 days on concentrates (P = 0.001) and was similar to that of Feedlot animals, which had not changed compared to the previous month. Thereafter, leptin concentration of LUC + Feedlot animals reached a plateau while it increased in Feedlot animals during the 2nd month of this period (P = 0.03). Grazing young bulls had the lowest leptin concentration throughout this period. The overall increase during period 2 was greater for LUC + Feedlot (64%) than for LUC and Feedlot animals, which had similar increments (22% and 15%, respectively; s.e. = 17.3, P = 0.007).
Serum leptin concentrations according to the fattening management. Feedlot: concentrate feeding; LUC: lucerne grazing + 1.8 kg DM barley/d; LUC + Feedlot: lucerne grazing + 1.8 kg DM barley/d for 3 months and finishing on concentrates. Within a date, means with different letters (a, b, c) differ at P < 0.05.

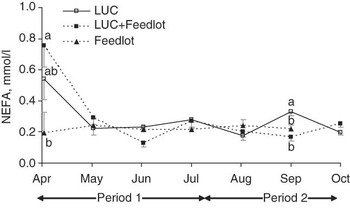
Plasma NEFA concentrations remained steady during most of the experiment, but presented slight differences at specific moments (Figure 4). At the beginning of the experiment, NEFA concentrations were higher in both grazing treatments than in Feedlot animals. Thereafter, concentrations remained steady and similar among treatments, except for an increase in LUC animals halfway through period 2.
Plasma NEFA concentrations according to the fattening management. Feedlot: concentrate feeding; LUC: lucerne grazing + 1.8 kg DM barley/d; LUC + Feedlot: lucerne grazing + 1.8 kg DM barley/d for 3 months and finishing on concentrates. Within a date, means with different letters (a, b, c) differ at P < 0.05.

Live weight was positively correlated with the concentration of IGF-I (r =+0.65, P = 0.001) and leptin (r = +0.41, P = 0.001). Besides, IGF-I and leptin concentrations were correlated (r = +0.61, P = 0.001). Leptin concentrations at slaughter were positively correlated with subcutaneous (r = +0.45, P = 0.04), intermuscular (r = +0.57, P = 0.007) and intramuscular fat content (r = +0.70, P = 0.001; data presented in Blanco et al., Reference Blanco, Casasús, Ripoll, Panea, Albertí and Joy2010a) but not with any carcass traits.
Plasma carotenoid pigment concentration
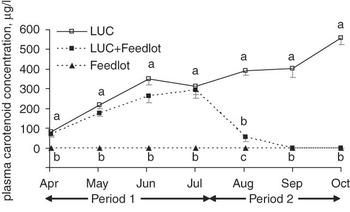
Plasma carotenoid pigment concentrations in Feedlot animals were always below the limit of detection (16 μg/l) throughout the study (Figure 5). Carotenoid pigment concentrations were similar between LUC and LUC + Feedlot treatments during period 1, with values that more than doubled during the 1st month, increased on average by 55% in the following month and then remained steady until the end of period 1.
Plasma carotenoid pigment concentration according to the fattening management. Feedlot: concentrate feeding; LUC: lucerne grazing + 1.8 kg DM barley/day; LUC + Feedlot: lucerne grazing + 1.8 kg DM barley/day for 3 months and finishing on concentrates. Within a date, means with different letters (a, b, c) differ at P < 0.05.

During period 2, carotenoid pigment concentrations of LUC animals were greater than those of the LUC + Feedlot treatment (P = 0.001). In the LUC treatment, their values remained stable for 2 months and then reached their maximum at the end of the experiment. In LUC + Feedlot animals, concentrations diminished by 80% in the 1st month and were below the limit of detection after 2 months of concentrate feeding.
Subcutaneous fat colour and carotenoid content
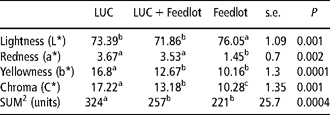
Carcass subcutaneous fat colour and SUM were different among the three management treatments (Table 3). Fat of Feedlot animals had the greatest L* (P = 0.001) and the lowest a* values (P = 0.002), whereas b* was higher in LUC than in the rest of the management systems (P = 0.001). Chroma was greater in LUC, intermediate in LUC + Feedlot and lower in Feedlot animals (P = 0.001). SUM, which is an indicator of the carotenoid pigment content in subcutaneous fat, was 26.1% and 46.6% higher in LUC than in LUC + Feedlot and Feedlot animals, respectively (P = 0.001). SUM was strongly correlated with b* (r = +0.69, P = 0.0005) and C* (r = +0.68, P = 0.0007).
Subcutaneous fat colour and SUMFootnote 1 according to fattening managementFootnote 2
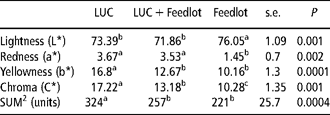
Within a row, means with different superscript differ at P < 0.05.
1 SUM: absolute value of the integral of the translated reflectance spectrum, estimator of fat carotenoid pigment content.
2 Feedlot: concentrate feeding; LUC: lucerne grazing + 1.8 kg DM barley/day; LUC + Feedlot: lucerne grazing + 1.8 kg DM barley/day for 3 months and finishing on concentrate.
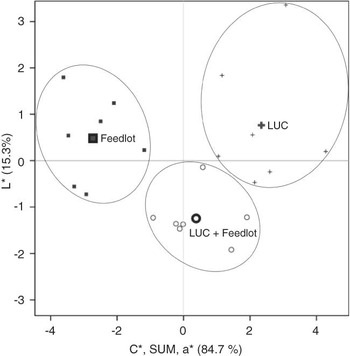
The discriminant analysis performed selected L*, a*, C* and SUM as the variables, which explained the greatest amount of variability of fat colour data (Figure 6) and allowed for classifying correctly 100% of the carcasses. The correlations of L*, a*, C* and SUM were −0.36, 0.42, 0.65 and 0.50 with the first discriminant function (P < 0.05) and 0.81, −0.34, 0.34 and 0.36 with the second discriminant function (P < 0.05). Hue angle and b* were highly correlated with a* (r = −0.90, P < 0.001) and C* (r = 0.998, P < 0.001), respectively, and thus were not included in the analysis.
Canonical plot of subcutaneous fat colour traits obtained from the discriminant analysis. Canonical plot of subcutaneous fat colour traits obtained from the discriminant analysis. Feedlot: concentrate feeding; LUC: lucerne grazing + 1.8 kg DM barley/day; LUC + feedlot: lucerne grazing + 1.8 kg DM barley/day for 3 months and finishing on concentrates.

The multinomial logistic regression included SUM, L*, a* and C*. The first equation determined the probability of a carcass belonging to an animal that had grazed on lucerne P (LUC) = (1 + e18.8–5.6 × L*−36.9 × a*+0.3 × SUM + 29.8 × C*)−1, and the second one determined the probability of a carcass belonging to an animal that had been finished on concentrates P (LUC + Feedlot) = (1 + e833.7–11.8 × L*+4.7 × a*+0.2 × SUM−2.5 × C*)−1.
Economic performance
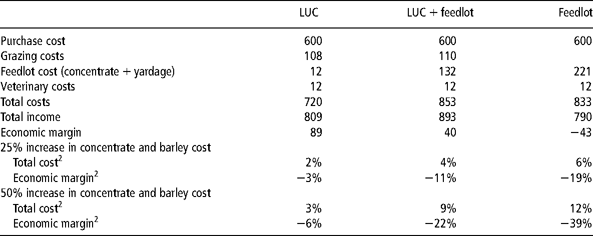
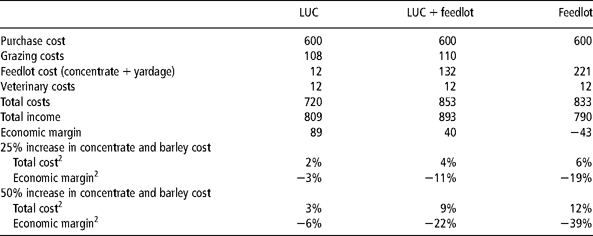
The purchase cost of weaned calves accounted for 70% to 83% of the total costs (Table 4). Grazing costs of LUC and LUC + Feedlot animals were the same except for the lucerne harvest cost (€23) of LUC + Feedlot treatment in period 2; and for the barley supplementation cost, which was higher in LUC animals (49 v. €28 for LUC and LUC + Feedlot animals, respectively). Costs associated with concentrate feeding were 67% higher in Feedlot than in LUC + Feedlot animals. Total costs were 15% lower in the LUC treatment than in the other groups, both of which were similar.
Economic performance and sensitivity analysis under different scenarios according to fattening managementFootnote 1 (Euros/head)
1 Feedlot: concentrate feeding; LUC: lucerne grazing + 1.8 kg DM barley/day; LUC + Feedlot: lucerne grazing + 1.8 kg DM barley/day for 3 months and finishing on concentrates.
2 Compared with actual data obtained in 2004.
The income achieved per carcass was alike in all groups (809, 823 and €790 for LUC, LUC + Feedlot and Feedlot animals, respectively), but LUC + Feedlot treatment yielded extra income from lucerne hay production (4450 kg/ha, €70), and therefore total income was 7% to 9% higher in this treatment. Finally, both LUC and LUC + Feedlot treatments had higher economic margins than the Feedlot one, which was negative.
The analysis of sensitivity of economic margins to different prices of inputs revealed that the increments in concentrates and barley prices had a relevant impact on both total costs and the economic margin of LUC + Feedlot and Feedlot young bulls (Table 4). In the scenario of 50% increment of these costs, the economic margin would be reduced by 6%, 22% and 39% for, LUC, LUC + Feedlot and Feedlot treatments, respectively, increasing the current difference between the first and the last treatments. On the other hand, the increments of labour and product costs associated with grazing treatments were practically irrelevant (data not shown).
Discussion
Animal performance
Mean overall weight gains of Feedlot young bulls were only 12% greater than those of LUC animals, although several studies had reported greater differences between forage- and concentrate-fed cattle (Muir et al., Reference Muir, Smith, Cruickshank and Smith1998b; Steen et al., Reference Steen, Lavery, Kilpatrick and Porter2003). In this study, LUC young bulls had a remarkable performance compared with the data of other works conducted with steers that grazed on lucerne with (Perry et al., Reference Perry, Stiles, Boren, Kilgore, Bartley and Helmer1971) or without grain supplementation (Schlegel et al., Reference Schlegel, Wachenheim, Benson, Black, Moline, Ritchie, Schwab and Rust2000; Lauriault et al., Reference Lauriault, Kirksey, Donart, Sawyer and VanLeeuwen2005). This may partly be explained by the different diets, breeds and sexual status of animals in the current and aforementioned studies.
Weight gains of LUC + Feedlot young bulls that had been grazing increased when they were concentrate-fed in period 2, as Schlegel et al. (Reference Schlegel, Wachenheim, Benson, Black, Moline, Ritchie, Schwab and Rust2000) reported in steers, and were even higher than those of Feedlot animals. This increased performance was a result both of a greater energy intake and a 14% higher efficiency in this phase, which agrees with other studies comparing restricted-realimented v. continuously grown animals (Ellenberger et al., Reference Ellenberger, Johnson, Carstens, Hossner, Holland, Nett and Nockels1989; Hornick et al., Reference Hornick, Van Eenaeme, Gérard, Dufrasne and Istasse2000).
The low incidence of bloat in this study is in accordance with the review of Majak et al. (Reference Majak, Hall and McCaughey1995), who concluded that the risk of bloat was low when cattle grazed on lucerne continuously.
Serum IGF-I, leptin and NEFA concentrations
In ruminants, differences in nutritional levels modify hormonal concentrations (Ellenberger et al., Reference Ellenberger, Johnson, Carstens, Hossner, Holland, Nett and Nockels1989). Serum IGF-I concentrations differed among treatments associated with the different energy content of the diets (Hornick et al., Reference Hornick, Van Eenaeme, Gérard, Dufrasne and Istasse2000). In period 2, the serum IGF-I concentrations of LUC + Feedlot animals were similar to those of the Feedlot treatment after only 20 days on concentrates, reaching a peak at this moment and showing a plateau thereafter, in a pattern similar to other studies (Ellenberger et al., Reference Ellenberger, Johnson, Carstens, Hossner, Holland, Nett and Nockels1989; Hornick et al., Reference Hornick, Van Eenaeme, Gérard, Dufrasne and Istasse2000). In this study, serum IGF-I concentration and BW were closely correlated, as reported by Hornick et al. (Reference Hornick, Van Eenaeme, Diez, Minet and Istasse1998) and Blanco et al. (Reference Blanco, Casasús and Villalba2010b). However, the clear correlation between IGF-I concentrations and long- or short-term ADG observed in other studies was not evident here, as other authors had previously reported (Ronge and Blum, Reference Ronge and Blum1989; McKinnon et al., Reference McKinnon, Cohen, Jones, Laarveld and Christensen1993). Therefore, IGF-1 could not be considered a good predictor of animal performance beyond the short term, as Blanco et al. (Reference Blanco, Casasús and Villalba2010b) had already observed, which would support their hypothesis that, under different nutritional managements, IGF-1 concentration is an immediate consequence of nutrition rather than an indicator of future performance.
Grazing animals had lower serum leptin concentration than Feedlot ones at the end of period 1, probably because leptin is highly sensitive to feeding levels and reflects primarily differences in body fatness (Chilliard et al., Reference Chilliard, Delavaud and Bonnet2005). Leptin concentration increased after 20 days on concentrates in period 2 in the LUC + Feedlot treatment, confirming its rapid response to higher feeding levels (Chilliard et al., Reference Chilliard, Bocquier, Delavaud, Faulconnier, Bonnet, Guerre Millo, Martin and Ferlay1999; Lee et al., Reference Lee, Hong, Kim, Kang, Xu, Cho, Seo, Rho and Choi2006). Leptin was correlated with BW as reported in growing bulls by Geary et al. (Reference Geary, McFadin, MacNeil, Grings, Short, Funston and Keisler2003) and Bellmann et al. (Reference Bellmann, Wegner, Rehfeldt, Teuscher, Schneider, Voigt, Derno, Sauerwein, Weingartner and Ender2004), who also found positive correlations between serum leptin and the amount of fat in different deposits. A positive correlation between serum leptin at slaughter and intramuscular fat content appeared also in the current experiment, and hence leptin could be considered as a predictor of meat composition in these conditions.
The increased NEFA concentrations of grazing young bulls in the first sampling date, which suggest a negative energy balance and indicate fat mobilization, were attributable mainly to the diet fed during the adaptation period, as also observed with IGF-I concentrations that tended to differ. Thereafter, concentrations remained quite constant and similar to those reported by other authors in growing animals in unrestricted energetic conditions (Ellenberger et al., Reference Ellenberger, Johnson, Carstens, Hossner, Holland, Nett and Nockels1989; Hornick et al., Reference Hornick, Van Eenaeme, Diez, Minet and Istasse1998).
Plasma carotenoid pigment concentration and subcutaneous fat colour
The different patterns of plasma carotenoid pigment concentration throughout the study in the three treatments were associated with their contents in the respective diets, as both are highly correlated (Serrano et al., Reference Serrano, Prache, Chauveau-Duriot, Agabriel and Micol2006). They were undetectable in the Feedlot group because the raw compounds of the concentrates used in this study have no or scarce carotenoid pigments, as others have reported (Prache et al., Reference Prache, Priolo and Grolier2003b; Serrano et al., Reference Serrano, Prache, Chauveau-Duriot, Agabriel and Micol2006). In LUC animals, plasma carotenoid pigments increased steadily throughout the experimental period, which could indicate an increased lucerne intake. In the case of LUC + feedlot animals, their persistence in plasma was low after the grazing period finished, as only after 56 days on concentrates they were not detected. Knight et al. (Reference Knight, Death, Lambert and McDougall2001) also reported an abrupt decrease in the first 21 days after grazing in steers fed a low carotenoid pigment ration in a feedlot (corn silage + concentrates with 6 μg β-carotene/g DM), whereas thereafter a slow decline to a minimum on day 70 occurred. Such slight differences in persistence could be mainly attributable to the higher initial carotenoid pigment concentration.
In this study, subcutaneous fat yellowness (b*) was 40% lower in carcasses from Feedlot than in those from LUC animals. Fat colour results from the accumulation of dietary carotenoid pigments in total body fat (Yang et al., Reference Yang, Larsen and Tume1992), and therefore forage-fed animals have greater b* than concentrate-fed ones slaughtered at a common backfat thickness (Bidner et al., Reference Bidner, Schupp, Montgomery and Carpenter1981). LUC + Feedlot young bulls had 25% and 21% lower b* and SUM values than those of LUC animals, respectively. This could be due to the dilution of the initial carotenoid pigments in fat deposited during the feedlot period (Knight et al., 2001), as concentrates did not contain any. In relation to that, Prache et al. (Reference Prache, Priolo and Grolier2003b) reported a reduction in carotenoid pigment concentration in the fat of lambs as a consequence of post-grazing concentrate finishing, estimated in this study with SUM, was less than in the blood, which is in accordance with the present results.
Carotenoid content may vary according to the degree of fat thickness. In this study, no differences were observed when carcass fat was visually assessed, although differences appeared when it was estimated by dissection of the 10th rib (Blanco et al., Reference Blanco, Casasús, Ripoll, Panea, Albertí and Joy2010a). However, to check if the fat content had actually affected carotenoid content estimation, SUM was analysed using subcutaneous fat thickness estimated by dissection as a covariate and this effect was not significant.
Interestingly, the logistic regression obtained with the data of fat colour and SUM was able to discriminate correctly the carcasses from the three fattening treatments. When Prache et al. (Reference Prache, Priolo, Tournadre, Jailler, Dubroeucq, Micol and Martin2002) used the reflectance spectrum in steers, they had an overlap of 33%, and therefore they constructed a new, more accurate model including blood carotenoid pigment content previous to slaughter (Prache et al., Reference Prache, Priolo and Grolier2003b). However, this measurement is methodologically more complex than including only fat colour data, as Ripoll et al. (Reference Ripoll, Joy, Muñoz and Albertí2008) proposed in lambs.
The discriminant analysis selected L*, a*, C* and SUM as the variables, which explained the greatest amount of variability of fat colour data, whereas SUM and C* or b* were selected in lambs depending on the fat depot (Ripoll et al., Reference Ripoll, Joy, Muñoz and Albertí2008). These differences can be associated with the major carotenoids deposited in both animal species. While β-carotene, which is orange and contributes to redness, is the predominant carotenoid pigment in bovine fat (Yang et al., Reference Yang, Larsen and Tume1992), lutein, which is yellow and increases b*, is the major carotenoid pigment in ovine fat. Moreover, the inclusion of a* in the discriminant analysis agrees with Dian et al. (Reference Dian, Andueza, Barbosa, Amoureux, Jestin, Carvalho, Prado and Prache2007), who reported that haem pigments could be involved in the discrimination between pasture- and concentrate-fed lambs.
Economic performance
Changes in overall profitability in yearling programmes, with a low-input period (grazing) and a subsequent high-input period (finishing), are consistent with differences in production costs during each phase. In order to increase profitability under this scenario, improvements in efficiency during the high-input phase must be sufficient to offset the decreased productivity during the low-input phase (Drouillard and Kuhl, Reference Drouillard and Kuhl1999). That premise did occur in this study, as the total extra benefit of LUC + Feedlot young bulls was €82 greater than that of Feedlot animals. In this study, as animals were slaughtered at a target weight and carcass traits were similar among management systems, the income achieved per carcass was also similar. Thus, despite the greater weight gains of LUC + Feedlot animals in period 2, this treatment would be less advisable from an economic point of view in the given circumstances, compared to the LUC treatment. This agrees with Berthiaume et al. (Reference Berthiaume, Mandell, Faucitano and Lafreniere2006), who reported that the substitution of silage by concentrates in the finishing period increased feed costs by 41%. They also concluded that forage-fed beef is more economical to produce, which is confirmed by the greatest total extra benefit obtained from the LUC treatment in this study.
The economic results depend on the relative cost of forages compared with concentrates at a given moment, and on the effect of the shorter feeding period on the fixed cost structure of the farm. In this sense, Lewis et al. (Reference Lewis, Klopfenstein, Pfeiffer and Stock1990) asserted that intensive systems are more profitable when concentrate price is low relative to other costs. In fact, concentrate feeding resulted in economic losses, although it should be noted that in 2004 Spanish beef producers achieved €290 in special and slaughter premium per animal, which led to a positive economic margin. Furthermore, the economic study was based on 2004 data, before the global rise in cereal prices (FAO, 2009), whereas the sensitivity analysis highlighted the better economic performance and thus the robustness of LUC treatment when concentrate prices increased, as occurred after this experiment was conducted.
Acknowledgements
The authors wish to thank I. Delgado and F. Muñoz for their help, A. Bernués for the suggestions and comments and the staff of CITA Research Centre for technical support. Research was funded by the projects INIA RTA 03-031, RZP2004-08, AGL 2002-027 and ERDF.