


1. Introduction
As discussed in Part 1 of this paper, the aim of Part 2 of the paper is to provide a survey of recent applications of deep learning to actuarial problems in mortality forecasting, life insurance valuation, analysis of telematics data and pricing and claims reserving in short-term insurance (also known as property and casualty insurance in the USA and general insurance in the UK). This second part concludes by discussing how the actuarial profession can adopt the ideas presented in the paper as standard methods.
We refer the reader back to Part 1 for a discussion of the organisation of this paper, and to Section 2 of Part 1 for definitions and notation (Richman, Reference Richman2020) which will be used throughout. Appendix A contains a list of all acronyms used in this paper and their definitions.
2. Survey of Deep Learning in Actuarial Science
This section presents a non-exhaustive review of recent applications of neural networks in actuarial science. Since this paper is concerned with the modern application of neural networks, searches within the actuarial literature were confined to articles written after 2006, when the current resurgence of interest in neural networks began (Goodfellow et al., Reference Goodfellow, Bengio and Courville2016) and ended in around July 2018, which is when this paper was drafted. The prominent actuarial journals listed in Appendix A were searched for the key phrase “neural networks,” and the search was augmented by similar searches on the SSRN and arxiv repositories. Articles making only a passing reference to neural networks were dropped from the list, and the resulting list of topics and papers reviewed in this section is as follows:
pricing of non-life insurance (Noll et al., Reference Noll, Salzmann and Wüthrich2018; Wüthrich & Buser, Reference Wüthrich and Buser2018);
incurred but not reported (IBNR) reserving (Kuo, Reference Kuo2018b; Wüthrich, Reference Wüthrich2018a; Zarkadoulas, Reference Zarkadoulas2017) and the individual claims simulation machine of Gabrielli and Wüthrich (Reference Gabrielli and Wüthrich2018);
analysis of telematics data (Gao et al., Reference Gao, Meng and Wüthrich2018; Gao & Wüthrich, Reference Gao and Wüthrich2017; Wüthrich & Buser, Reference Wüthrich and Buser2018; Wüthrich, Reference Wüthrich2017);
mortality forecasting (Hainaut, Reference Hainaut2018a);
approximating nested stochastic simulations (Hejazi & Jackson, Reference Hejazi and Jackson2016, Reference Hejazi and Jackson2017);
forecasting financial markets (Smith et al., Reference Smith, Beyers and De Villiers2016).
Code in the R language for some of the examples in this section and pre-trained models to reproduce the results are provided at: https://github.com/RonRichman/AI_in_Actuarial_Science/
2.1 Pricing of non-life insurance
The standard method for pricing lines of non-life insurance business with significant volumes of data, such as personal lines, is generalised linear models (GLMs) (Parodi, Reference Parodi2014), which extend linear regression models in two main ways – firstly, the assumption of a Gaussian error term is replaced with an extended class of error distributions from the exponential family, such as the Poisson, Binomial and Gamma distributions, and, secondly, the models are only assumed to be linear after the application of a link function, canonical examples of which are the log link for Poisson distributions and the logit link for Binomial distributions. Separate models for frequency and severity are often used, but the option of modelling pure premium with Tweedie GLMs also exists. For more details on GLMs, see Ohlsson and Johansson (Reference Ohlsson and Johansson2010) and Wüthrich and Buser (Reference Wüthrich and Buser2018). GLMs have been extended in several notable ways, such to incorporate smooth functions of the covariates in generalised additive models (GAMs) (a comprehensive introduction to GAMs and their implementation in R is provided by Wood (Reference Wood2017)) or to apply hierarchal credibility procedures to categorical covariates, as in generalised linear mixed models (GLMMs) (see Gelman and Hill (Reference Gelman and Hill2007) for an introduction to GLMMs and other regression modelling techniques). Similar to many other supervised machine learning methods, such as boosted trees or least absolute shrinkage and selection operator (LASSO) regression, GLMs are usually applied to tabular, or structured, data, in which each row consists of an observation, and the columns consist of explanatory and target variables.
Two recent examinations of the performance of GLMs to model frequency compared to machine learning techniques are Noll et al. (Reference Noll, Salzmann and Wüthrich2018) and Wüthrich and Buser (Reference Wüthrich and Buser2018). Noll et al. (Reference Noll, Salzmann and Wüthrich2018) apply GLMs, regression trees, boosting and neural networks to a real third-party liability (TPL) dataset consisting of explanatory variables, such as age of the driver and region, and target variables, consisting of the number of claims, which is freely available as an accompaniment to Charpentier (Reference Charpentier2014). Wüthrich and Buser (Reference Wüthrich and Buser2018) apply a similar set of models to a simulated Swiss dataset. Since the study of Noll et al. (Reference Noll, Salzmann and Wüthrich2018) is on real data where the data generating process is unknown (i.e. similar to the situation in practice), we focus on that study and report supplementary results from Wüthrich and Buser (Reference Wüthrich and Buser2018) Footnote 1 .
After providing a detailed exploratory data analysis (EDA) of the French TPL dataset, Noll et al. (Reference Noll, Salzmann and Wüthrich2018) apply the fundamental step in the machine learning process of splitting the dataset into training and test subsets, comprising 90% and 10% of the data, respectively. Models are fit on the training dataset but tested on out-of-sample data from the test set, to give an unbiased view of the likely predictive performance if the model were to be implemented in practice Footnote 2 .
Since the aim is to compare models of frequency, the loss function (which measures the distance between the observations and the fitted model) used is the Poisson Deviance (minimising the Poisson Deviance is equivalent to maximising the likelihood of a Poisson model, see Wüthrich and Buser (Reference Wüthrich and Buser2018)):
 \begin{equation*}L\left( {D,\lambda } \right) = \frac{1}{n}\mathop \sum \limits_{i = 1}^n 2{N_i}\left( {\frac{{{\lambda _i}{V_i}}}{{{N_i}}} - 1 - \log \left( {\frac{{{\lambda _i}{V_i}}}{{{N_i}}}} \right)} \right)\end{equation*}
where
 $D$
represents the dataset with
 $n$
policy observations having an exposure for policy
 $i$
of
 ${V_i}$
, number of claims
 ${N_i}$
and modelled frequency of claim
 ${\lambda _i}$
.
Since the EDA shows that the empirical (marginal) frequencies of claim are not linear for some of the variables, which is the underlying assumption of a log-linear GLM, some of the continuous variables were converted to categorical variables, that is, some manual feature engineering was applied. When fitting the GLM, it was noted that the area and vehicle brand variables appeared not to be significant based on the p-values for these variables, however, including both variables contributes to a better out-of-sample loss, leading the authors to select the full model (see the discussion in Shmueli (Reference Shmueli2010) and Section 3.1 in Part 1 about the difference between explanatory and predictive models). Although extensions of GLMs are not considered in detail this study, Wüthrich and Buser (Reference Wüthrich and Buser2018) report good performance of GAMs on the simulated dataset they study (which contains only weak interactions between variables). After fitting the GLM, a regression tree and a Poisson Boosting Machine (PBM) are applied (see Wüthrich and Buser (Reference Wüthrich and Buser2018, p. Section 6) for the derivation of the PBM, which is similar to a gradient boosting machine) to the unprocessed dataset, with both models outperforming the GLM, and the PBM outperforming the regression tree on out-of-sample loss. A shallow neural network was then fit to the data, with a hidden layer of 20 neurons, using the sigmoid activation function and the Poisson deviance loss, with a momentum enhanced version of gradient descent. The neural network provides an out-of-sample loss between that produced by the regression tree and the PBM. Interestingly, the authors note that using the exposure as a feature, instead of a constant multiplied by the claims rate
 ${\lambda _i}$
, provides a major performance improvement. The conclusion of the study is that both the PBM and neural network outperform the GLM, which might be because the GLM does not allow for interactions, or because the assumption of a linear functional form is incorrect. Generously, code in R for all of the examples is provided by the authors, and, in the following section, it is shown how the neural network model in this example can be fit and extended using Keras.
2.1.1 Analysis using Keras
In this section, we show how Keras can be used to fit several variations of the shallow neural network discussed in Noll et al. (Reference Noll, Salzmann and Wüthrich2018). At the outset, it is worth noting that the signal-to-noise ratio of claims frequency data is often relatively low (see Section 2.5.5 in Wüthrich and Buser (Reference Wüthrich and Buser2018)) and very flexible or high-dimensional models might not provide much extra accuracy with this type of data.
As noted above, neural networks learn representations of the features that are optimal for the problem they are optimised on, by stacking layers of neurons on top of each other. Each hidden layer can be thought of as a non-linear regression with a feature representation as the output. A neural network without any hidden layers (i.e. without representation learning) is simply equivalent to a regression model, and, therefore, for ease of exposition, we start with a GLM model in Keras, following the data processing steps in Noll et al. (Reference Noll, Salzmann and Wüthrich2018). As mentioned above, after noticing that the assumption of linearity was violated for some of the continuous feature variables, Noll et al. (Reference Noll, Salzmann and Wüthrich2018) apply some feature engineering by discretising these variables (for details, see the code accompanying that paper), thus, the GLM mentioned in this section allows for some non-linear relationships. A different approach would be to use a GAM, which relies on splines to model non-linear relationships between the features and the output Footnote 3 .
Two points should be noted when trying to use Keras to fit a Poisson rate regression. Firstly, Keras includes a Poisson loss function, the minimisation of which is equivalent to minimising the Poisson Deviance; nonetheless, the values returned by this function are not equal to the Poisson Deviance. If the user wishes to track the Poisson Deviance during training, then this may be remedied by defining a custom Poisson Deviance loss function. Secondly, the model required is a Poisson rate regression, where the exposure measure is the time that a policy is in force, and the regression fits the rate of claim based on this exposure measure. To fit this model in Keras, the easiest option is to use the Keras Functional Application Programming Interface (API) to multiply the output of the neural network with the exposure to derive the expected number of claims. Since the rates of claim lie between 0 and 1, the output layer of the neural network was chosen to use a sigmoid activation, and therefore, the network learns the rates on a logit scale, which is slightly different from the log scale used by the GLM. This model is denoted GLM_Keras in Table 1, whereas the baseline GLM fit using the glm() function in R is denoted GLM. The code in R to accomplish this is
Out-of-sample Poisson deviance for the French TPL dataset

 \begin{equation*} \textit{dense}=\textit{NumInputs}\ \%{>}\% \end{equation*}
 \begin{equation*} \textit{layer\_dense(units}=\textit{1}, \textit{activation} = \textit{``sigmoid'')} \end{equation*}
 \begin{equation*} \textit{N} = \textit{layer\_multiply(list(dense,Exposure), name} = \textit{``N'')} \end{equation*}
The out-of-sample Poisson deviance in Table 1 for the GLM fit in Keras is close to that of the baseline GLM. Fitting a shallow neural network requires a single extra line of code:
 \begin{equation*} \textit{dense}=\textit{NumInputs}\ \%{>}\% \end{equation*}
 \begin{equation*} \textit{layer\_dense(units}=\textit{20}, \textit{activation} = \textit{``relu'')}\ \%{>}\% \end{equation*}
 \begin{equation*} \textit{layer\_dense(units}=\textit{1}, \textit{activation} = \textit{``sigmoid'')} \end{equation*}
In this case, a hidden layer with 20 neurons was used, with the ReLu activation function. The same dataset used for the GLM that contained the categorical conversion of the numerical inputs was used as the data in this network, which performed on a par with the neural network model in Noll et al. (Reference Noll, Salzmann and Wüthrich2018) and is denoted NN_shallow in the table. However, this model is somewhat unsatisfying since it relies on manual feature engineering, that is, converting the numerical inputs to categorical values.
Therefore, another network (denoted NN_no_FE) was tried, but the out-of-sample performance was worse than the GLM, indicating that the network did not manage to fit continuous functions to the numerical inputs properly. To overcome this deficiency, the specialised embedding layer discussed above was added to the model for all of the numerical and categorical variables, with a hand-picked number of dimensions for each embedding. The intuition behind this is that the network might better be able to learn the highly non-linear functions mapping the numerical variables to frequency by learning a meaningful multi-dimensional vector for each category. To do this, the numerical variables were split into categories by the quantiles of the numerical variable, defined so as to produce a minimum of 10,000 observations per group. For example, the driver age variable was split into 49 groups, and a 12-dimensional embedding was estimated for each of the 49 groups. The results of this network, denoted NN_embed, were significantly better than all of the models considered to this point.
The learned embeddings for the driver age variable are shown in Figure 1, after applying the t-distributed Stochastic Neighbor Embedding (t-SNE) technique (Maaten & Hinton, Reference Maaten and Hinton2008) to the reduce the multi-dimensional embedding values (12 dimensions) down to two dimensions. In other words, to enable one to inspect what has been learned by the network, we have represented the 12-dimensional embeddings in a two-dimensional space using the t-SNE technique, allowing for some interpretation of the embeddings, which we discuss next.
Driver age embedding reduced to two dimensions using the t-SNE technique.
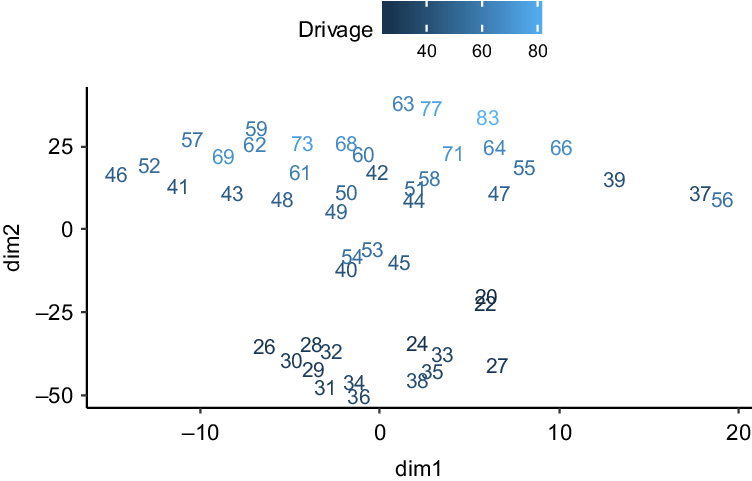
The figure shows that the embeddings for the youngest age groups in the model (i.e. 20 and 22) cluster together, with two additional clusters relaying to the young adult and older adult ages apparent. Figure 2 shows the relationship of the embeddings (again in two dimensions derived using the t-SNE technique) to the driver age variable. The interpretation here is that the first dimension represents a schedule of claims rates according to age, with the rates starting off high at the youngest ages (i.e. above zero), dropping down in the middle ages mostly below zero) and then rising at the older ages (mostly above zero). The second dimension shows how the relationship between the claims rates at the younger and older ages might change by “twisting” the schedule of rates (i.e. if the rates at younger ages go down, those at older ages go up and vice versa). The embedding therefore seems to tie in with the intuition that the youngest and least experienced drivers will have similar high claims frequency experience, that more experienced but nonetheless young drivers will have the lowest claims rates and that the oldest drivers will again experience a rise in frequency.
Driver age embedding reduced to two dimensions using the t-SNE technique, plotted against the driver age variable.

That the learned embedding has an easy and useful interpretation was then shown by including the embedding in a simple GLM model in place of the categorical driver age variable, and this result is referred to in the table as GLM_embed. This application of transfer learning (i.e. reuse of a calibrated neural network component in another model) reduced the out-of-sample loss of the GLM relatively significantly, showing that the learned embedding has a meaning outside of the neural network, and, presumably, even better performance could be achieved by replacing all of the variables in the GLM with the corresponding embeddings. Since actuaries are more used to pricing personal lines business using GLMs, pre-training embeddings in a neural network which are then used within GLMs as additional parameter vectors seems like a promising strategy to be explored further.
A last illustration Footnote 4 of the flexibility of neural networks builds upon the observation of Noll et al. (Reference Noll, Salzmann and Wüthrich2018) that including exposure as a feature component instead of a multiplicative constant results in a much more predictive model. The network denoted as NN_learned_embed implements this idea in two ways. Firstly, the exposure is input into the model via an embedding layer, in the same way as described above for the rest of the numerical features, by splitting the exposure variable into 46 groups, and estimating an 11-dimensional embedding for each of the 46 groups. Secondly, a secondary network is built (within the main network) to apply a multiplicative scaling factor to the policy exposure to produce a “learned exposure” which is used in place of the policy exposure to predict claims frequency. This network is shown in Figure 3.
Learned exposure network. A sub-network learns an exposure modifier factor, which is multiplied with the policy exposure to produce the learned exposure. The learned exposure is used in place of the policy exposure to predict claims frequencies.

Of the networks discussed, the learned exposure network by far outperforms the rest (note that including the exposure embedding but not the secondary network did not produce as optimal a result). To build some intuition, the average learned exposures are shown in Figure 4 plotted against the average exposures in the data, segmented by the number of claims. The figure shows that at the lowest level of exposures, the network has dramatically increased the level of exposure for those policies claiming at least once Footnote 5 , as well as for multi-claimants, indicating that the time a policy spends in force is not an optimal exposure measure, and, indeed, a recent analysis of telematics data appears to indicate that distance travelled is a more optimal exposure measure (Boucher et al., Reference Boucher, Côté and Guillen2017).
Learned exposures, segmented by number of claims made, plotted against exposure.

2.2 IBNR reserving
Reserving for claims that have been incurred but not reported is a fundamental task of actuaries within non-life insurance companies, primarily to ensure the company’s current and future ability to meet policy holder claims, but also to allow for the up to date tracking of loss ratios on an accident and underwriting year basis, which is essential for the provision of accurate management information. Since Bornhuetter and Ferguson (Reference Bornhuetter and Ferguson1972) encouraged actuaries to pay attention to the topic of IBNR reserves, a vast literature on loss reserving techniques has emerged; see, for example, Schmidt (Reference Schmidt2017) and Wüthrich and Merz (Reference Wüthrich and Merz2008). Nonetheless, the relatively more simple chain-ladder method remains the most popular choice of method for actuaries reserving for short-term insurance liabilities, globally and in South Africa (Dal Moro et al., Reference Dal Moro, Cuypers and Miehe2016).
As mentioned in Sections 3 and 4 of Part 1 (Richman, Reference Richman2020) of this paper, the chain-ladder technique can be viewed as a regression, with a specific type of feature engineering used to derive forecasts of the aggregate claims still to be reported, and, therefore, it is not surprising that enhanced approaches based on machine and deep learning are possible. In this section, we discuss several recent contributions applying neural networks to the problem of IBNR reserving.
2.2.1 Granular reserving using neural networks
IBNR reserves are generally calculated at the level of a line of business (LoB), which represents a homogenous portfolio with similar exposure to risk and types of claims. This high-level calculation is generally sufficient for solvency reporting and basic management information. However, a vexing problem in practice is the production of reserves for groupings of business lower than the LoB aggregation, since, on the one hand, these more granular calculations might reveal important information about the business such as particularly poorly performing segments, but on the other hand, the more granular data is often too sparse for the traditional chain-ladder calculations. One potential solution is the various credibility weighted extensions of the chain-ladder, see, for example, Bühlmann et al. (Reference Bühlmann, De Felice, Gisler, Moriconi and Wüthrich2009); Gisler and Wüthrich (Reference Gisler and Wüthrich2008); however, these have been developed only to the extent of a single level of disaggregation from the usual calculations.
A more recent approach is Wüthrich (Reference Wüthrich2018a) who extends the formulation of the chain-ladder as a regression model to incorporate features such as LoB, type of injury and age of the injured. The basic chain-ladder method uses the aggregated incurred or paid claims (or claim amounts) from accident period
 $i$
developed up to a point in time
 $j$
,
 ${C_{i,j}}$
, as the sole input feature into a regression model:
 \begin{equation*}{\hat{C}}_{i,j+1}=f_j.C_{i,j}\end{equation*}
where
 ${\hat{C}}_{i,j+1}$
is the estimated claim amount for the next development period and
 ${f_j}$
is the so-called loss development factor (LDF) (after estimating
 ${\hat{C}}_{i,j+1}$
, the calculations are continued using the predicted value as the next feature for that accident year). This could be expressed in a functional form
 ${\hat{C}}_{i,j+1}=f(X).C_{i,j}$
, where
 $X$
is a feature vector containing only one feature, in this case, the development period
 $j$
. The insight of Wüthrich (Reference Wüthrich2018a) is to extend the feature space
 $X$
to include other components, namely, LoB, labour sector, accident quarter, age of the injured and body part injured, and then, to fit a neural network model to estimate the expanded function
 $f\!\left( X \right)$
. Once this function is estimated, it is used to derive LDFs at the level of granularity of the expanded feature vector
 $X$
, and the chain-ladder method can be applied as normal.
One complication is that as the data are disaggregated, the multiplicative structure of the model may fail if
 ${C_{i,j}}$
is zero (i.e. no claims have been incurred/paid in accident period
 $i$
up to a point in time,
 $j$
). Two approaches are possible. A simpler approach is to calculate a second chain-ladder model, fit for each LoB separately, which projects the total aggregated
 ${C_{i,j}}$
to ultimate using modified LDFs that allow only for the development of claims from zero and a more complicated approach would allow for an intercept in the regression model that is only calculated if
 ${C_{i,j}}$
is zero, that is,
 $\smash{{\hat{C}}_{i,j+1}=f_j.C_{i,j}+1_{C_{i,j}=0}.g_j}$
, where
 ${1_{{C_{i,j}} = 0}}$
is an indicator function that takes the value of one when
 ${C_{i,j}} = 0$
and
 ${g_j}$
is an intercept term relating to development time
 $j$
.
The neural network used in Wüthrich (Reference Wüthrich2018a) had a single layer of 20 neurons and used the hyperbolic tangent activation function. Comparing the neural network and chain-ladder reserves to the true underlying dataset, it was found that the neural network reserves were almost perfectly accurate for three of the four LoBs considered, and more accurate than the chain-ladder reserves, while, on the fourth line, both the neural network and chain-ladder reserves were over-stated, the former more than the latter. The results of the neural network approach were also quite accurate at the level of age, injury code, and claims code, which, besides for allowing for a more detailed understanding of the aggregate IBNR requirements, also allows for the production of detailed management information, as well as input into pricing. To explain the outperformance of the neural network model, Wüthrich (Reference Wüthrich2018a) notes that the neural network is inherently a multivariate approach that leverages similar patterns in the data across LoBs, whereas the chain-ladder is applied to each LoB separately.
In summary, the neural network chain-ladder model is a combination of a traditional actuarial method with a machine learning method, and this paradigm of combining traditional techniques with neural networks will be noted throughout this section.
We refer the reader to the appendices in Wüthrich (Reference Wüthrich2018a) for code to fit the model in Keras.
2.2.2 Individual claims simulation machine
Gabrielli and Wüthrich (Reference Gabrielli and Wüthrich2018) make an important contribution by providing software to simulate individual claims for the purpose of testing individual claims reserving methods. Although the methodology used to simulate is not directly applicable to reserving in practice (since it focuses on modelling a claims dataset that has already fully developed), this research is mentioned here because it uses several neural networks to simulate the complicated individual claims data, and, more importantly, because the availability of test datasets appears to be an important step in advancing the state of the art in machine learning. Wüthrich (Reference Wüthrich2018a) contains code to simulate the claims data for the neural network chain-ladder model using the individual claims simulation machine.
2.2.3 DeepTriangle
A different approach to IBNR reserving appears in Kuo (Reference Kuo2018b), with an associated R package (Kuo, Reference Kuo2018a), who applies many of the concepts mentioned in Section 4 of Part 1 of this paper to a large triangle dataset provided by Meyers and Shi (Reference Meyers and Shi2011). This dataset, which is based on Schedule P submissions of many P&C companies in the USA and is available on the Casualty Actuary Society website, contains paid and incurred claims triangles covering the accident years 1988–1997, the development observed on those triangles in the subsequent years 1998–2006, and earned premiums relating to the accident years. For input to the DeepTriangle model, the incremental paid claims and total outstanding loss reserve triangles were normalised by earned premium, so, effectively, the model is fit to incremental paid and total outstanding loss ratios.
The proposed network combines embedding layers, for the company code categorical feature, and recurrent neural networks (RNNs, namely a gated recurrent unit or GRU, described in Chung et al. (Reference Chung, Gulcehre, Cho and Bengio2015), which is similar to an LSTM unit) for the variable length accident year development up to development period
 $j$
with fully connected layers and is amongst the most complicated of the architectures surveyed in this section
Footnote 6
. The network is a so-called multi-task variant on the single output networks seen until now, with the main goal of the network to predict unseen incremental paid claims, but with a secondary goal of predicting the outstanding reserve balances at each point. Multi-task networks often generalise better than single-task networks, since the shared parameters learned by the model are constrained towards good (i.e. predictive) values (Goodfellow et al., Reference Goodfellow, Bengio and Courville2016). The DeepTriangle model was fit to data from 50 companies in four lines of business, namely, Commercial and Private Auto, Workers Compensation and Other Liability. To fit the network, an initial training run was performed using the data of calendar year 1995 as a training set and 1996–1997 as a validation (out-of-sample) set. The number of epochs to produce the minimal validation set error was recorded, and the model was refit to the data of calendar year 1997 in a second training run. Each extra diagonal predicted by the model was added back to the triangle as input into the next prediction of the model, and the process was followed until the lower triangles were derived. These results show that DeepTriangle network outperforms the traditional Mack and GLM formulations of the chain-ladder on all lines, and is outperformed only on a single line, Commercial Auto, by one of the Bayesian models in Meyers (Reference Meyers2015).
The comparison of DeepTriangle to the traditional chain-ladder models is somewhat unfair, for two reasons. Firstly, actuaries in practise would not generally apply the chain-ladder model without carefully considering the potential for the LDFs to change over the accident years, and secondly, DeepTriangle is a multivariate model fit on 50 triangles of two variables each (paid and outstanding claims), whereas the chain-ladder is fit on a single triangle at a time. A more meaningful comparison would be to a multivariate extension of the chain-ladder, whether a traditional model such as Gisler and Wüthrich (Reference Gisler and Wüthrich2008) or a neural model such as Wüthrich (Reference Wüthrich2018a). Another practical issue to consider is that the model performance probably depends on the volume of data used (i.e. 50 triangles of claims paid and outstanding) and, in practice, only large multi-line insurers would have sufficient data to calibrate this type of network. However, having noted these concerns, the DeepTriangle network, and similar variants which are possible using different combinations of the neural network building blocks discussed in Section 3, represents an opportunity for greater accuracy in and automation of the loss reserving process.
Whereas DeepTriangle works on the level of aggregate claims triangles, a somewhat similar approach applied to individual claims is Zarkadoulas (Reference Zarkadoulas2017), who studies the use of neural networks to predict individual claims payments, using the time series of reserves and payments made to date on each individual claim as a feature vector fed into a shallow neural network. Separate networks are calibrated to estimate the
 $j - 1$
development periods through which an individual claim develops in a triangle. Since the feature vector relies on the time series of claims development to date, it would seem that the method can only be applied to claims already reported (i.e. to estimate Incurred But Not enough Reported) and the details of how this is extended to IBNR claims are unfortunately not clear. In any event, the results of the exercise are very similar to those of the chain-ladder that is also applied.
Code to apply the DeepTriangle model is available in Kuo (Reference Kuo2018a).
2.2.4 Uncertainty
In closing this section, we note that a key issue in the estimation of IBNR reserves is providing an estimate of the uncertainty of the reserve estimates, and we refer the reader to the seminal work of Mack (Reference Mack1993) and England and Verrall (Reference England and Verrall1999) for two foundational approaches to this problem. Within the neural network literature, which has focussed on “best estimate” approaches, relatively less attention has been given to the problem of uncertainty quantification and there does not appear to be a consensus on the most optimal method among the proposed approaches (for the interested reader, two noteworthy techniques appear in Gal and Ghahramani (Reference Gal and Ghahramani2016) and Lakshminarayanan et al. (Reference Lakshminarayanan, Pritzel and Blundell2017)). Perhaps for this reason, the papers covered in this survey do not discuss solutions to the problem of uncertainty estimation, which remains a key research issue that should be addressed by actuaries wishing to apply deep learning techniques practically.
2.3 Analysis of telematics data
Motor insurance has traditionally been priced using a number of rating factors which have been found to be predictive of the frequency and severity of claims. These factors (i.e. features) may relate to characteristics of the driver, such as age, gender and credit score (see Golden et al. (Reference Golden, Brockett, Ai and Kellison2016) who attempt to explain why credit score is predictive of insurance claims), or the characteristics of the motor vehicle, such as weight and power. More recently, the opportunity more directly to measure driving habits and style by incorporating telematics data into pricing has arisen (Verbelen et al., Reference Verbelen, Antonio and Claeskens2018). These data are often high-dimensional and high-frequency feeds containing information on location, speed, acceleration and turning, as well as summarised information about the number, time, distance and road type of trips (Wüthrich & Buser, Reference Wüthrich and Buser2018). The latter data are not as challenging to incorporate into actuarial models, and one approach using GAMs and compositional data analysis is in Verbelen et al. (Reference Verbelen, Antonio and Claeskens2018). More challenging are the former data, primarily because there is no immediately obvious way to incorporate high-frequency sequential data of unknown length into traditional pricing models relying on structured (tabular) data. We believe that the development of techniques to allow for the analysis of these types of data (another example being data from wearable devices) will be an important topic for actuarial science, given the potential commercial applications. Indeed, as mentioned below, Gao et al. (Reference Gao, Meng and Wüthrich2018) have already shown the potential predictive power of features from telematics data.
Within the actuarial literature, Weidner et al. (Reference Weidner, Transchel and Weidner2016b) analyse these high-frequency data using the Discrete Fourier Transform and provide examples of how this analysis could be used. Weidner et al. (Reference Weidner, Transchel and Weidner2016a) simulate driving profiles using a random waypoint model and match profiles from an empirical dataset back to the simulation model. A different approach that we focus on in the next part of this section is described in a series of papers by Wüthrich (Reference Wüthrich2017), Gao and Wüthrich (Reference Gao and Wüthrich2017) and Gao et al. (Reference Gao, Meng and Wüthrich2018) who discuss the analysis of velocity and acceleration information from a telematics data feed. We follow this discussion with an analysis of the data provided by Wüthrich (Reference Wüthrich2018b) using plain and convolutional auto-encoders. In the last part of the section, we discuss the approach taken outside the actuarial literature.
2.3.1 v-a Heatmaps
Wüthrich (Reference Wüthrich2017) introduced the concept of so-called velocity–acceleration (“v-a”) heatmaps. An empirical global positioning system (GPS) location dataset, recorded at a 1-second frequency, of 1 753 drivers and 200 recorded trips was used to estimate the velocity and acceleration (i.e. change in average speed) of the driver at each time point. The various speed profiles were distributed into groups depending on the speed, for example, low speeds between 5–20 km/h and highway speeds between 80 and 130 km/h. Two-dimensional heatmaps, with the x-axis representing velocity in km/h and the y-axis representing acceleration in m/s2 of the density of the empirical observations, were constructed (note that a discrete approach to building the heatmap was taken and another possible approach is two-dimensional kernel density estimation). An example heatmap generated using the code provided by Wüthrich (Reference Wüthrich2018b) is shown in Figure 5.
v-a heatmap generated using the code provided by Wüthrich (2018c). The x-axis is speed, the y-axis is acceleration and the coloured scale shows the empirical density at each point.

An important practical result is in Gao et al. (Reference Gao, Meng and Wüthrich2018), who provide a statistical analysis showing that around 300 minutes of telematics data is generally enough volume to build a stable v-a heatmap in the 5–20 km/h category.
Wüthrich (Reference Wüthrich2017) and Gao and Wüthrich (Reference Gao and Wüthrich2017) then apply several unsupervised learning methods to the v-a heatmaps. In Section 3 of Part 1 of this paper, unsupervised learning was defined as the task of finding meaningful patterns within feature vectors X, which can then be used to further understand the data. In this case, the v-a heatmap is the feature vector comprising the empirical density of observations for each velocity and acceleration group. Wüthrich (Reference Wüthrich2017) applied the k-means algorithm (see James et al. (Reference James, Witten, Hastie and Tibshirani2013) for details) to derive 10 discrete clusters into which the 1 753 v-a heatmaps were classified. Gao and Wüthrich (Reference Gao and Wüthrich2017) took a different approach and looked to derive low-dimensional continuous summaries of the v-a heatmaps using principal components analysis (PCA) and shallow and deep auto-encoder neural networks. PCA was applied to a matrix comprising a row for each driver and a column for each combination of velocity and acceleration, and it was found that relatively good summaries of the heatmaps could be formed using only two of the principal components. The shallow Footnote 7 auto-encoder (called a bottleneck network in this study) consisted of a hidden layer of two neurons, with hyperbolic tangent activation functions and ending in a soft-max layer. The deep auto-encoder consisted of an extra layer of seven neurons before and after the two neuron layer. The auto-encoder was trained using greedy unsupervised learning (Goodfellow et al., Reference Goodfellow, Bengio and Courville2016, p. Chapter 15) (see Section 4 of Part 1 for more details). Both neural networks were trained using the Kullback–Leibler (K–L) loss function, which, in summary, measures how far apart two distributions are, and amounts to maximising the likelihood of a multinomial distribution on the data. On all the metrics considered, the deep auto-encoder network outperformed the shallow auto-encoder, which in turn outperformed the PCA.
Finally, Gao et al. (Reference Gao, Meng and Wüthrich2018) use the features extracted from the v-a heatmaps in a GAM of claim counts. The dataset considered in this study consists of 1 478 divers with 3 332 years of exposure and a relatively high claims frequency of 23.56%. All four methods described above for extracting features from the v-a heatmaps were applied to this new dataset. When applying the k-means algorithm, the number of clusters (i.e. means) were chosen using 10-fold cross-validation (see Friedman et al. (Reference Friedman, Hastie and Tibshirani2009, p. Chapter 7) for more details) to estimate the out-of-sample Poisson deviance. The continuous (PCA and auto-encoder) features were included directly in the GAM. In a stunning result (recall that the features were extracted in an unsupervised manner), the continuous features are not only highly predictive but, by themselves, produce a better out-of-sample deviance than the models including the traditional features of driver’s age and car’s age.
While Gao et al. (Reference Gao, Meng and Wüthrich2018) do not attempt to explain why the features estimated using unsupervised methods are highly predictive in a supervised context, some understanding is possible based on Goodfellow et al. (Reference Goodfellow, Bengio and Courville2016, p. Chapter 15), who are concerned, in Section 15.1, primarily with greedy unsupervised pre-training, and explain that “the basic idea is that some features that are useful for the unsupervised task may also be useful for the supervised learning task,” that is, the unsupervised representation that is learned may capture information about the problem that the supervised learning algorithm can access.
2.3.2 Analysis using Keras
We show in this section how the v-a heatmaps can be analysed using auto-encoders in Keras. For input data, 10,000 heatmaps were generated using the simulation machine of Wüthrich (Reference Wüthrich2018b). Since in any event the data are summarised in the parameters of the simulation machine, we do seek to add much insight in understanding these data, but rather to understand how auto-encoders can be applied.
Two different types of auto-encoder were applied – a basic fully connected auto-encoder, as well as a convolutional auto-encoder. The convolutional auto-encoder uses several layers of learned convolutional filters to derive the encoded heatmap, instead of fully connected layers, and rebuilds the output from the encoded heatmap using transposed convolutions, which are effectively the reverse operation. Both types of auto-encoders were applied with hyperbolic tangent activations. We show the choice of structure for these auto-encoders in Tables 2 and 3.
Structure of fully connected auto-encoder applied to v-a heatmaps

Structure of convolutional auto-encoder applied to v-a heatmaps. For definition of the terms used in this table, see Section 4.3.1 of Part 1

To train these, a process of greedy unsupervised learning was followed. First, the outer layers of each auto-encoder were trained. Then, the weights derived in the first step were held constant (i.e. frozen) and a new layer was added and trained. This process was followed until the dimensionality of the heatmap had been reduced to a 1 × 2 vector of codes. The fully connected auto-encoder used two hidden layers between the input and the encoding, whereas the convolutional auto-encoder used three layers of filters. The encoded heatmaps are shown in Figures 6 and 7, where the two-dimensional encoded values have been grouped according to the quantiles of the encoding distribution. Whereas the codes produced using the fully connected auto-encoder are relatively highly correlated, with a correlation coefficient of 0.85, the codes produced by the convolutional auto-encoder have a much lower correlation of 0.29, implying that the factors of variation describing the heatmap have been better disentangled by the convolutional auto-encoder. The mean heatmaps in each quantile group are shown in Figures 8 and 9. The interpretation of the learned codes is easier in the latter figure – moving from right to left in the encoded distribution shifts density to a higher velocity, and from bottom to top shifts probability density from a wide area to several key points – whereas in the former figure, it is harder to assign a definite interpretation. We conclude from this exercise that convolutional auto-encoders are a promising technique that should be explored further in the context of telematics data. In particular, it would be interesting to investigate the results of including the codes from the convolutional model in a claims frequency model, as done with the codes from a fully connected auto-encoder in the study of Gao et al. (Reference Gao, Meng and Wüthrich2018).
Heatmaps encoded using a fully connected auto-encoder and grouped by quantile of the encoded distribution.

Heatmaps encoded using a convolutional auto-encoder and grouped by quantile of the encoded distribution.

Mean heatmap for each group shown in Figure 6.

Mean heatmap for each group shown in Figure 7.

2.3.3 Other sources
To summarise the approach discussed to this point, the high-dimensional and high-frequency telematics data are first summarised in a v-a heatmap, which, compared to classical features in motor pricing, is itself a relatively high-dimensional feature. The v-a heatmap can be used as a feature in GLM rating models once the data have been summarised using dimensionality reduction techniques. During the (double) summarisation of the data, potentially some information is lost, and, therefore, with enough data, one might expect the application of RNNs to the GPS data, either raw or less summarised than the v-a heatmaps, to outperform approaches that rely on summarised data. Therefore, for completeness, in this section, we discuss several recent applications of neural networks to GPS or telematics data from outside the actuarial literature.
De Brébisson et al. (Reference De Brébisson, Simon, Auvolat, Vincent and Bengio2015) discuss several deep networks applied to the problem of predicting taxi destinations based on variable length GPS data, as well as meta-data describing driver, client and trip features, covering 1.7 million trip records of taxis in Portugal. These meta-data were modelled using embedding layers, while several approaches were taken to model the GPS data directly. The simplest approach (which won the competition) was to use a fixed amount of the GPS data as an input directly to a feed-forward network. More complicated models recognised that the variable length GPS data could be modelled using RNNs, and, therefore, RNN and LSTM networks were calibrated on the raw GPS data, with the output of these networks fed into the same network structure just mentioned (i.e. including embedding layers for the meta-data). A variant of these was the highest ranked model within the authors’ test set.
Dong et al. (Reference Dong, Li, Yao, Li, Yuan and Wang2016) find that deep learning applied directly to GPS data for the task of characterising driving styles does not perform well (whereas in De Brébisson et al. (Reference De Brébisson, Simon, Auvolat, Vincent and Bengio2015), the goal is to predict the destination, that is, the output is in the same domain as the input data). Thus, in a manner similar to Wüthrich (Reference Wüthrich2017), they rely on a data summary approach (which Dong et al. (Reference Dong, Li, Yao, Li, Yuan and Wang2016) refer to as a “double windowing” approach) to process the raw GPS data, which is applied in two steps. First, the raw GPS data are segmented into trip “windows,” meaning to say, that segments of length 256 seconds are selected out of the raw GPS data and, within those segments of 256 seconds of GPS data, the following basic features are calculated: speed and acceleration, and the change in each of these components over time, and angular momentum. Then, the segments of 256 seconds are further segmented into a second measurement “window” of 4 seconds, and within each measurement window, and for each of these basic features, summary statistics (the mean, standard deviation, minimum, maximum, median, and 25th and 75 th percentiles) are calculated. This approach thus leads to a matrix (or feature map) of basic movement statistics for each trip window, where each row represents a movement statistic, and each column represents time (i.e. a new observation window). Since driver behaviour manifests itself over time, one would expect that the movement statistics would have some sort of temporal structure, which is analysed using either convolutional neural networks (CNNs) or RNNs, with a detailed description of the application of both methods in the paper. Notably, cross-correlation between features is not allowed for in either of these models, and, given the performance of the v-a heatmaps discussed above, it would seem that this is an omission. The networks are trained on a dataset consisting of driver trips with the goal of classifying the driver correctly; in a first example, only 50 drivers from the dataset are used, and 1000 drivers are used in the second experiment. A variant of the RNN network outperformed all other approaches, including a machine learning baseline. Investigating the learned features, the study concludes that the network has automatically identified driving behaviour, such as slowing down for sharp turns, or high-speed driving on straight roads.
Dong et al. (Reference Dong, Yuan, Yang, Li and Zhang2017) extend the model of Dong et al. (Reference Dong, Li, Yao, Li, Yuan and Wang2016) in several ways, in a new network they call Autoencoder Regularized deep neural Network (ARNet). Their network design, applied to the same movement statistic feature matrix, relies exclusively on RNNs (specifically, the GRU of Chung et al. (Reference Chung, Gulcehre, Cho and Bengio2015)) for driver classification, in a similar setup to Dong et al. (Reference Dong, Li, Yao, Li, Yuan and Wang2016), but also includes an auto-encoder branch within the network that aims to reconstruct the (hidden) layer of the network that represents driving style. The idea of adding the auto-encoder to the classification model is explained as follows: the auto-encoder is regularised (i.e. the auto-encoder representation is shrunk towards zero), which should improve the generalisation of the classification branch of the network to unseen data, and the classification branch includes prior information about the driver within the network structure, which should improve the auto-encoder representation of driving style. ARNet outperforms on the two tasks tested in the research – driver classification and driver number estimation, compared to both the shallow and deep machine learning baselines also tested in that research.
Wijnands et al. (Reference Wijnands, Thompson, Aschwanden and Stevenson2018) use an LSTM network to predict whether a driver’s behaviour has changed, based on sequences of telematics data, containing, for each sequence, counts of acceleration, deceleration and speeding events. An LSTM is trained for each driver to classify these sequences of events as belonging to one of three benchmarks, one for safe driving, one for unsafe driving and one for the driver under consideration, where the benchmarks are themselves based on an insurer’s proprietary scoring algorithm. If driver behaviour changes, then the LSTM classification is shown to be able to classify the driver’s behaviour as arising from the benchmarks, and not as similar to the driver’s own previous driving style.
We refer the interested reader to the review in Ezzini et al. (Reference Ezzini, Berrada and Ghogho2018) for more references of applying machine learning and statistical techniques to these types of data.
2.4 Mortality forecasting
Mortality rates are a fundamental input into actuarial calculations involving the valuation and pricing of life insurance products. Mortality improvement rates are used by actuaries when modelling annuity products and the results of these models are often highly sensitive to this input, while the stochastic variation of the forecasts around the mean is used for regulatory and economic capital modelling. Various methods are used for deriving mortality rate forecasts, with the Lee and Carter (Reference Lee and Carter1992) and Cairns et al. (Reference Cairns, Blake and Dowd2006) models often used as standard reference points in the actuarial literature. For a benchmark in this section, we focus on the Lee–Carter model, which models log mortality rates (the force of mortality) as a set of baseline average (log) mortality rates for a period which vary non-linearly through time at a rate of change determined for each age multiplied by a time index, as follows:
 \begin{equation*}\textit{ln} ({\mu _{x,t}}) = {a_x} + {\kappa _t}.{b_x}\end{equation*}
where
 ${\mu _{x,t}}$
is the force of mortality at age
 $x$
in year
 $t$
,
 ${a_x}$
is the average log mortality rate during the period at age
 $x$
,
 ${\kappa _t}$
is the time index in year in year
 $t$
and
 ${b_x}$
is the rate of change of log mortality with respect to the time index at age
 $x$
. Often, mortality models are first fit to historical mortality data, and the coefficients (in the case of the Lee–Carter model, the vector
 $\kappa $
) are then forecast using a time-series model, in a second step. Many popular mortality forecasting models can be fit using GLMs and generalised non-linear models
Footnote 8
(GNMs) (Currie, Reference Currie2016) and an R package, StMoMo, automates the model fitting and forecasting process (Villegas, Kaishev, & Millossovich, Reference Villegas, Kaishev and Millossovich2015).
Hainaut (Reference Hainaut2018a) is a recent study that uses auto-encoder networks (see Section 4.2 in Part 1) to forecast mortality (these are referred to as “neural network analyzers” in that paper). Mortality rates in France in the period 1946–2014 are used, with the training set being the rates in the period 1946–2000 and the test set covering 2001–2014. The baseline models against which the neural model is compared are the basic Lee–Carter model, fit using singular value decomposition, the Lee–Carter model fit with a GNM and lastly, an enhanced Lee–Carter model with cohort effects, again fit with a GNM.
For the neural model, several different shallow auto-encoders (similar to those shown in Section 4.2 in Part 1) with varying numbers of neurons in the intermediate layers are tested (these auto-encoders use the hyperbolic tangent activation function). In this study of Hainaut (Reference Hainaut2018a), auto-encoders are viewed through the lens of non-linear PCA, and, for more details on this connection, see Efron and Hastie (Reference Efron and Hastie2016, p. Section 18). Before fitting the networks, the mortality rates are standardised by subtracting, for each log mortality rate
 $\textit{ln} ({\mu _{x,t}})$
, the average mortality over the period,
 ${a_x}$
, and therefore, the aim of the model is to replace the simple linear time-varying component of the Lee–Carter model,
 ${\kappa _t}.{b_x}$
, with a non-linear time-varying function learned using an auto-encoder. Unlike most modern applications of neural networks, in this study, the calibration is performed using genetic evolution algorithms, instead of backpropagation, which is justified in the study since the input to the network is high dimensional. Another interesting aspect of this network is that the network is not fully connected to the inputs, but rather the neurons in the first hidden layers are assigned exclusively to a set of mortality rates, say those at ages 0–4 for the first neuron, those at ages 5–9 for the second and so on (i.e. the neurons in the first layer are only locally connected). This exploits the fact that mortality rates at nearby ages are similar and should lead to a more easily trained network. The encoded mortality (in other words, the value of the neurons in the bottleneck layers of the network) is then forecast using a random walk model with drift. The study provides several examples that show that the predictive power of the mortality forecasts based on neural models is as good as or better than the best performing of the Lee–Carter models.
2.4.1 Analysis using Keras
In this section, we attempt to produce similar results with Keras, noting that the relatively complicated genetic evolution optimisation scheme of Hainaut (Reference Hainaut2018a) is not supported within the Keras package, but only backpropagation and associated optimisers are supported. We also note that the network in the previous example benefits from substantial manual feature engineering, in that the network is fit only to the time-varying component of mortality, and, furthermore, the first hidden layer is only locally connected. The paradigm of representation learning would, however, seem to indicate that the network should be left to figure out these features by itself, and perhaps arrive at a more optimal solution in the process.
Therefore, a first attempt at the problem of mortality forecasting applied greedy unsupervised learning to train fully connected auto-encoders on mortality data (the central rate of mortality,
 ${m_x}$
) from England and Wales in the period 1950–2016, covering the ages 0–99, sourced from the Human Mortality Database (HMD) (Wilmoth & Shkolnikov, Reference Wilmoth and Shkolnikov2010). The training dataset was taken as mortality in the period 1950–1999, and the test dataset was in the period 2000–2016, and the logarithm of
 ${m_x}$
was scaled so as to lie in the interval [0, 1]. The neural networks were fit exclusively on this scaled dataset and were compared to a baseline Lee–Carter model fit directly to the raw
 ${m_{x,t}}$
using the gnm package (Turner & Firth, Reference Turner and Firth2007), and forecast using exponential smoothing as implemented in the forecast package Hyndman et al. (Reference Hyndman, Athanasopoulos, Razbash, Schmidt, Zhou, Khan and Wang2015).
The auto-encoders used hyperbolic tangent activations, and each layer was fit for 50,000 epochs using the Adam optimiser (Kingma & Ba, Reference Kingma and Ba2014) implemented in Keras, with a learning rate schedule hand designed to minimise the training error. Table 4 shows the structure of the auto-encoder. The encoded mortality curves were forecast using a random walk with drift to produce forecasts for each of the years in the period 2000–2016. These results, referred to as Auto-encoder, as well as the Lee–Carter baseline are shown in Table 5. The auto-encoder forecasts outperform the baseline Lee–Carter model, showing that a viable auto-encoder model can be fit in Keras without too much manual feature engineering.
Structure of fully connected auto-encoder applied to mortality data

Mortality forecasting – out-of-sample mean squared error (MSE)

However, it is important to note that fitting the auto-encoders is difficult and computationally expensive, and the results produced on the out-of-sample data can be variable, with worse performance than reported in the table possible. One way of reducing the variability is to average the results of several deep models (Guo & Berkhahn, Reference Guo and Berkhahn2016), but a comparison of the resulting ensemble model to the Lee–Carter model would be unfair. Therefore, we also demonstrate a different approach using deep learning for mortality forecasting and, in the following, show how the Lee–Carter model could be fit and extended using embedding layers.
The Lee–Carter model can be expressed in functional form as
 \begin{equation*}\ln ({\mu _{x,t}}) = f\left( {x,t} \right) = {a_x} + {\kappa _t}.{b_x}\end{equation*}
 \hspace*{10pt}\begin{equation*}{a_x} = g\left( x \right)\left\{\!\! {\begin{array}{*{20}{c}}{{a_1},\ x = 1}\\{{a_2},\ x = 2}\\{...}\\{{a_n},\ x = n}\end{array}} \right.\hspace*{-15pt}\end{equation*}
up to a maximum age
 $n$
, and similarly for
 ${\kappa _t}$
and
 ${b_x}$
. Rather than specify this particular functional form, a neural network can be used to learn the function
 $f\left( {x,t} \right)$
directly, by using age and calendar year as predictors in a neural network that is then trained to predict mortality rates. This network was fit on the same dataset as the auto-encoders and consisted of an embedding layer for age and two hidden layers of 32 neurons with the ReLu activation (between each hidden layer, dropout (Srivastava et al., Reference Srivastava, Hinton, Krizhevsky, Sutskever and Salakhutdinov2014) was applied to regularise the network). The year variable was left as a numerical input to the network and is used to forecast future mortality rates. The structure of this network is shown in Table 6 and is referred to as Deep_reg in Table 5.
Structure of neural network fit to the mortality data for England and Wales

A similar network was fit to the entire HMD dataset at once, with an embedding for the country to which the mortality rates relate. The structure of this network is shown in Table 7 and is referred to as Deep_reg_hmd in Table 5. It can be seen that of all the networks tested, Deep_reg outperforms the others, followed closely by Deep_reg_hmd. However, as discussed next, on the long-term forecast of rates in 2016 (forecast using data up to 1999), the Deep_reg_hmd network outperforms the other networks, followed closely by the auto-encoder.
Structure of neural network fit to the mortality data for the HMD dataset

Figures 10 and 11 show the forecasts of mortality in 2000 (i.e. a one-year horizon) and 2016 (i.e. a 16-year horizon) produced using the models described in this section. All of the models are quite close to actual mortality in 2000, but some of the forecasts diverge compared to actual mortality in 2016. In 2016, the Deep_reg_hmd forecasts follow the actual mortality curve closely at almost all ages, while the Lee–Carter and auto-encoder forecasts appear too high in middle age. On closer inspection, the Deep_reg forecasts in 2000 are quite variable at some ages, and by 2016 have degraded over time and do not appear demographically reasonable, whereas the Deep_reg_hmd forecasts have remained demographically reasonable.
Forecasts of mortality in 2000 using the models described in this section, log scale.

Forecasts of mortality in 2016 using the models described in this section, log scale.

The learned embedding for age from the Deep_reg_hmd network is shown in Figure 12. The dimensionality of the embedding was reduced to 2 dimensions from 20 dimensions using PCA. The first dimension is immediately recognisable as the basic shape of a modern lifetable, which is effectively the function
 ${a_x}$
fit by the Lee–Carter model. The second dimension appears to describe the relationship between early childhood, young middle age, late middle age and old-age mortality, with early childhood and late middle age mortality steepening as young middle age and old-age mortality declines, and vice versa.
Age embedding from the Deep_reg_hmd model, with dimensionality reduced using PCA.

We conclude from this brief study of mortality that deep neural networks appear to be a promising approach for modelling and forecasting population mortality. The neural network model presented in this sub-section is discussed in detail in Richman and Wüthrich (Reference Richman and Wüthrich2018) Footnote 9 .
2.5 Approximating nested stochastic simulations with neural networks
Risk management of life insurance products with guarantees often requires nested stochastic simulations to determine the risk sensitivities (Greeks) and required capital for a portfolio. The first stage of these simulations involves a real-word (i.e. P-measure) simulation of the risk factors in a portfolio, such as the evolution of market factors, mortality and policyholder behaviour. Once the real-world scenario has been run, a risk-neutral (i.e. Q-measure) valuation of the contracts is performed, using the real-world baseline established in the first step as an input into the risk-neutral valuation. This so-called “inner” step ideally consists of Monte Carlo simulations using a market-consistent risk-neutral valuation model. Once the nested simulations have been performed, the risk sensitivities of the portfolio can be calculated and dynamically hedged to reduce the risk of the portfolio, and risk capital can be estimated by calculating risk measures such as value at risk or expected shortfall. A major disadvantage of the nested simulation approach is the computational complexity of the calculations, which may make it impractical for the sometimes intra-day valuations required for the dynamic hedging of life insurance guarantees. As a result, approximation methods such as least squares Monte Carlo, replicating portfolios or machine learning methods may be applied to make the calculations more practical. For more detail and an overview of these methods to approximate the inner simulations, the reader is referred to Gan and Lin (Reference Gan and Lin2015) and the references therein.
A recent approach uses neural networks to approximate the inner simulations for variable annuity Footnote 10 (VA) risk management and capital calculations (Hejazi & Jackson, Reference Hejazi and Jackson2016, Reference Hejazi and Jackson2017). In this section, we focus on the approximation of the Greeks described in Hejazi and Jackson (Reference Hejazi and Jackson2016), since the approximation of the capital requirements in Hejazi and Jackson (Reference Hejazi and Jackson2017) follows almost the same process. Instead of running inner simulations for the entire portfolio of the contracts, in this approach, full simulations are performed for only a limited sample of contracts, against which the rest of the contracts in the portfolio are compared using a neural network adaptation of kernel regression, which we describe next based on Hazelton (Reference Hazelton, Balakrishnan, Colton, Everitt, Piegorsch, Ruggeri and Teugels2014).
Kernel regression is a non-parametric statistical technique that estimates outcomes
 $y$
with an associated feature vector
 $X$
using a weighted average of values that are already known, as follows:
 \begin{equation*}\hat{y}=\frac{\sum^N_{i=1}{w_iy_i}}{\sum^N_{i=1}{w_i}}\end{equation*}
where
 $\hat{y}$
is the estimated value,
 ${y_i}$
is a known outcome of example, or point,
 $i$
and
 ${w_i}$
is the kernel function calculated for point
 $i$
.
 ${w_i}$
is often chosen to be the Nadaraya–Watson kernel, which is defined as
 \begin{equation*}{w_i} = \frac{1}{h}K\left( {\frac{{X - {X_i}}}{h}} \right)\end{equation*}
where
 $K$
is a unimodal symmetrical probability distribution, such as a normal distribution,
 ${X_i}$
is the feature vector associated with point
 $i$
and
 $h$
is the bandwidth, which determines how much weight to give to points which are distant from
 $X$
. For the easy application of basic kernel regression, we refer the reader to the np package in R (Racine & Hayfield, Reference Racine and Hayfield2018).
The insight of Hejazi and Jackson (Reference Hejazi and Jackson2016, Reference Hejazi and Jackson2017) is that kernel regression is unlikely to produce an adequate estimate for complex VA products, and therefore they calibrate a kernel function based on a one-layer neural network that is trained to measure the similarity of input VA contracts with those in the training set, as follows:
 \begin{equation*}\hat{y}=\frac{\sum^N_{i=1}{G_{h_i}y_i}}{\sum^N_{i=1}{G_{h_i}}}\end{equation*}
where
 ${G_{{h_i}}}$
is a function calibrated using a neural network that measures how close contract
 $i$
with feature vector
 ${X_i}$
is to the contract with feature vector
 $X$
. The neural network is set up by choosing a sample of
 $N$
representative VA contracts, and an input contract against which the representative contracts are compared. For each representative contract, a feature vector describing how similar the input contract is to the representative contract
 $i$
is calculated (e.g. if the contracts share a categorical feature, such as guarantee type, then this component of the vector is set to 1, otherwise it is set to zero, and, for quantitative features, such as account value, the relevant component of the feature vector is set to the normalised difference of the features), and the network’s output is a vector of weights calibrated using a soft-max layer that describes how similar the input and representative contracts are. For both the input and representative contracts, the Greeks/risk-neutral value has already been calculated, and the network is trained to minimise the difference between the Greeks/risk value neutral of the input contract and the weighted average of the Greeks/risk-neutral value of the representative contracts, using the vector of weights described in the previous step. The vector of weights required for the adapted kernel regression can be calculated quickly using the trained network, thus dramatically reducing the calculation time for each contract.
Hejazi and Jackson (Reference Hejazi and Jackson2016) report the outperformance of the neural network approach compared to the traditional statistical approach, and Hejazi and Jackson (Reference Hejazi and Jackson2017) show that the network estimates the value of the liabilities and solvency capital requirements accurately.
2.6 Forecasting financial markets
Smith et al. (Reference Smith, Beyers and De Villiers2016) attempt to apply neural networks to the challenging task of forecasting financial markets using lagged data, based on their novel approach to parameterising and training neural networks. In short, instead of applying the (now) standard backpropagation algorithm (see Section 3), they apply the resilient backpropagation (Rprop) algorithm (Riedmiller & Braun, Reference Riedmiller and Braun1993) within a systematic framework for choosing the design and hyper-parameters of the neural networks and use simple time-series models as benchmarks for comparing the performance of the neural networks on South African financial market data. One interesting contribution is a so-called “hybrid model” that first applies time-series models and then fits neural networks to the residuals, which amounts to an attempt to apply boosting (see Friedman et al. (Reference Friedman, Hastie and Tibshirani2009) for more discussion) in the time-series context. Unfortunately, on this difficult task, the much simpler time-series models perform as well or better than the neural networks.
Similar results of the relatively poor performance of basic machine learning methods, compared to simple time-series models, when applied to time-series forecasting, are in Makridakis et al. (Reference Makridakis, Spiliotis and Assimakopoulos2018b). A counterpoint, though, is the impressive performance of a hybrid exponential smoothing-Long Short Term Memory (LSTM) network model in the M4 competition (Makridakis et al., Reference Makridakis, Spiliotis and Assimakopoulos2018a), as well as the strong performance of boosting approaches in that competition.
3. Discussion, Outlook and Conclusion
3.1 Discussion
Section 2 of this paper has presented recent examples of the application of neural networks in actuarial science. In this section, we seek to distil some of the major themes of these applications and place them within the wider context of deep learning.
In most of these examples, there is an emphasis on predictive performance and the potential gains of moving from traditional actuarial and statistical methods to machine and deep learning approaches. This is enabled by the measurement framework utilised within machine learning – models are fit on one dataset (the training dataset) and then measured, more realistically, on unseen data (the test dataset). The metrics used for these measurements, such as mean squared error, are generally familiar to actuaries, but the focus on measuring predictive performance is perhaps less well considered in the actuarial literature. The focus on predictive performance does not necessarily come at a great cost to understanding the models, and, as shown above, the learned representations from deep neural networks often have a readily interpretable meaning, which is often not the case for shallow machine learning techniques. In the wider deep learning context, the focus on measurable improvements in predictive performance has led to many refinements and enhancements of basic deep learning architectures, and this has propelled forward the progress of deep learning research.
Notably, in most of the examples considered above, the deep learning and neural network methods outperformed other statistical and machine learning approaches, thus, to the extent that predictive performance is the key goal for an actuary, it makes sense to consider deep neural networks when choosing a model. In light of this, the earlier assertion of this paper that actuaries should pay attention to deep learning appears to be bolstered by these emerging, successful applications within actuarial science. Of course, the cost of applying deep learning is that these models are often harder to fit than simpler shallow models and one is often required to resort to technically complicated approaches such as greedy unsupervised learning or choosing a particular optimiser.
A further observation is that some of these examples focus on datasets that are more granular and descriptive than traditional datasets analysed by actuaries. The advantage of these datasets is the potential for greater accuracy in pricing and reserving, and an enhanced understanding of the drivers of business performance. The disadvantage, from the standpoint of traditional actuarial methods, is the increased complexity of the methods and their application.
The public availability of large, real-world datasets for research and benchmarking has been important in the recent progress in deep learning, and, thus, the recent attempts within the actuarial community to provide granular claim (Gabrielli & Wüthrich, Reference Gabrielli and Wüthrich2018), IBNR triangle (Meyers & Shi, Reference Meyers and Shi2011) and v-a heatmap (Wüthrich, Reference Wüthrich2018b) datasets should be recognised and applauded by the actuarial community of practitioners and researchers. As a case in point in the context of telematics data, the work of Dong et al. (Reference Dong, Li, Yao, Li, Yuan and Wang2016) and Dong et al. (Reference Dong, Yuan, Yang, Li and Zhang2017) appears to have been supported by the availability of a large anonymised dataset as part of a Kaggle competition, but, unfortunately at the time of writing, this dataset has been removed from the Kaggle website.
Some of the examples effectively combine deep learning together with traditional statistical models – the IBNR reserving study Wüthrich (Reference Wüthrich2018a) shows how to incorporate a neural network into the traditional chain-ladder algorithm, the non-life pricing example of Gao et al. (Reference Gao, Meng and Wüthrich2018) shows how the outputs of unsupervised learning can be incorporated into a GLM model and Hejazi and Jackson (Reference Hejazi and Jackson2016, Reference Hejazi and Jackson2017) show how neural networks can be adapted to enhance kernel regression. The combination of deep learning with statistical methods has shown promising results in the area of time-series forecasting (Makridakis et al., Reference Makridakis, Spiliotis and Assimakopoulos2018a), and it seems likely that more hybrid applications of neural networks will emerge in the near future.
A theme running throughout the deep learning literature is that neural networks can be designed to efficiently process and learn from different types of data. Some of the techniques reviewed in Section 4 are relatively straightforward applications of basic designs such as RNNs, auto-encoders and embedding layers, but new data types require some ingenuity to ensure that the neural networks can be trained, for example, the v-a heatmaps of Wüthrich (Reference Wüthrich2017) and the movement domain feature matrices of Dong et al. (Reference Dong, Li, Yao, Li, Yuan and Wang2016). As new data sources become available to actuaries, the deep learning architectures described in this paper can be considered, but some element of new design might also be necessary. Furthermore, the application of deep learning to actuarial problems can be assisted with the application of, for example, the heuristic presented in Section 2 of part 1 of this paper but novel approaches, such as unsupervised learning, should not be ignored.
3.2 Outlook
The examples of Section 2 show that deep learning is a set of modern machine learning techniques that can enhance the predictive power of models built by actuaries and provide the means potentially to extend actuarial modelling to new types of data. In fact, moving from traditional methods to those based on deep learning does not require much effort, beyond understanding the basic principles of statistical and machine learning, neural networks and modern machine learning software (where effort is required, though, is in fitting the models and interpreting them). The application of deep learning techniques to actuarial problems seems to be a rapidly emerging field within actuarial science, and it appears reasonable to predict that more advances will occur in the near term. Furthermore, the comparatively large element of expert judgement involved in designing and fitting deep neural networks fits in well with the frameworks developed for applying controlled expert judgement within the actuarial profession, such as peer review and technical standards. This emerging field of deep learning is, therefore, an opportunity for actuaries to become experts in the application of artificial intelligence within Actuarial Science, and for actuarial associations to lead their members with guidance on the application of machine and deep learning techniques.
However, the challenge of non-actuary experts moving into the domain of actuaries should not be ignored, and the examples of the advanced telematics models from outside the actuarial literature discussed in Section 4 should provide a warning that actuaries could become less relevant as subject matter experts within insurance if modern techniques, such as those discussed in this research, are not soon incorporated into the actuarial toolkit.
Among the examples surveyed in Section 4, the high-frequency and high-dimensional telematics data are perhaps the most foreign to actuaries trained in analysing structured data. It could be expected that these types of high-frequency data will become more common and applicable in a number of types of insurance, for example, data from wearable devices, autonomous vehicles or connected homes will likely become important in actuarial work in the future. Already, high-frequency location and other data are available for ships and could be incorporated into pricing models for marine insurance, and similar considerations apply for aviation insurance. Therefore, although the analysis of telematics data from human driven cars might potentially be somewhat of an evolutionary dead end within actuarial science if autonomous vehicles replace human-controlled vehicles, nonetheless the methods developed for these data are likely to be useful in other contexts.
Public availability of benchmark datasets and models would encourage more applications of machine and deep learning within actuarial science, and we believe that more actuaries should work to make these available to the actuarial community and that actuarial bodies should communicate these initiatives to their membership. Tutorials, such as Noll et al. (Reference Noll, Salzmann and Wüthrich2018), that benchmark machine and deep learning against traditional actuarial methods contribute greatly to the body of knowledge accessible to the actuarial profession.
Having promoted deep learning in actuarial science, nonetheless, it should be recognised that deep learning is not a panacea for all modelling issues. Applied to the wrong domain, deep learning will not produce better or more useful results than other techniques, and, in this regard, the example of Smith et al. (Reference Smith, Beyers and De Villiers2016) who attempted to predict the South African market with neural networks should be taken as a cautionary tale. Neural networks can be challenging to interpret and explain, but techniques to allow for interpretability, such as showcased in Dong et al. (Reference Dong, Yuan, Yang, Li and Zhang2017) and implemented in Chollet (Reference Chollet2017) and Chollet and Allaire (Reference Chollet and Allaire2018), are increasingly successful at explaining what a neural network has learned. Lastly, deep networks can be challenging to fit and often one needs to resort to complicated technical approaches to achieve optimal results.
As with any technique, whether traditional or based on machine learning, actuaries should apply their professional judgement to consider if the results derived from deep neural networks are fit for purpose and in the public interest.
3.3 Conclusion
This research has presented the major ideas of machine and deep learning within the context of actuarial science and provided examples of applications of deep neural networks to practical problems faced by actuaries in everyday practice. The code examples provided on GitHub accompanying this paper, together with the code in many of the papers cited above, should allow the interested reader to apply deep learning models of their own to traditional actuarial problems.
Several avenues of future research could be pursued. A clear set of benchmark models for actuarial problems could be established, thus making comparison of methods easier and more concrete. The predictive performance of specific neural network architectures on actuarial problems should be investigated in detail, and the connections to traditional actuarial methods, such as credibility, could be made. An important problem that requires more consideration is how estimates of uncertainty might be produced when applying deep learning techniques. Lastly, the professional implications of these techniques within the context of local regulatory environments should be considered.
Acknowledgements
The author wishes to acknowledge the generous contribution into the public domain of code by Noll et al. (Reference Noll, Salzmann and Wüthrich2018) and of previously unavailable data by Wüthrich (Reference Wüthrich2018b). The author wishes to thank Mario Wüthrich for discussion of and insight into several of the papers discussed in Section 4, as well as for helpful comments which improved the quality of this paper. The author is grateful to the anonymous reviewers, whose comments contributed to improving the paper significantly. The neural network diagrams appearing in the paper were created using the NN-SVG software (LeNail, Reference LeNail2019). Data analysis was performed in R (R Core Team, 2018) using the high-performance data.table package (Dowle & Srinivasan Reference Dowle and Srinivasan2018), models were fit using Keras (Allaire & Chollet, Reference Allaire and Chollet2018; Chollet, Reference Chollet2015) with the TensorFlow backend (Abadi et al., Reference Abadi, Barham, Chen, Chen, Davis, Dean, Devin, Ghemawat, Irving, Isard, Kudlur, Levenberg, Monga, Moore, Murray, Steiner, Tucker, Vasudevan, Warden, Wicke, Yu and Zheng2016) and plots were created using ggplot2 (Wickham, Reference Wickham2016) with themes from the ggpubr package (Kassambara Reference Kassambara2018).
Supplementary Material
To view supplementary material for this article, please visit https://doi.org/10.1017/S174849952000024X.
Appendix A. List of Actuarial Journals
Annals of Actuarial Science
ASTIN Bulletin
British Actuarial Journal
European Actuarial Journal
Insurance: Mathematics and Economics
Journal of Risk and Insurance
Scandinavian Actuarial Journal



