I. Introduction
Wineries are growing contributors to local, rural economies through tourism, and a growing literature indicates that such entrepreneurial ventures stand to benefit from social capital acquired through networks, clusters, and alliances (Bruderl and Preisendorfer, Reference Bruderl and Preisendorfer1998; McEvily and Marcus, Reference McEvily and Marcus2005; Zheng, Singh, and Mitchell, Reference Zheng, Singh and Mitchell2015). Social capital is simply the value of the resources (actual and potential) inherent in the social relationships of individuals or collectives (Nahapiet and Ghoshal, Reference Nahapiet and Ghoshal1998; Gedajlovic et al., Reference Gedajlovic, Honig, Moore, Payne and Wright2013). Related studies of wine regions indicate performance advantages of greater connectivity and provide insights as to how such networks form, highlighting the roles of industry associations (Aldecuaa, Vaillant, Lafuented, and Gómez, Reference Aldecuaa, Vaillant, Lafuented and Gómez2017; Giuliani and Bell, Reference Giuliani and Bell2005).
This study explores the impacts of network ties on performance among emergent clusters of wineries in non-traditional regions, such as Illinois, Michigan, Missouri, New York, and Vermont. Wineries and vineyards in these states tend to be younger and smaller than in regions of traditional production, and thus, informal interactions (i.e., sharing of market information and viticultural expertise) among growers and winemakers are fairly prevalent (Chaddad et al., Reference Chaddad, Franken, Gómez and Ross2017; Franken and Bacon, Reference Franken and Bacon2014; Woods, Schieffer, and Saghaian, Reference Woods, Schieffer and Saghaian2011). A survey of wineries provides information on the number and strength of ties with other wineries, grape growers, institutions (e.g., industry associations, government agencies, universities), and other tourism businesses (e.g., food and lodging), as well as various measures of performance (e.g., competitive position, introduction of new, higher value products, profitability, and overall performance). Results indicate that older, more established wineries enjoy a better competitive position, and that making a greater number of connections and stronger connections with other wineries and restaurants further improves competitive position. Similarly, developing and strengthening ties with numerous local attraction and recreation businesses appears to improve most measures of performance. These findings should be of interest to industry stakeholders.
II. Literature and Hypothesis Development
According to network theory (Granovetter, Reference Granovetter1973), strong ties among a densely knit group facilitate information transmission and trust based governance (i.e., bonding social capital), while weak ties among acquaintances offer bridging opportunities that help to link otherwise isolated agents for information exchange (i.e., bridging social capital). Social network analyses of wine regions use survey and/or interview data to deal with these insider/outsider aspects with an emphasis on the performance of the network in terms of information flow.
For instance, Giuliani and Bell (Reference Giuliani and Bell2005) find that in a region of Chile knowledge flows primarily within a core group of wineries with advanced absorptive capacities (i.e., training and experience), while other wineries remain cognitively isolated from the cluster, and in some cases, strongly linked to extra-cluster knowledge (i.e., universities, suppliers, consultants, business associations, etc.). The authors conclude that policy focused on strengthening individual winery's knowledge bases might lead to stronger extra-cluster links, greater knowledge creation, and more intensive intra-cluster diffusion.
Similarly, Aldecuaa et al. (Reference Aldecuaa, Vaillant, Lafuented and Gómez2017) identify strong links, facilitated by industry associations and associated with bonding capital (i.e., idea and resource sharing, social cohesion/loyalty) among wineries that historically served local markets in a region of Spain and weak links associated with bridging capital, stemming from the introduction of four new winery operators, who helped bridge the local network with external agents (i.e., distributors, caterers, sommeliers, specialized journalists, and potential trade partners), leading to a renaissance in the region. The authors recommend a balance of bonding and bridging capital. Such a recommendation implies developing strong and weak ties. However, strong and weak ties are to some degree misnomers, and arguably could be better characterized as insiders and outsiders (e.g., local wineries vs. universities and associations or winery operators from other regions in the previously noted reviewed studies). The literature certainly advocates strong ties among those in network, so if outside ties are beneficial, then surely stronger connections to outsiders (i.e., ties to those that are not closely tied to your other ties) are more so. Hence, with respect to the performance of the winery, we advance the following general hypothesis:
Hypothesis 1
Greater (number and strength of) ties (to all other actors) are associated with greater performance.
Our general hypothesis is tested using survey data from the acquired wineries as described in the next section.
III. Research Design
A. Research Context
We surveyed 549 wineries in Illinois (84), Michigan (117), Missouri (119), New York (201), and Vermont (28) through online and mail questionnaires and personal interviews with the owners of wineries in the summer and fall of 2015. Through the various methods, a total of 127 surveys were collected: 23 from Illinois, 32 from Michigan, 36 from Missouri, 27 from New York, and 9 from Vermont, yielding a final response rate of 22% for the five states.
Survey participants provided information on the age of the winery, volume of production, and participation in wine trails, and various measures of performance (e.g., competitive position, introduction of new, higher value products, profitability, and overall performance). The survey also records the number and strength of ties with other wineries, grape growers, institutions (e.g., industry associations, government agencies, universities), and tourism businesses (e.g., food, lodging, and other tour and recreation businesses). The measurement of the variables computed from the survey items is described in Section III.B.
B. Measures
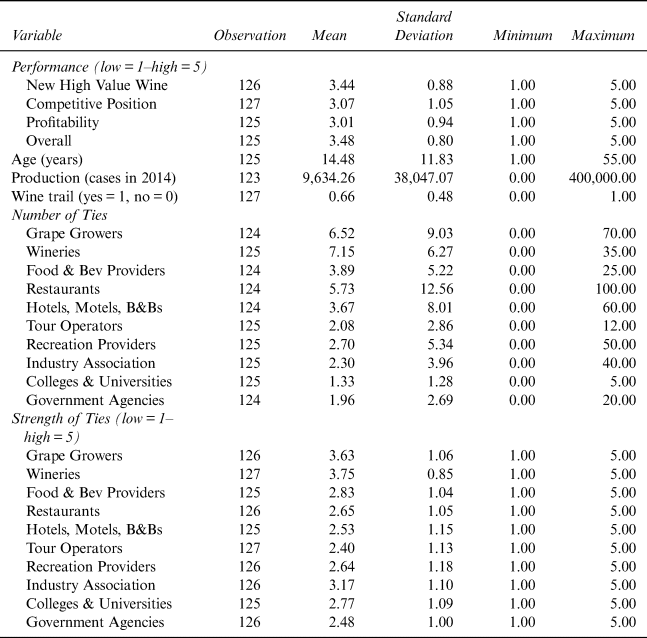
The variables and summary statistics are presented in Table 1. With mean Age of less than 15years in business and Production of 9,635 cases in 2014, these wineries are relatively young and small, similar to those in other studies of emerging wine regions. Means of 10 years and 3,017 cases are reported in Franken and Bacon's (Reference Franken and Bacon2014) study of Illinois. Wineries in Woods, Schieffer, and Saghaian’s (2011) study of Kentucky, Ohio, Indiana, Tennessee, Virginia, Missouri, and Illinois produce 4,330 cases annually on average, and over 40% of those wineries are less than 5 years old. Our sample also includes some much older and larger wineries. The minimum value of zero Cases for our sample reflects that some wineries procure grapes and outsource the production of wine from these grapes. The mean of the binary Wine Trail variable (1 = participant, 0 = nonparticipant) indicates that 66% of wineries participate in wine trails.
Summary Statistics

Source: Computed by authors using survey data.
Wineries also reported the number of ties with other businesses and institutions, as well as the strength of those ties on a five point scale (1 = low to 5 = high). On average, the wineries know about seven other wineries and growers, though the number varies substantially. The strength of these ties are, on average, above the mid-range of three, which is somewhat higher than mean values for the strength of connection with other entities. Ties with Industry Associations are the only other ties with a mean above three. The minimum and maximum values indicate the variation from weak to strong ties among wineries and each of the entity types. Similarly, there is notable variation in the number of ties with businesses related to food, lodging, recreation, and tourism, as well as some institutions (i.e., Industry Associations and Government Agencies). On average, the wineries are tied to about six restaurants, four other food and beverage suppliers, and four lodging businesses (Hotels, Motels, B&Bs). Means indicate less than three ties for the remaining variables. Each performance variable is also measured on a scale (1 = low to 5 = high) with maximum and minimum values reflecting the full continuum. Mean values indicate average performance levels between three and four.
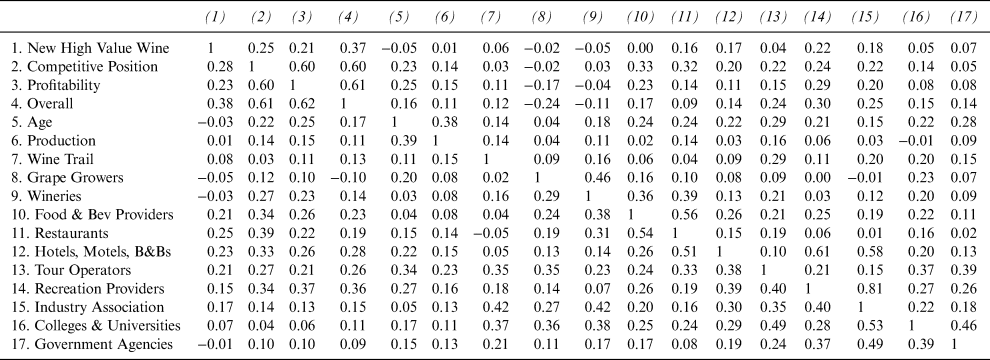
Correlations are presented in Table 2. Upper and lower off-diagonals reflect relations with the number and strength of ties, respectively. There are notable correlations between certain strengths of variable ties (e.g., Food & Bev Providers, Restaurants, and Hotels, Motels, B&Bs; Wine Trail, Tour Operators, Recreation Providers; Industry Association, Colleges & Universities, and Government Agencies). Even stronger correlations exist among some of the number of ties variables (e.g., Hotels, Motels, B&Bs, Recreation Providers, and Industry Association). There is a similar correlation between performance measures.
Correlations

Notes: Upper off-diagonal contains correlations with number of ties (N = 115). Lower off-diagonal contains correlations with strength of ties (N = 113).
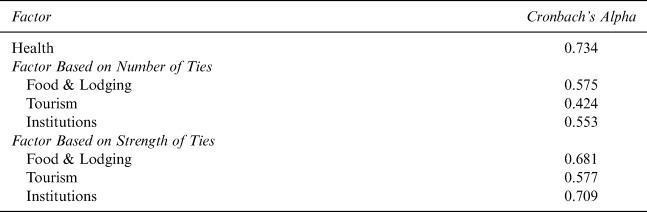
Based on correlations and a priori expectations of related items, confirmatory factor analysis may summarize these relationships as smaller sets of more parsimonious variables (eigenvectors called factors), thereby limiting measurement error, conserving degrees of freedom, and improving power against type II errors in subsequent regressions (Thompson, Reference Thompson2004). Cronbach's (Reference Cronbach1951) alphas above 0.70 indicate reliable factors. Hence, factors based on the strength of the ties are more reliable than those based on the number of ties (Table 3). By either measure the Tourism factor is somewhat less reliable. The Health performance factor shows adequate reliability.
Reliability of Factors

Notes: All underlying survey items are scaled 1 = low to 5 = high, except those dealing with the number of ties. Health is comprised of survey items on new, high value wines, competitive position, profitability, and overall performance. Food & Lodging is comprised of items on ties with restaurants, other food providers, and hotels, motels, and B&Bs. Tourism is comprised of items on ties with tours, recreations businesses, and a binary variable reflecting participation in wine trails. Institutions is comprised of items on ties with industry associations, public agencies, and colleges or universities.
C. Model
McCullagh's (Reference McCullagh1980) ordered logit model (i.e., proportional or cumulative odds) is among the most commonly used models for ordinal dependent variables (e.g., ordered responses, such as 1 = low to 5 = high). The model is analogous to its binary counterparts, but instead of determining the probability of being in either a zero or one category, a greater number of ordered categories is considered. The model is given by:
 $${\rm Pr}\left( {y \le j{\rm \vert }{\rm x}} \right) = F\left( {\alpha _j - {\rm x}^{\prime} \beta } \right) = ({\rm e}^{\alpha j - {\rm x}^{\prime} \beta }) / (1 + {\rm e}^{\alpha j - {\rm x}^{\prime} \beta }) ,j = 1 \ldots J - 1,$$
where x and β are vectors of explanatory variables and coefficients, α j are cutpoints (threshold parameters), there are J response categories, and F(·) is the logistic cumulative distribution function (cdf). See Long and Freese (Reference Long and Freese2006) for derivations and STATA code.
As with other non-linear models, the coefficients do not have the same meaning as in ordinary least squares (OLS) regressions, and hence, other statistics must be calculated to facilitate interpretation. For instance, the odds ratio Ω> j |≤ j (x) = e βk gives the relative change in odds of being in a higher vs. all lower categories for a unit change in a particular explanatory variable x k, keeping all other variables constant. The marginal effects of a unit increase in a particular explanatory variable ∂ Pr(y ≤ j│x)/∂x are interpreted in the usual manner, but are calculated for each response category.
A likelihood ratio test of proportionality of odds across the response categories fails to reject the null hypothesis that there is no difference in the coefficients across models for the New High Value Wine and Overall performance regressions at the 5% level, but does reject the null for the Competitive Position and Profitability regressions. This latter outcome implies that different models are needed to describe the relationships between each pair of outcome groups, but sometimes can be a symptom of too few observations in a particular response category for the dependent variable. In our case, combining the response categories one and two for both remedies the issue. Another reason for combining response categories would be if the cutpoints or threshold parameters are not statistically different from each other, which means that the observed categories are indistinguishable. The cutpoints are statistically significant for the results reported in Section IV.
IV. Results
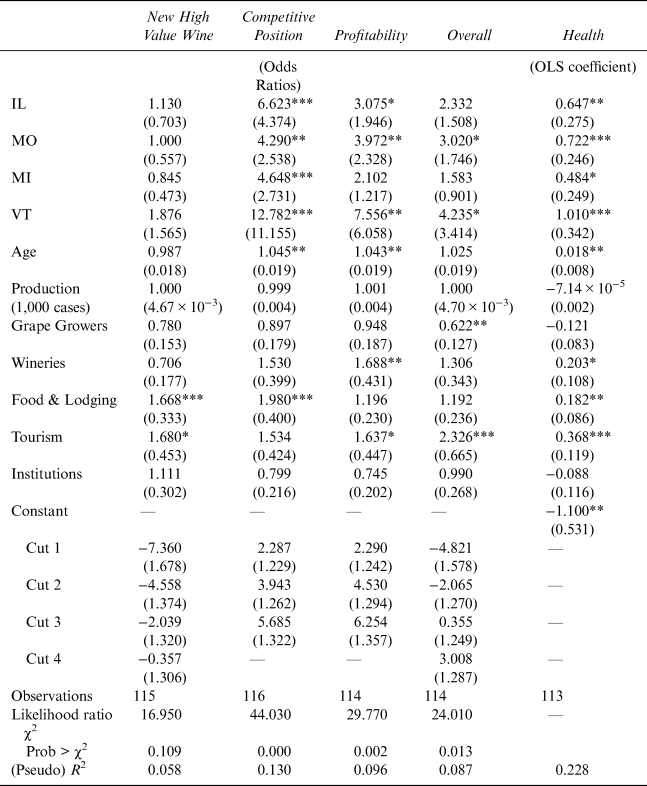
Table 4 contains the coefficients from an ordinary least squares regression of the Health factor and odds ratios from ordered logit regressions of the underlying performance measures. Although Pseudo R 2 numbers are generally low for the ordered logit models, the likelihood ratio tests generally indicate that the model coefficients are jointly significant. As discussed earlier, marginal effects are calculated for each response category for the ordered logit models. In the interest of space, marginal effects are available from the authors upon request, since they generally imply the same sign of effects as odds ratios. An idiosyncrasy of the ordered logit model is that this does not have to be the case. Grape Growers in the Overall performance regression is an exception, where the corresponding odds ratio is significantly positive and the marginal effects indicate a significantly negative relationship. It may be that the latter negative relationship reflects the advantages of vertical integration (i.e., estate vineyards).
Ordered Logit and Ordinary Least Squares Regression Results

Source: Author's model results.
Notes: ***,**,* Significance at the 1%, 5%, and 10% levels, respectively. Standard errors in parentheses.
As can be seen in Table 4, older, established wineries enjoy superior Competitive position and greater Profitability (as well as Health). Here, a year increase in Age means a 1.04 greater odds of the highest category (5) vs. all others (1, 2, 3, 4) and of all higher ones (2, 3, 4, 5) vs. lowest (1). No scale effects are statistically significant. The interpretation of remaining factor analytic variables is complicated, since factors often do not retain the scales of underlying survey items. Hence, we focus on the degree of statistically significant support for the hypothesized positive relationship with these variables.
OLS regressions indicate that Health is improved by strengthening ties with other Wineries, Food & Lodging, and Tourism firms, while ordered logit results offer further insights into the relative impacts on various aspects of performance (Table 4). Strengthening ties with other wineries significantly increases Profitability and has similar nearly significant effects on Competitive position. Strengthening ties with Food & Lodging and Tourism seem to be associated with innovation (New High Value Wine).
A sensitivity analysis using selected underlying variables in place of the factors (to avoid multicollinearity from high correlation) reveals very similar results. Specifically, greater number and strength of ties with Restaurants, Tour operators, and/or Recreation providers significantly improves Competitive position, while that with Tour operators and/or Recreation providers significantly improves Profitability and Overall performance. Related variables, Tour operators and Recreation providers, appear to compete for significance, with alternating levels thereof across regressions.
V. Conclusions
This study investigates a hypothesized positive relationship between the number and strength of network ties and the performance of wineries in Illinois, Michigan, Missouri, New York, and Vermont. Support is found for ties with various types of entities and performance measures. Specifically, the results highlight the importance of ties to other firms involved in local tourism/entertainment and supporting food and lodging sectors.
Future research may employ cluster analysis and structural equation models to further explore how various ties may be related to one another, and thus, how networks arise in emerging wine regions, which may provide further insights into the roles of institutions, such as industry associations, government agencies, and universities.