Introduction
Although there is a growing number of studies on the impact of schizophrenia-associated genetic variation on intermediate phenotypes of schizophrenia (Hatzimanolis et al., Reference Hatzimanolis, Bhatnagar, Moes, Wang, Roussos, Bitsios, Stefanis, Pulver, Arking, Smyrnis, Stefanis and Avramopoulos2015; Power et al., Reference Power, Steinberg, Bjornsdottir, Rietveld, Abdellaoui, Nivard, Johannesson, Galesloot, Hottenga, Willemsen, Cesarini, Benjamin, Magnusson, Ullen, Tiemeier, Hofman, van Rooij, Walters, Sigurdsson, Thorgeirsson, Ingason, Helgason, Kong, Kiemeney, Koellinger, Boomsma, Gudbjartsson, Stefansson and Stefansson2015; Jones et al., Reference Jones, Stergiakouli, Tansey, Hubbard, Heron, Cannon, Holmans, Lewis, Linden, Jones, Davey Smith, O'Donovan, Owen, Walters and Zammit2016; Mistry et al., Reference Mistry, Harrison, Smith, Escott-Price and Zammit2017; Nivard et al., Reference Nivard, Gage, Hottenga, van Beijsterveldt, Abdellaoui, Bartels, Baselmans, Ligthart, Pourcain, Boomsma, Munafo and Middeldorp2017; Riglin et al., Reference Riglin, Collishaw, Richards, Thapar, Maughan, O'Donovan and Thapar2017; van Os et al., Reference van Os, van der Steen, Islam, Guloksuz, Rutten, Simons and Investigators2017; Hatzimanolis et al., Reference Hatzimanolis, Avramopoulos, Arking, Moes, Bhatnagar, Lencz, Malhotra, Giakoumaki, Roussos, Smyrnis, Bitsios and Stefanis2018), more work is required, particularly in order to obtain exact rather than approximate replication (Kapur et al., Reference Kapur, Phillips and Insel2012). In a previous publication, we showed that genetic variation underlying psychosis spectrum disorder was associated with suggested intermediate phenotypes of psychopathology and cognition in a sample of first degree relatives of patients, who have a higher than average genetic and environmental liability, and healthy comparison participants with average genetic liability (van Os et al., Reference van Os, van der Steen, Islam, Guloksuz, Rutten, Simons and Investigators2017). Although the earlier study had an adequate sample size, any study in this area is crucially dependent on exact replication with similar measures and study design. The aim of this publication, therefore, was to produce an exact replication study, repeating the previous discovery analysis, comparing similar groups and using the same self-report and interview measures of psychopathology and cognition to analyse associations with the schizophrenia polygenic risk score (PRS), using the latest available GWAS summary statistics from the Psychiatric Genomics Consortium wave-2 SCZ group as a training set. As our previous study indicated differential patterns of association between relatives and healthy comparison participants, which is in line with the concept that relatives can be expected to show stronger endophenotypic associations than healthy comparison participants, we tested for interactions with relative/control status. The replication sample was derived from Workpackage 6 (GxE Vulnerability & Severity) of the international EUGEI study (European Network of National Networks studying Gene–Environment Interactions in Schizophrenia et al., Reference van Os, Rutten, Myin-Germeys, Delespaul, Viechtbauer, van Zelst, Bruggeman, Reininghaus, Morgan, Murray, Di Forti, McGuire, Valmaggia, Kempton, Gayer-Anderson, Hubbard, Beards, Stilo, Onyejiaka, Bourque, Modinos, Tognin, Calem, O'Donovan, Owen, Holmans, Williams, Craddock, Richards, Humphreys, Meyer-Lindenberg, Leweke, Tost, Akdeniz, Rohleder, Bumb, Schwarz, Alptekin, Ucok, Saka, Atbasoglu, Guloksuz, Gumus-Akay, Cihan, Karadag, Soygur, Cankurtaran, Ulusoy, Akdede, Binbay, Ayer, Noyan, Karadayi, Akturan, Ulas, Arango, Parellada, Bernardo, Sanjuan, Bobes, Arrojo, Santos, Cuadrado, Rodriguez Solano, Carracedo, Garcia Bernardo, Roldan, Lopez, Cabrera, Cruz, Diaz Mesa, Pouso, Jimenez, Sanchez, Rapado, Gonzalez, Martinez, Sanchez, Olmeda, de Haan, Velthorst, van der Gaag, Selten, van Dam, van der Ven, van der Meer, Messchaert, Kraan, Burger, Leboyer, Szoke, Schurhoff, Llorca, Jamain, Tortelli, Frijda, Vilain, Galliot, Baudin, Ferchiou, Richard, Bulzacka, Charpeaud, Tronche, De Hert, van Winkel, Decoster, Derom, Thiery, Stefanis, Sachs, Aschauer, Lasser, Winklbaur, Schlogelhofer, Riecher-Rossler, Borgwardt, Walter, Harrisberger, Smieskova, Rapp, Ittig, Soguel-dit-Piquard, Studerus, Klosterkotter, Ruhrmann, Paruch, Julkowski, Hilboll, Sham, Cherny, Chen, Campbell, Li, Romeo-Casabona, Emaldi Cirion, Urruela Mora, Jones, Kirkbride, Cannon, Rujescu, Tarricone, Berardi, Bonora, Seri, Marcacci, Chiri, Chierzi, Storbini, Braca, Minenna, Donegani, Fioritti, La Barbera, La Cascia, Mule, Sideli, Sartorio, Ferraro, Tripoli, Seminerio, Marinaro, McGorry, Nelson, Amminger, Pantelis, Menezes, Del-Ben, Gallo Tenan, Shuhama, Ruggeri, Tosato, Lasalvia, Bonetto, Ira, Nordentoft, Krebs, Barrantes-Vidal, Cristobal, Kwapil, Brietzke, Bressan, Gadelha, Maric, Andric, Mihaljevic and Mirjanic2014), consisting of 1525 healthy comparison participants and 1282 siblings of patients.
Cognitive vulnerabilities underlying psychosis include cognitive biases such as jumping to conclusion bias, in addition to traditional measures of neurocognition (McLean et al., Reference McLean, Mattiske and Balzan2017). Given that jumping to conclusion bias may be more prevalent in first-degree relatives of patients (Van Dael et al., Reference Van Dael, Versmissen, Janssen, Myin-Germeys, van Os and Krabbendam2006), and no previous study has tested for molecular genetic association with these cognitive biases, we examined, in the replication sample, for association between PRS and a measure of jumping to conclusion bias.
Thus, in the current paper, we analyse associations between PRS on the one hand and measures of psychopathology, neurocognition and jumping to conclusion bias in siblings of patients with a psychotic disorder and healthy comparison subjects. As described above, two samples were used. The first sample, referred to as the ‘GROUP discovery sample’, is a re-analysis of our previously published results in the GROUP sample (van Os et al., Reference van Os, van der Steen, Islam, Guloksuz, Rutten, Simons and Investigators2017). The second sample, referred to as the ‘EUGEI replication sample’, is the analysis of the more recent EUGEI sample.
Method
Samples
EUGEI replication sample
The EUGEI project is a 25-centre, 15-country, EU-funded collaborative network studying the impact of genetic and environmental factors on the onset, course and neurobiology of psychosis spectrum disorder (European Network of National Networks studying Gene–Environment Interactions in Schizophrenia et al., Reference van Os, Rutten, Myin-Germeys, Delespaul, Viechtbauer, van Zelst, Bruggeman, Reininghaus, Morgan, Murray, Di Forti, McGuire, Valmaggia, Kempton, Gayer-Anderson, Hubbard, Beards, Stilo, Onyejiaka, Bourque, Modinos, Tognin, Calem, O'Donovan, Owen, Holmans, Williams, Craddock, Richards, Humphreys, Meyer-Lindenberg, Leweke, Tost, Akdeniz, Rohleder, Bumb, Schwarz, Alptekin, Ucok, Saka, Atbasoglu, Guloksuz, Gumus-Akay, Cihan, Karadag, Soygur, Cankurtaran, Ulusoy, Akdede, Binbay, Ayer, Noyan, Karadayi, Akturan, Ulas, Arango, Parellada, Bernardo, Sanjuan, Bobes, Arrojo, Santos, Cuadrado, Rodriguez Solano, Carracedo, Garcia Bernardo, Roldan, Lopez, Cabrera, Cruz, Diaz Mesa, Pouso, Jimenez, Sanchez, Rapado, Gonzalez, Martinez, Sanchez, Olmeda, de Haan, Velthorst, van der Gaag, Selten, van Dam, van der Ven, van der Meer, Messchaert, Kraan, Burger, Leboyer, Szoke, Schurhoff, Llorca, Jamain, Tortelli, Frijda, Vilain, Galliot, Baudin, Ferchiou, Richard, Bulzacka, Charpeaud, Tronche, De Hert, van Winkel, Decoster, Derom, Thiery, Stefanis, Sachs, Aschauer, Lasser, Winklbaur, Schlogelhofer, Riecher-Rossler, Borgwardt, Walter, Harrisberger, Smieskova, Rapp, Ittig, Soguel-dit-Piquard, Studerus, Klosterkotter, Ruhrmann, Paruch, Julkowski, Hilboll, Sham, Cherny, Chen, Campbell, Li, Romeo-Casabona, Emaldi Cirion, Urruela Mora, Jones, Kirkbride, Cannon, Rujescu, Tarricone, Berardi, Bonora, Seri, Marcacci, Chiri, Chierzi, Storbini, Braca, Minenna, Donegani, Fioritti, La Barbera, La Cascia, Mule, Sideli, Sartorio, Ferraro, Tripoli, Seminerio, Marinaro, McGorry, Nelson, Amminger, Pantelis, Menezes, Del-Ben, Gallo Tenan, Shuhama, Ruggeri, Tosato, Lasalvia, Bonetto, Ira, Nordentoft, Krebs, Barrantes-Vidal, Cristobal, Kwapil, Brietzke, Bressan, Gadelha, Maric, Andric, Mihaljevic and Mirjanic2014). Workpackage 6, entitled ‘Vulnerability and Severity’, focussed on the psychometric expression of genetic and environmental liability in the siblings of patients, who are at higher than average genetic and environmental risk compared to well healthy comparison participants. The sample in Workpackage 6 was collected in Spain (five centres), Turkey (three centres) and Serbia (one centre) and consisted of 1525 healthy comparison participants, 1261 patients with a diagnosis of psychosis spectrum disorder (average duration of illness since age of first contact with mental health services: 9.9 years) and 1282 siblings of these patients. Exclusion criteria for all participants were diagnosis of psychotic disorders due to another medical condition, history of head injury with loss of consciousness, and intelligence quotient <70. The current analyses were restricted to the group of healthy comparison participants and the siblings. Individuals of a non-white ethnic group (n = 30) were excluded, as were individuals with missing GWAS information (n = 463), leaving 2314 participants (1208 healthy comparison participants and 1106 relatives) for the current analysis.
To achieve high quality and homogeneity in clinical, experimental, and environmental assessments, standardised instruments were administered by psychiatrists, psychologists, or trained research assistants who completed mandatory on-site training sessions and online training modules including interactive interview videos and self-assessment tools (European Network of National Networks studying Gene–Environment Interactions in Schizophrenia et al., Reference van Os, Rutten, Myin-Germeys, Delespaul, Viechtbauer, van Zelst, Bruggeman, Reininghaus, Morgan, Murray, Di Forti, McGuire, Valmaggia, Kempton, Gayer-Anderson, Hubbard, Beards, Stilo, Onyejiaka, Bourque, Modinos, Tognin, Calem, O'Donovan, Owen, Holmans, Williams, Craddock, Richards, Humphreys, Meyer-Lindenberg, Leweke, Tost, Akdeniz, Rohleder, Bumb, Schwarz, Alptekin, Ucok, Saka, Atbasoglu, Guloksuz, Gumus-Akay, Cihan, Karadag, Soygur, Cankurtaran, Ulusoy, Akdede, Binbay, Ayer, Noyan, Karadayi, Akturan, Ulas, Arango, Parellada, Bernardo, Sanjuan, Bobes, Arrojo, Santos, Cuadrado, Rodriguez Solano, Carracedo, Garcia Bernardo, Roldan, Lopez, Cabrera, Cruz, Diaz Mesa, Pouso, Jimenez, Sanchez, Rapado, Gonzalez, Martinez, Sanchez, Olmeda, de Haan, Velthorst, van der Gaag, Selten, van Dam, van der Ven, van der Meer, Messchaert, Kraan, Burger, Leboyer, Szoke, Schurhoff, Llorca, Jamain, Tortelli, Frijda, Vilain, Galliot, Baudin, Ferchiou, Richard, Bulzacka, Charpeaud, Tronche, De Hert, van Winkel, Decoster, Derom, Thiery, Stefanis, Sachs, Aschauer, Lasser, Winklbaur, Schlogelhofer, Riecher-Rossler, Borgwardt, Walter, Harrisberger, Smieskova, Rapp, Ittig, Soguel-dit-Piquard, Studerus, Klosterkotter, Ruhrmann, Paruch, Julkowski, Hilboll, Sham, Cherny, Chen, Campbell, Li, Romeo-Casabona, Emaldi Cirion, Urruela Mora, Jones, Kirkbride, Cannon, Rujescu, Tarricone, Berardi, Bonora, Seri, Marcacci, Chiri, Chierzi, Storbini, Braca, Minenna, Donegani, Fioritti, La Barbera, La Cascia, Mule, Sideli, Sartorio, Ferraro, Tripoli, Seminerio, Marinaro, McGorry, Nelson, Amminger, Pantelis, Menezes, Del-Ben, Gallo Tenan, Shuhama, Ruggeri, Tosato, Lasalvia, Bonetto, Ira, Nordentoft, Krebs, Barrantes-Vidal, Cristobal, Kwapil, Brietzke, Bressan, Gadelha, Maric, Andric, Mihaljevic and Mirjanic2014). Both on-site and online training sessions were repeated annually to maintain high inter-rater reliability throughout the study enrolment period (for details see https://cordis.europa.eu/result/rcn/175696_en.html).
The EUGEI project was approved by the Medical Ethics Committees of all participating sites and conducted in accordance with the Declaration of Helsinki. All respondents provided written informed consent and, in the case of minors, such consent was also obtained from parents or legal guardian.
GROUP discovery sample
The current paper also presents a re-analysis of the discovery sample, presented in detail in a previous publication, pertaining to the GROUP study, an ongoing multicentre study in the Netherlands of patients diagnosed with schizophrenia and related disorder, as well as their siblings, parents and healthy participants (Korver et al., Reference Korver, Quee, Boos, Simons and de Haan2012; van Os et al., Reference van Os, van der Steen, Islam, Guloksuz, Rutten, Simons and Investigators2017). The current analysis in the GROUP sample focussed on 336 healthy comparison participants and 649 siblings of patients, who were assessed three times over a period of 6 years, yielding 2416 observations.
Allowing for true replication from GROUP discovery to EUGEI replication sample
To allow for true replication in the original discovery sample of the Dutch GROUP study, differences between the previous GROUP study and the current EUGEI study that were under our control were dissolved. Thus, one possible reason for discrepancy between studies using polygenic risk for schizophrenia is difference in the platform for molecular genetic analysis used, as well as difference in the version of the GWAS summary statistics from the training sample (Psychiatric Genomics Consortium wave-2 SCZ group). To neutralise these factors, GWAS was repeated in the GROUP sample (data version 7.0), using the same genetic analysis platform as used in the current (and later) EUGEI study. Similarly, quality control and calculation of polygenic scores were done in the same fashion as the EUGEI study. In addition, a standardised cognitive score was calculated in the GROUP sample, based on the same variables as in the EUGEI sample. In addition, the same comparison between healthy comparison participants and healthy siblings of patients was conducted. Previous publications in the GROUP sample have shown significant differences between healthy comparison participants and siblings in the measures of CAPE and SIS-R psychosis proneness used in the current analysis, with siblings displaying higher values (Genetic Risk and Outcome in Psychosis Investigators, 2011).
Measures
The GROUP discovery and EUGEI replication samples used the same instruments as listed below, with the exception of the beads task, which was used only in the EUGEI replication sample.
Interview-based schizotypy: SIS-R
The SIS-R was administered to healthy comparison participants, parents and siblings. The SIS-R is a semi-structured interview containing 20 schizotypal symptoms and 11 schizotypal signs rated on a 4-point scale (Kendler et al., Reference Kendler, Lieberman and Walsh1989; Vollema and Ormel, Reference Vollema and Ormel2000). Symptoms are defined as verbal responses to standardised questions concerning, for example, magical ideation, illusions, and referential thinking. Signs refer to behaviours that are rated by the interviewer such as goal-directedness of thinking and flatness of affect. Questions and rating procedures are standardised. Guided by previous research, 33 item scores were reduced a priori to two-dimensional scores, representing the means of seven positive schizotypy items (covering the areas of referential thinking, psychotic phenomena, derealisation, magical ideation, illusions, and suspiciousness) and eight negative-disorganised schizotypy items (covering the areas of social isolation, sensitivity, introversion, restricted affect, disturbances in associative and goal-directed thinking, poverty of speech, and eccentric behaviour).
Self-reported psychotic experiences: CAPE
The Community Assessment of Psychic Experiences (CAPE; http://www.cape42.homestead.com) was developed to rate self-reports of lifetime psychotic experiences (Konings et al., Reference Konings, Bak, Hanssen, van Os and Krabbendam2006). Items are modelled on patient experiences as contained in the Present State Examination, 9th version (Wing et al., Reference Wing, Cooper and Sartorius1974), schedules assessing negative symptoms such as the Scale for the Assessment of Negative Symptoms (SANS) (Andreasen, Reference Andreasen1982) and the Subjective Experience of Negative Symptoms (SENS) (Selten et al., Reference Selten, Sijben, van den Bosch, Omloo Visser and Warmerdam1993), and scales assessing depressive symptoms such as the Calgary Depression Scale (Addington et al., Reference Addington, Addington and Maticka-Tyndale1993). Items are scored on a 4-point scale. In the current analyses, CAPE dimensions of frequency of positive experiences (20 items), negative experiences (14 items) and depressive experiences (8 items) were included (measured at baseline and 3-year follow-up), representing the person's perceived psychosis load over the lifetime (at baseline) or in the past three years (follow-up). A total score representing the mean of all items was calculated for each dimension.
Cognitive score
Cognition ability was estimated based on a short version of the WAIS-III short form: the Digit Symbol Coding subtest, uneven items of the Arithmetic subtest, uneven items of the Block Design subtest, every third item of the Information subtest (Wechsler, Reference Wechsler1997; Blyler et al., Reference Blyler, Gold, Iannone and Buchanan2000; Velthorst et al., Reference Velthorst, Levine, Henquet, de Haan, van Os, Myin-Germeys and Reichenberg2013). For each test, the Z-score was calculated separately for each country and sex. The cognition score was the mean of the Z-scores of the different tests, expressed as a T-score (cognition score shifted and scaled to have a mean of 50 and a standard deviation of 10). The measure will be referred to hereafter as ‘cognitive score’.
Beads task (EUGEI replication sample only)
The beads task (Phillips and Edwards, Reference Phillips and Edwards1966) is an experimental test designed to measure individuals' reasoning style under ambiguous conditions. It was administered only in the replication sample (EUGEI study). A computerised version of the beads task was completed to assess the presence or absence of the Jumping to Conclusions (JTC) bias. Participants were shown two jars containing red and blue coloured beads in opposite ratios. In this study, the ratio of 60 to 40 beads was chosen, resulting in 100 beads in each jar. The jars as well as all instructions were presented on a computer screen. After both jars were shown and a training session was completed, participants were instructed that all beads are drawn consecutively from one jar and, once presented, were returned to the same jar. After each draw, participants were asked whether they wanted to see another bead or make a decision on which jar the beads were drawn, with the possibility to see up to 20 beads before a decision had to be made. The order of presented beads was predetermined and the dominant colour presented in the training session selected at random. The number of beads drawn at was considered to represent individuals' reasoning style and used as a dependent variable in the analyses.
Genotyping, imputation and polygenic risk scores
Samples of all individuals, i.e. pertaining to both the discovery and the replication sample, were genotyped at Cardiff University Institute of Psychological Medicine and Clinical Neurology, using custom Illumina HumanCoreExome-24 BeadChip genotyping arrays containing probes for 570 038 genetic variants (Illumina, San Diego, CA). Genotype data were called using the GenomeStudio package and transferred into PLINK format for further analysis.
Genotype quality control – variants
Quality control was conducted in PLINK v1.07 (Purcell et al., Reference Purcell, Neale, Todd-Brown, Thomas, Ferreira, Bender, Maller, Sklar, de Bakker, Daly and Sham2007) or with custom Perl scripts. Variants with call rate <98% were excluded from the dataset. Hardy–Weinberg Equilibrium p value was calculated separately in Turkish, northern European and southern European samples. Variants with Hardy–Weinberg Equilibrium p value <1 × 10⁻⁶ in any of these three regions were excluded from the dataset. After QC, 559 505 variants remained.
Genotype quality control – samples
Samples with call rate <98% were excluded from the dataset. A linkage disequilibrium pruned set of variants was calculated using the – indep-pairwise command in PLINK (maximum r 2 = 0.25, window size = 500 SNPs, window step size = 50 SNPs) and used for further analyses. Homozygosity F values were calculated using the – het command in PLINK, and outlier samples (F < −0.11 or F > 0.15) were excluded. The genotypic sex of samples was calculated from X chromosome data using the – check-sex command in PLINK, and samples with different genotypic sex to their database sex were excluded.
Identity-by-descent (IBD) values were calculated for the sample in PLINK. Samples with one or more siblings among the genotyped samples according to the database but no identified genotypic siblings (defined as PI-HAT >0.35 and <0.65) were excluded. After these were removed from consideration, samples with two or more database siblings in the database that were not supported by the genotypic data were also excluded.
After visually observing clustering of errors by genotyping chip, we decided to exclude chips with a high proportion of errors. All samples on chips with five or more sample exclusions due to heterozygosity or call rate (out of 12 possible samples) were excluded. All samples on chips with four or more sample exclusions due to sex or relative checks were also excluded unless their identity was corroborated by concordance between database and genotype relatedness data with a sample on another chip.
Principal component analysis
Principal components (PCs) were calculated in PLINK using LD pruned variants after combining the dataset with the Thousand Genomes reference dataset. Due to the inherently multi-population nature of the dataset and the variety of possible analyses, no exclusions were made to the whole dataset based on this analysis; population effects were corrected for separately in individual analyses.
Imputation
After quality control, genotypes were imputed on the Michigan Imputation Server using the Haplotype Reference Consortium reference panel (version 1.1) and the programmes Eagle for haplotype phasing and Minimac3 for imputation (Das et al., Reference Das, Forer, Schonherr, Sidore, Locke, Kwong, Vrieze, Chew, Levy, McGue, Schlessinger, Stambolian, Loh, Iacono, Swaroop, Scott, Cucca, Kronenberg, Boehnke, Abecasis and Fuchsberger2016; Loh et al., Reference Loh, Danecek, Palamara, Fuchsberger, AR, KF, Schoenherr, Forer, McCarthy, Abecasis, Durbin and LP2016). After imputation, variants with an imputation r 2 > 0.6, MAF > 0.1% and call rate >99% were retained (8 277 535 variants). Best-guess genotypes were generated from genotype probabilities using PLINK.
Polygenic risk score calculation
PRS-SCZ was constructed using summary statistics from the PGC2 genome-wide association study, excluding samples present in the GROUP data (Schizophrenia Working Group of the Psychiatric Genomics Consortium, 2014). Clumping was performed in imputed best-guess genotypes for each dataset using PLINK (maximum r 2 = 0.2, window size = 500 kb, minimum MAF = 10%, minimum INFO score = 0.7), and variants within regions of long-range LD around the genome (including the MHC) excluded (Price et al., Reference Price, Weale, Patterson, Myers, Need, Shianna, Ge, Rotter, Torres, Taylor, Goldstein and Reich2008). PRS-SCZ were then constructed from best-guess genotypes using PLINK at 10 different p value thresholds (P T = 1, 0.5, 0.3, 0.2, 0.1, 0.05, 0.01, 1 × 10⁻⁴, 1 × 10⁻⁶, 5 × 10⁻⁸). We used P T = 0.05 for our primary analysis, as this threshold explained the most variation in the phenotype in the PGC2 analysis (Schizophrenia Working Group of the Psychiatric Genomics Consortium, 2014).
In the EUGEI WP6 dataset, the number of siblings and controls for whom a polygenic risk score could be thus constructed, after QC and imputation, and after exclusion of non-white ethnic groups was: 1106 and 1208, respectively. In the GROUP dataset, a polygenic risk score could be similarly computed for 649 siblings and 336 healthy comparison participants, after exclusion of non-white groups.
Analyses
EUGEI WP6 database version 1.0 and GROUP database version 7.0 were used for the analyses. Bivariate scatterplots were constructed for SIS-R scores, CAPE scores, cognitive score and beads task on the one hand, and PRS on the other. Random intercept multilevel regression models (taking into account clustering of participants within families as well as within countries and, in the re-analysis of the discovery sample, clustering of repeated measures within participants) with SIS-R scores, CAPE scores, cognitive score and beads task as dependent variables were fitted using the MIXED routine in the Stata program, version 15 (StataCorp, 2017). Independent variables were polygenic risk score, a priori corrected for age and sex, while all models including PRS were additionally adjusted for ancestry, using the first 10 PCs.
To examine robustness of findings with regards to assumptions of normality, log-transformed outcomes of SIS-R scores, CAPE scores, cognitive score and beads task were additionally examined, using the Stata LNSKEW0 routine. LNSKEW0 creates newvar = ln(±exp − k), choosing k and the sign of exp so that the skewness of newvar is zero.
To examine to what degree the size of any association between PRS and measures of psychopathology/cognition would be stronger for siblings than for healthy comparison subjects, interactions were fitted between group (healthy comparison participant/relative status) and continuous PRS. Interaction analyses were followed by calculation of polygenic risk score effect sizes, stratified by group (i.e. calculating associations between PRS and measures of psychopathology/cognition separately for siblings and healthy comparison subjects), derived from the model with the interaction, using the STATA MARGINS command.
In line with Rothman (Reference Rothman1990), corrections for multiple testing were not applied. Instead, we relied on a discussion of coherence and possible unifying pattern of results.
Results
EUGEI replication sample description
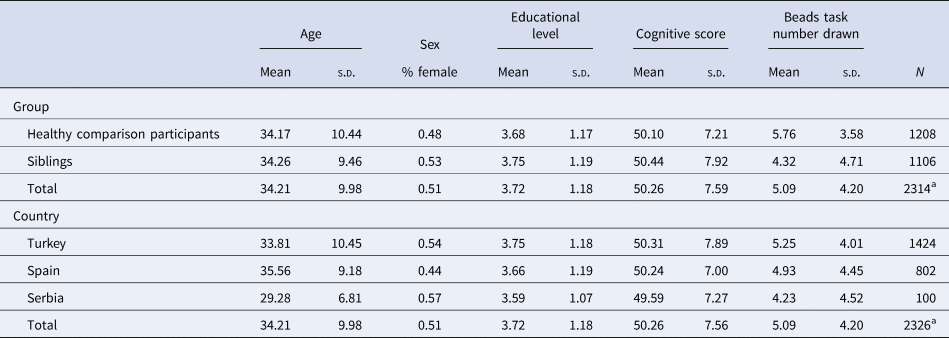
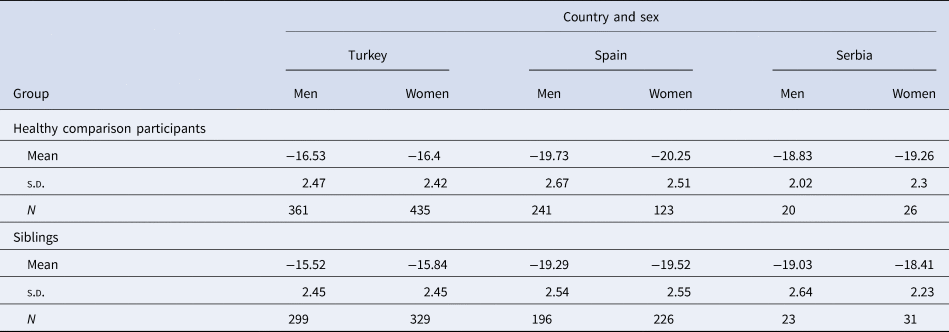
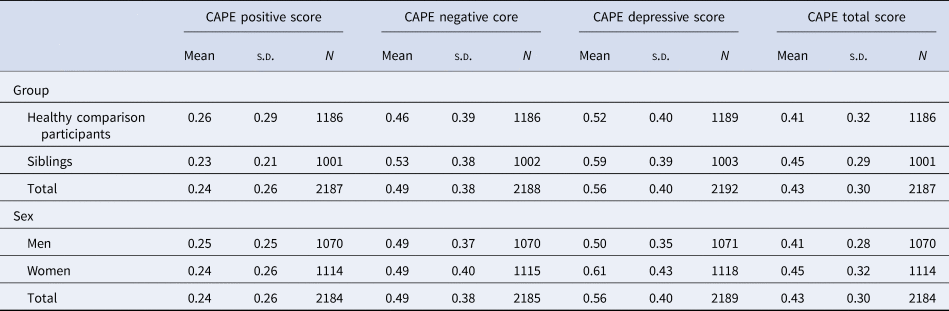
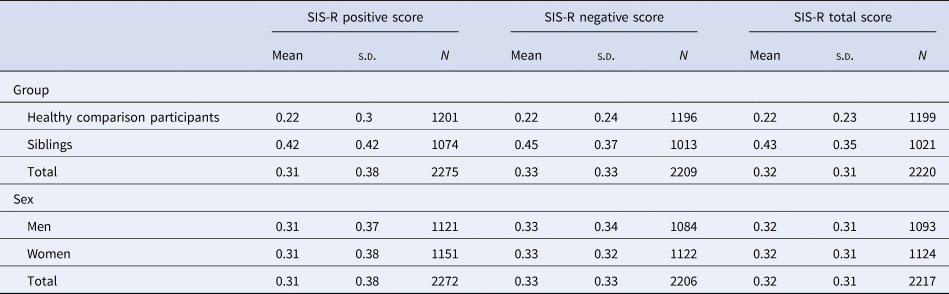
Relatives and healthy comparison participants showed similar demographic characteristics and cognitive scores. These variables also showed comparable distributions across the different countries, although participants tended to be younger in Serbia and the proportion of women was smaller in Spain (Table 1). Polygenic risk score scores were higher in Turkey, similar across the sexes and higher in the siblings (Table 2). Siblings had a higher schizophrenia polygenic risk score than healthy participants (standardised effect size: 0.06, p = 0.006). Scores of SIS-R and CAPE were similar for men and women, with the exception of the CAPE depressive dimension, which was higher for women. Siblings had significantly higher scores on CAPE and SIS-R measures, with the exception of the CAPE positive dimension, probably due to defensive answering (data not shown) (for details see Tables 3 and 4).
Sample demographics and cognitive scores, by group and country

s.d., standard deviation; N, number of observations.
a 12 individuals had unknown group status.
Polygenic scores by country, sex and group

s.d., standard deviation; N, number of observations.
CAPE scores by group and sex

s.d., standard deviation; N, number of observations.
SIS-R scores by group and sex

s.d., standard deviation; N, number of observations.
Association between polygenic risk score and group in the EUGEI replication sample
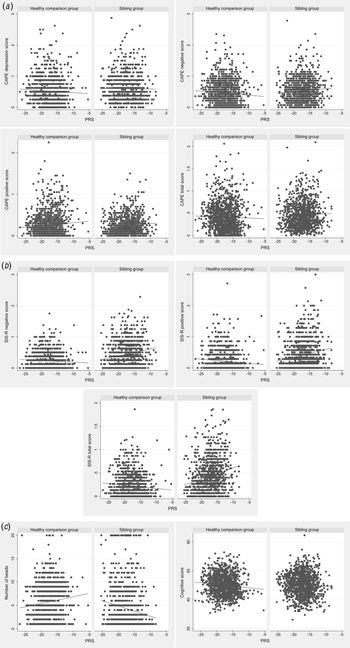
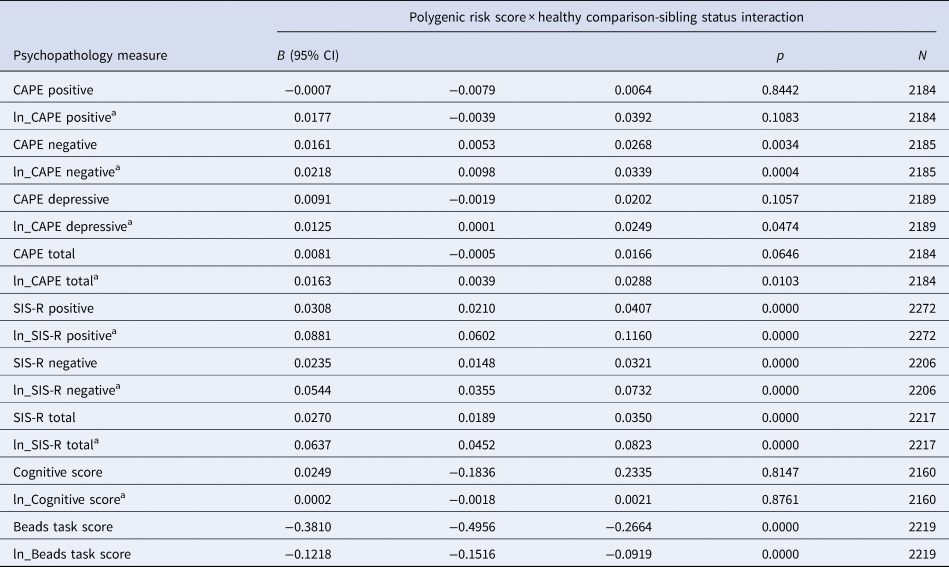
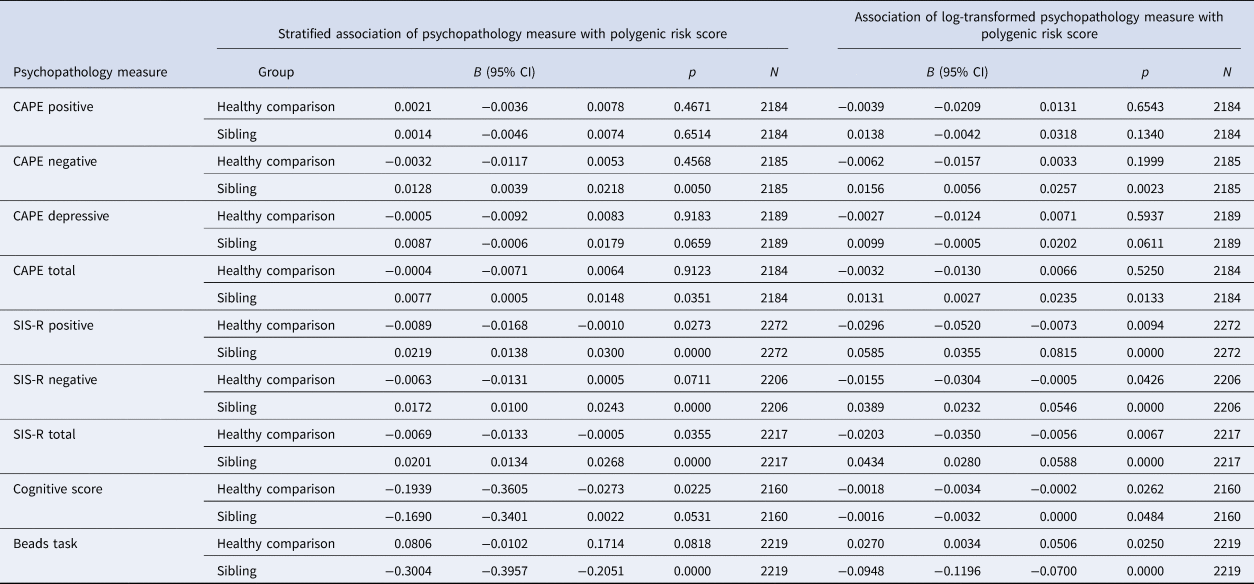
Scatter plots of CAPE, SIS-R and cognitive dimensions on the one hand and polygenic risk score on the other generally showed that (i) the direction of association differed between siblings and healthy comparison subjects and (ii) siblings displayed stronger associations, with the exception of cognitive score (Fig. 1). Accordingly, all multilevel regression models of (log-transformed) SIS-R, CAPE and cognitive scores showed significant interaction between polygenic risk score and group, with the exception of CAPE positive dimension and cognitive score (Table 5). Stratified analyses revealed significant or suggestive positive associations between PRS and SIS-R and CAPE measures (with the exception of the CAPE positive dimension), and a negative association with beads task number of beads in the siblings. In the healthy comparison participants, there was either no association (CAPE measures) or a weak, directionally inverse association (SIS-R measures, beads task) (Table 6). Cognitive scores showed a different pattern, with weak negative associations with polygenic risk in both the sibling and the control groups.
PRS scatterplots with regression line for CAPE (a), SIS-R and (b) and cognition (c) outcomes.

Associations between polygenic risk score and CAPE/SIS-R/cognitive (bias) scores, and interaction with healthy comparison-sibling status

B, regression coefficient from the multilevel model; 95% CI, 95% confidence interval; p, p value; N, number of observations.
a Log-transformed measure.
Associations between polygenic risk score and measures of psychopathology, by groupa

B, regression coefficient from multilevel model; 95% CI, 95% confidence interval; p, p value; N, number of observations.
a As derived from linear combination of terms in the model with the interaction.
Re-analysis of original GROUP discovery sample
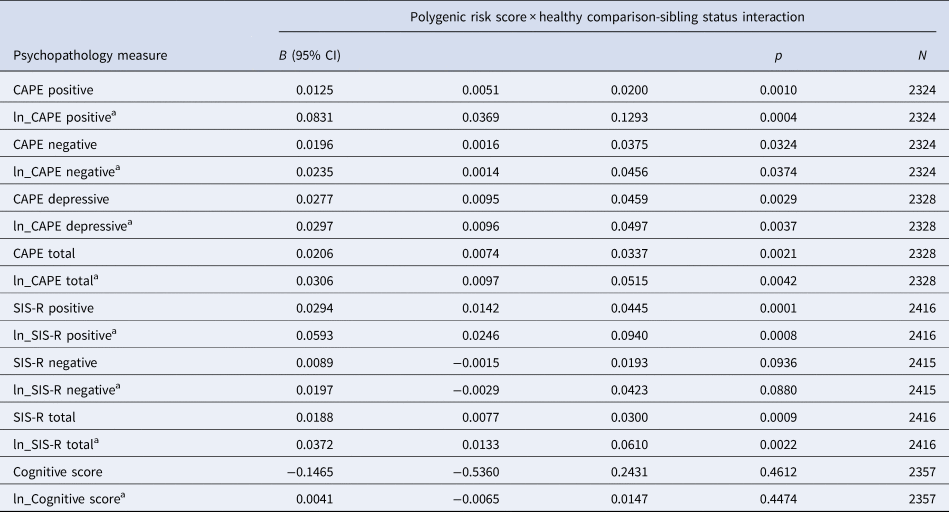
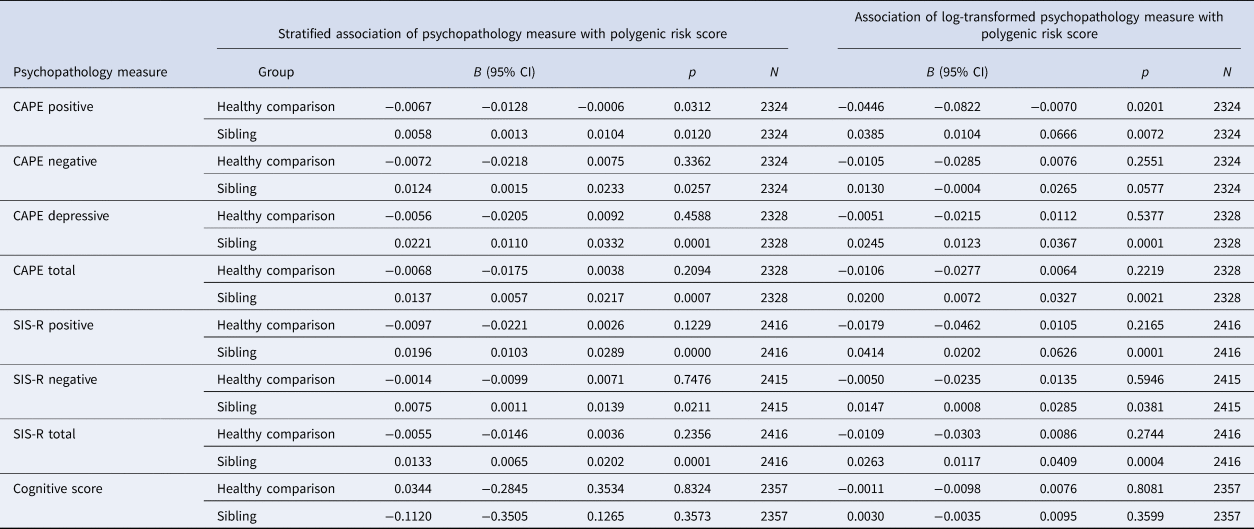
Re-analysis of the GROUP discovery sample, using repeated measures of CAPE, SIS-R and cognitive score (calculated so as to match the cognitive score in the EUGEI study) in 985 healthy participants and siblings of patients (n = 336 healthy comparison participants and n = 649 siblings), interviewed three times in 6 years, yielding 2416 observations, revealed results that were similar in terms of direction, effect size and pattern of associations, to the current EUGEI study (Tables 7 and 8). Thus, again with the exception of cognitive score, there were significant interactions for the majority of psychopathological measures indicating no, or weakly negative association in the healthy participant group and significant associations in the sibling group (Tables 7 and 8). There was no association between cognitive score and PRS, and only in the sibling group was the association with cognitive score in the same (negative) direction as in the EUGEI replication sample (Tables 7 and 8).
Genetic Risk and Outcome of Psychosis (GROUP) sample: associations between polygenic risk score and CAPE/SIS-R/cognitive scores, and interaction with healthy comparison-sibling status

B, regression coefficient from multilevel model; 95% CI, 95% confidence interval; p, p value; N, number of observations in 985 individuals interviewed three times in 6 years.
a Log-transformed measure.
Genetic Risk and Outcome of Psychosis (GROUP) sample: associations between polygenic risk score and measures of psychopathology, by groupa

B, regression coefficient from multilevel model; 95% CI, 95% confidence interval; p, p value; N, number of observations in 985 individuals interviewed three times in 6 years.
a As derived from linear combination of terms in the model with the interaction.
Discussion
In a replication study, using similar sampling and methodological strategies across samples, we found that polygenic risk for schizophrenia was associated with intermediate phenotype measures of psychopathology in non-ill participants. However, the pattern of association was differential for groups at average and higher than average genetic risk, showing stronger and directionally dissimilar associations in the sibling group compared to the healthy comparison group. A similar pattern of differential association was present for a measure of cognitive bias (jumping to conclusions). For a measure indexing cognitive ability, the EUGEI replication sample but not the GROUP discovery sample showed non-significant associations in both the sibling and the healthy comparison group, with no suggestion of interaction.
The EUGEI replication findings thus match the results in the GROUP discovery sample (van Os et al., Reference van Os, van der Steen, Islam, Guloksuz, Rutten, Simons and Investigators2017), re-analysed to match the methods of genetic examination in the EUGEI replication sample. We conclude that when using similar instruments and genetic measures, associations between polygenic risk score and psychosis intermediate phenotypes can be reliably replicated from one sample to another, in that associations are readily detectable in the group at higher than average genetic risk, but not, or inversely, in the group at average genetic risk. Overall, the findings suggest, with the exception of the measure of neurocognition, a pattern of qualitative interaction: associations between PRS and psychosis intermediate phenotypes tend to be positive in relatives of patients (PRS predicting poorer outcome) and negative in healthy comparison participants (PRS predicting better outcome).
Polygenic risk and measures of psychopathology and cognition
As far as we are aware, there have been no previous studies differentially examining polygenic risk in individuals at higher than average genetic risk in relation to psychopathology and cognition intermediate phenotypes. Studies in healthy participants have shown inconsistent results (Hatzimanolis et al., Reference Hatzimanolis, Bhatnagar, Moes, Wang, Roussos, Bitsios, Stefanis, Pulver, Arking, Smyrnis, Stefanis and Avramopoulos2015; Jones et al., Reference Jones, Stergiakouli, Tansey, Hubbard, Heron, Cannon, Holmans, Lewis, Linden, Jones, Davey Smith, O'Donovan, Owen, Walters and Zammit2016; Mistry et al., Reference Mistry, Harrison, Smith, Escott-Price and Zammit2017; Nivard et al., Reference Nivard, Gage, Hottenga, van Beijsterveldt, Abdellaoui, Bartels, Baselmans, Ligthart, Pourcain, Boomsma, Munafo and Middeldorp2017; Riglin et al., Reference Riglin, Collishaw, Richards, Thapar, Maughan, O'Donovan and Thapar2017; Hatzimanolis et al., Reference Hatzimanolis, Avramopoulos, Arking, Moes, Bhatnagar, Lencz, Malhotra, Giakoumaki, Roussos, Smyrnis, Bitsios and Stefanis2018), one study notably reporting negative associations between polygenic risk and schizotypy, similar to the current results (Hatzimanolis et al., Reference Hatzimanolis, Avramopoulos, Arking, Moes, Bhatnagar, Lencz, Malhotra, Giakoumaki, Roussos, Smyrnis, Bitsios and Stefanis2018). Another recent general population study found a protective effect of PRS in that PRS predicted greater levels of positive affect in daily life (Pries et al., Reference Pries, Klingenberg, Menne-Lothmann, Decoster, van Winkel, Collip, Delespaul, De Hert, Derom, Thiery, Jacobs, Wichers, Cinar, Lin, Luykx, Rutten, van Os and Guloksuz2019). It is likely that crucial variation may be occasioned by type of platform for genetic analysis and type of calculation of polygenic risk score. Other factors may include quality checking of GWAS and variation in sampling, instruments and analysis. The results suggest that linking intermediate phenotypes to molecular measures of risk can be reliably achieved in moderately large samples of individuals at higher than average genetic risk. According to the liability-threshold model, a person with a number of risk variants lower than or equal to the critical threshold would not develop schizophrenia, whereas a person with more risk variants would (McGue et al., Reference McGue, Gottesman and Rao1983). Given genetic enrichment in the relatives, this model may explain why polygenic risk was associated with psychometric and cognitive bias intermediate phenotypes in the relatives, but not in the healthy comparison participants. The current findings also indicate that self-report measures function less well than interview-based measures in uncovering associations between psychometric measures and polygenic risk for schizophrenia. Indeed, the findings suggest that siblings in the EUGEI replication sample showed a degree of defensive answering on the CAPE positive dimensions, scoring lower than the healthy comparison participants (Table 3), which was not the case in the discovery sample (van Os et al., Reference van Os, van der Steen, Islam, Guloksuz, Rutten, Simons and Investigators2017).
The positive association between polygenic risk and the jumping to conclusion bias confirms previous results of familial clustering with psychosis (Van Dael et al., Reference Van Dael, Versmissen, Janssen, Myin-Germeys, van Os and Krabbendam2006). This result suggests that genetic variation may impact psychopathology by moderating underlying styles of thinking which are thought to interact with underlying biological mechanisms in creating clinically relevant psychotic symptoms (Howes and Murray, Reference Howes and Murray2014).
Qualitative interactions
The results suggest that the degree of endophenotypic expression of polygenic molecular genetic risk crucially depends on having a first-degree relative with psychotic disorder, i.e. of having higher than average genetic risk for psychotic disorder. In the absence of a sibling with psychotic disorder, expression of polygenic risk may even be protective against expression of psychosis proneness, as also reported by other groups (Hatzimanolis et al., Reference Hatzimanolis, Avramopoulos, Arking, Moes, Bhatnagar, Lencz, Malhotra, Giakoumaki, Roussos, Smyrnis, Bitsios and Stefanis2018; Pries et al., Reference Pries, Klingenberg, Menne-Lothmann, Decoster, van Winkel, Collip, Delespaul, De Hert, Derom, Thiery, Jacobs, Wichers, Cinar, Lin, Luykx, Rutten, van Os and Guloksuz2019). The notion of schizophrenia genetic risk having advantage may explain why all humans are carriers of a rich variety of schizophrenia genetic risk variants (Kendler, Reference Kendler2015) that, in addition, in the rare instances where it has been examined, may, for example, contribute to abilities required for a creative profession (Power et al., Reference Power, Steinberg, Bjornsdottir, Rietveld, Abdellaoui, Nivard, Johannesson, Galesloot, Hottenga, Willemsen, Cesarini, Benjamin, Magnusson, Ullen, Tiemeier, Hofman, van Rooij, Walters, Sigurdsson, Thorgeirsson, Ingason, Helgason, Kong, Kiemeney, Koellinger, Boomsma, Gudbjartsson, Stefansson and Stefansson2015). If polygenic risk for schizophrenia reduces the likelihood of schizophrenia-related intermediate phenotypes in non-ill people, siblings should display even lower levels of expression of these intermediate phenotypes, which, however, was not the case. One factor that may explain the differential association as a function of the familial presence of psychotic disorder is the environment. Thus, the siblings growing up with a brother or sister diagnosed with psychotic disorder have a higher rate of exposure to known proxy environmental risk factors such as urban environment and ethnic group – which are almost always shared between siblings, but also to risk factors like cannabis use and childhood adversity (Smith et al., Reference Smith, Barch, Wolf, Mamah and Csernansky2008; Heins et al., Reference Heins, Simons, Lataster, Pfeifer, Versmissen, Lardinois, Marcelis, Delespaul, Krabbendam, van Os and Myin-Germeys2011). Although presence of family history is generally taken as an indicator of increased genetic risk, research suggests that molecular measures of polygenic risk explain only around a fifth of the effect of family history, suggesting a substantial part may be explained by epistasis and/or environmental effects and the interactions between genes and environment (Agerbo et al., Reference Agerbo, Sullivan, Vilhjalmsson, Pedersen, Mors, Borglum, Hougaard, Hollegaard, Meier, Mattheisen, Ripke, Wray and Mortensen2015). Schizophrenia may be in part dependent on gene–environment interplay, amongst others in the form of differential sensitivity to environmental risks (van Os et al., Reference van Os, Kenis and Rutten2010), as indeed was shown in a recent analysis of the same EUGEI sample (Guloksuz et al., Reference Guloksuz, Pries, Delespaul, Kenis, Luykx, Lin, Richards, Akdede, Binbay, Altinyazar, Yalincetin, Gumus-Akay, Cihan, Soygur, Ulas, Cankurtaran, Kaymak, Mihaljevic, Petrovic, Mirjanic, Bernardo, Cabrera, Bobes, Saiz, Garcia-Portilla, Sanjuan, Aguilar, Santos, Jimenez-Lopez, Arrojo, Carracedo, Lopez, Gonzalez-Penas, Parellada, Maric, Atbasog Lu, Ucok, Alptekin, Saka, Genetic, Arango, O'Donovan, Rutten and van Os2019). Thus, siblings may have higher rates of expression of psychosis intermediate phenotypes not because of higher levels of genetic risk, but because of genetic risk interacting with higher rates of exposure to environmental risks in this group. Another possibility, not mutually exclusive with gene–environment interplay, is that siblings share gene–gene interactions with their ill relatives that are uncommon in healthy controls, producing a qualitatively different pattern of association with intermediate phenotypes.
Cognitive ability and lack of association and qualitative interaction
Cognitive ability was the only measure where there was no clear pattern of association or qualitative interaction in both samples. Results in the largest sample showed weak and directionally similar negative associations between schizophrenia polygenic risk and cognition in both the healthy comparison and the sibling group. These findings are in line with previous population-based work showing similar weak negative associations between schizophrenia polygenic risk and measures of cognition, indicative of shared common genetic factors between schizophrenia and cognitive ability (Lencz et al., Reference Lencz, Knowles, Davies, Guha, Liewald, Starr, Djurovic, Melle, Sundet, Christoforou, Reinvang, Mukherjee, DeRosse, Lundervold, Steen, John, Espeseth, Raikkonen, Widen, Palotie, Eriksson, Giegling, Konte, Ikeda, Roussos, Giakoumaki, Burdick, Payton, Ollier, Horan, Donohoe, Morris, Corvin, Gill, Pendleton, Iwata, Darvasi, Bitsios, Rujescu, Lahti, Hellard, Keller, Andreassen, Deary, Glahn and Malhotra2014; Hubbard et al., Reference Hubbard, Tansey, Rai, Jones, Ripke, Chambert, Moran, McCarroll, Linden, Owen, O'Donovan, Walters and Zammit2016). One explanation for the observed contrast in qualitative interaction between cognitive and non-cognitive intermediate phenotypes is prognostic confounding, or the fact that variation in cognition as observed in schizophrenia may represent a ‘prognostic’ rather than a ‘disease’ factor. It has been pointed out that schizophrenia represents the poor outcome fraction of a much broader psychosis phenotype (Guloksuz and van Os, Reference Guloksuz and van Os2018). One of the factors driving prognostic variation in the psychosis spectrum is the degree of comorbid cognitive alterations. If the poor outcome end of the spectrum is defined as a separate disease, of which cognitive alteration is considered a key characteristic, prognostic confounding will arise. In other words, psychosis spectrum disorder may have a poorer outcome when it occurs in people who are at the lower end of the distribution of cognitive ability in the general population. This will occasion an association between schizophrenia genetic risk and cognition if the disease phenotype is conflated with the prognostic characteristic. As a result, schizophrenia genetic risk will predict lower cognitive ability in the general population – but to a similar degree in controls and siblings of patients. This interpretation is in line with recent work indicating that cognition in patients with schizophrenia is more strongly associated with polygenic risk that indexes cognitive traits in the general population than polygenic risk from mental disorders (Richards et al., Reference Richards, Pardinas, Frizzati, Tansey, Lynham, Holmans, Legge, Savage, Agartz, Andreassen, Blokland, Corvin, Cosgrove, Degenhardt, Djurovic, Espeseth, Ferraro, Gayer-Anderson, Giegling, van Haren, Hartmann, Hubert, Jonsson, Konte, Lennertz, Olde Loohuis, Melle, Morgan, Morris, Murray, Nyman, Ophoff, Investigators, van Os, Group, Petryshen, Quattrone, Rietschel, Rujescu, Rutten, Streit, Strohmaier, Sullivan, Sundet, Wagner, Escott-Price, Owen, Donohoe, O'Donovan and Walters2019).
Methodological issues
The strength of the current study is twofold: within-report true replication and unique large samples of individuals at higher-than-average risk. We controlled for potential weaknesses such as the use of a multi-country sample with possible residual underlying population stratification. Future research may include more objective physiological intermediate phenotypes such as EEG or MRI-based measures. A limitation is that the current study lacked statistical power to conduct genome-wide analyses of association with endophenotypic measures, which would have allowed for GWAS stratified by sibling status as a confirmatory strategy.
Acknowledgements
We thank the patients and their families for participating in the EUGEI project. Furthermore, we would like to thank all research personnel involved in the GROUP project, in particular: Joyce van Baaren, Erwin Veermans, Ger Driessen, Truda Driesen, Erna van ’t Hag and Jessica de Nijs.
Conflict of interest
The authors declare no conflict of interest.
Financial support
The European Network of National Schizophrenia Networks Studying Gene–Environment Interactions (EUGEI) Project is funded by grant agreement HEALTH-F2-2010-241909 (Project EUGEI) from the European Community's Seventh Framework Programme. All the DNA samples from Turkey were provided by Ankara University Brain Research Center Biobank that was supported by AUBAPRO (10A6055003).