INTRODUCTION
Audience evaluations of news media are important in a complex political system. Given that members of the public primarily learn about politics via mass media—the news and information they convey—the credibility and legitimacy of news media are of utmost importance. Mainstream news outlets in the U.S. are a convenient target for charges of ideological bias and error (e.g., Goldberg Reference Goldberg2002; Herman and Chomsky Reference Herman and Chomsky1998). On the surface, it may seem odd that mainstream news organizations are tagged as partisan, because they strive for journalistic balance and remove. Unfortunately, two forces conspire to undermine their reputations as nonpartisan arbiters of politics. At the systemic level, the increasingly polarized political environment gives politicians an incentive to attack the press when it fails to report reality in ways that are consistent with their political agenda (Ladd Reference Ladd2012). Politicians get a helping hand at the psychological level, since members of their partisan bases tend to see the political world in “black” or “white” terms, leading them to “complain about the fairness and objectivity of mediated accounts that suggest that the truth might be at some particular hue of gray” (Vallone, Ross and Lepper Reference Vallone, Ross and Lepper1985, 584). Partisans are predisposed to perceive standard journalistic news balance as hostile toward their side for a simple reason. If the mainstream news media are not with you, they must be against you.
Over 30 years ago, when the hostile media phenomenon was articulated, mainstream news outlets were the primary sources of political information available on television. Today, broadcast news networks compete alongside partisan newscasts on cable and satellite television as well as the Internet. The emergence of partisan news options opens new possibilities for the evaluation of journalism. The availability of likeminded news sources allows people to selectively receive news that validates their viewpoint, burnishing their view of the news media—a friendly media phenomenon (Goldman and Mutz Reference Goldman and Mutz2011)—while exposure to partisan news opposed to one’s worldview engenders oppositional news hostility (Arceneaux, Johnson and Murphy Reference Arceneaux, Johnson and Murphy2012; Coe et al. Reference Coe, Tewksbury, Bond, Drogos, Porter and Zhang2008). These studies underscore that media perceptions are driven by people’s preferences as well as the importance of studying the effects of partisan news media, which may exacerbate political polarization (Sunstein Reference Sunstein2009). Political communication scholars have mostly focused on how partisan preferences shape people’s reactions to news media content (e.g., Feldman Reference Feldman2011; Levendusky Reference Levendusky2013; Stroud Reference Stroud2011). However, the transformation of the media landscape over the past two decades has more to do with the expansion of entertainment choices than the rise of partisan news (Prior Reference Prior2007). We contend that the new media landscape complicates the traditional understanding of the hostile media phenomenon.
More choices mean more sorting. News junkies can watch news every waking moment if they wish. With well over 100 channels, people can curate their television viewing in line with their abiding interests, whether they are sports fanatics, history buffs, movie lovers, gossip obsessed, and so on. The proliferation of options and the presence of preference-based media selectivity make it increasingly important that we understand how different types of news media have different effects on different types of viewers. Not all news seekers are the same. While some individuals gravitate toward partisan options, broadcast news shows continue to attract the largest audiences for news.Footnote 1 Because the population of news seekers is heterogeneous, we doubt that either mainstream or partisan news shows have homogenous effects on news audiences. Moreover, entertainment seekers play a potentially crucial role in reshaping our understanding of the hostile media phenomenon. The current media environment enables entertainment seekers to minimize their exposure to news, of any variety, which serves to limit the reach of the news and the potency of its effects (Bennett and Iyengar Reference Bennett and Iyengar2008). At the same time, entertainment seekers can also tip the scales should they seek out news (e.g., in response to a culturally significant event) or, perhaps more likely, when they are inadvertently exposed to it — e.g., in waiting rooms and during major breaking news events that intrude on entertainment programming (Arceneaux and Johnson Reference Arceneaux and Johnson2013).
We draw on the Active Audience Theory, as refined in our previous work (Arceneaux and Johnson Reference Arceneaux and Johnson2013), to identify three hypotheses about the differential effects of news exposure on hostile media perceptions (see Appendix for details). First, because partisan news-seekers are ideologically motivated (Stroud Reference Stroud2008), we expect to observe a friendly media effect among them, while we do not expect to observe such an effect among mainstream news-seekers (Conditional Friendly Media Effect Hypothesis). If the mainstream news reports on politics in shades of gray, proattitudinal news shows tell partisans the world is their preferred shade, while mainstream news does the opposite. Mainstream news-seekers, however, are likely to find the antics of opinionated hosts on partisan cable news more off-putting than the ideological benefit they may receive from proattitudinal shows. Second, we expect a distaste for counterattitudinal news to unite partisan news-seekers, mainstream news-seekers, and entertainment-seekers (Oppositional Media Effect Hypothesis). Oppositional shows key into intergroup psychology, activate outgroup threat, and motivate individuals to resist attacks on their ingroup (Arceneaux, Johnson and Cryderman Reference Arceneaux, Johnson and Cryderman2013). Third, because the politically disinclined tend to be more susceptible to the media’s potential effects (Zaller Reference Zaller1992) as well as find politics both distasteful and hostile (Hibbing and Theiss-Morse Reference Hibbing and Morse2002), we expect that entertainment-seekers, relative to partisan and mainstream news-seekers, will evince stronger negative reactions to all news shows (Entertainment-seeker Susceptibility Hypothesis).
Evaluating these hypotheses requires that we take two important departures from the standard approach to studying hostile media effects. First, we need to take into account people’s viewing predispositions. Second, we are not simply interested in how different people respond to the same news reports. Studying different reactions to the same content was more appropriate during the broadcast era, dominated by purportedly objective mainstream television news. Given the expansion of choice in television news, we are primarily interested in how people respond to different sources of political information, taking into account both individual differences over goals for media use and partisan orientations. We accomplish these objectives by employing an experimental design that has, until recently, been underutilized in the study of media effects.
THE PARTICIPANT PREFERENCE EXPERIMENT
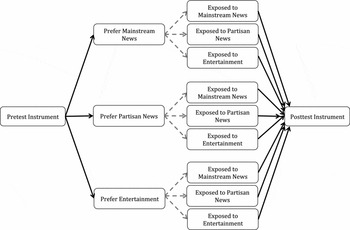
Studying selectivity in an experimental setting is challenging, because it frustrates randomization. How can we maintain the internal validity afforded by random assignment, while also gauging the influence of the choices people make? The participant preference experiment offers a solution (for a full discussion see Arceneaux and Johnson Reference Arceneaux and Johnson2013, Chapter 3). Developed in medical research on therapeutic drugs (Macias et al. Reference Macias, Gold, Hargreaves, Aronson, Bickman, Barreira, Jones, Rodican and Fisher2009; Torgerson and Sibbald Reference Torgerson and Sibbald1998), the participant preference experiment measures participants’ preferences over the experimental stimuli before administering the treatment.Footnote 2 The schematic in Figure 1 shows the basic design.
Basic Design of the Participant Preference Experiment
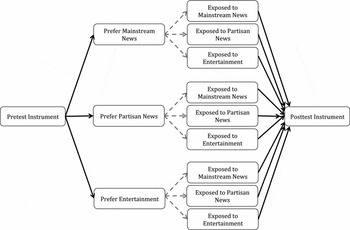
The key feature of the participant preference design is that the we measure preferences for the partisan news, mainstream news, or entertainment program before administering the treatment so that expressed preferences are not contaminated by idiosyncratic elements of the stimuli (e.g., show topic). With a priori measures of viewing preferences, we can estimate the effects of news content separately for partisan news-seekers, mainstream news-seekers, and entertainment-seekers. By controlling actual participant exposure to news media, we avoid much of the measurement error that arises when researchers ask participants to report their exposure to media (e.g., Tewksbury, Althaus and Hibbing Reference Tewksbury, Althaus and Hibbing2011). Separately measuring preferences for news and entertainment programming allows us to disentangle predispositions and exposure.
STUDY 1
Participants
We recruited 124 participants for a study on “information processing” October 25–December 2, 2011. Participants were undergraduate students in a general education social science course at the University of California, Riverside, and the study took place at the Media & Communication Research Lab. The sample reflects a diverse undergraduate population: young (M age = 19.4), mostly non-white (36.3 percent Latino, 28.2 percent Asian, 13.7 percent white, 8.9 percent black, and 12.9 percent “other”), 52.4 percent female, and predominately middle class (median family income between $35,000 and $50,000). With respect to political ideology, 42.7 percent identified as liberal and 27.4 percent as conservative.
Procedures
Participants entered the lab, signed in, and were asked to take a survey concerning their media preferences, political attitudes, and demographics. After completing the pretest, participants were randomly assigned to one of four treatments, exposure to: (1) to a proattitudinal partisan talk show on a cable news network (Fox News for conservatives and MSNBC for liberals), (2) a counterattitudinal partisan talk show (Fox News for liberals and MSNBC for conservatives), (3) a mainstream broadcast news program (CBS), or (4) an entertainment show from a basic cable network. When participants finished watching the assigned program, they were asked to complete a posttest survey that measured their perceptions of the news media.Footnote 3
Participants viewed one of five stimuli, which included three news programs and two entertainment shows, for just over seven minutes (7:20). Subjects in the control group were randomly assigned one of the entertainment options, either a segment from For Rent (HGTV), which features people searching for an apartment, or an animal talent show Pet Star (Animal Planet). The news shows each originally aired October 19, 2011 and featured coverage of the Western Republican Presidential Debate in Las Vegas, Nevada, the previous evening. The Republican nomination race was prominent in each news program, The CBS Evening News with Scott Pelley, The Rachel Maddow Show (MSNBC), and Sean Hannity’s talk show on Fox News, as was the issue of immigration, the topic of an exchange between former Massachusetts Gov. Mitt Romney and Gov. Rick Perry of Texas during the debate.
The CBS, MSNBC, and Fox News stimuli had similarities and differences reflective of the traits of mainstream and opinionated news programs. All three shows featured a discussion of the exchange between Romney and Perry, U.S. immigration policy, and the Occupy Wall Street movement. The Hannity clip from Fox News included an extended segment featuring a Republican pollster interviewing GOP voters about the debate. The MSNBC Maddow clip featured the host critiquing Republican presidential candidates. Due to the abbreviated length of news stories on The CBS Evening News, this clip’s viewers saw coverage of several stories in addition to the debate.
Measures
We measured media viewing preferences early in the pretest instrument with this item:
Imagine you had a choice among these specific television shows. Please rank them based on how much you would like to watch them, with your most preferred show at the top and your least preferred show at the bottom. If you do not recognize the show, try to make a decision based on its name or network.
Participants were given five options identical to the stimuli: The Rachel Maddow Show (MSNBC News Channel), The Sean Hannity Show (Fox News Channel), The CBS Evening News with Scott Pelley, For Rent (HGTV), and Pet Star (Animal Planet), with the options randomized for participants. Those who selected Maddow or Hannity were coded as partisan news-seekers; those who selected CBS News were coded as mainstream news-seekers; and those who selected For Rent or Pet Star were coded as entertainment-seekers.Footnote 4 After this question, participants were asked two additional ranking questions that had a similar format with the purpose of minimizing demand effects. Before being exposed to the stimuli, participants answered dozens of additional questions about their political attitudes and demographic characteristics in part to minimize the risk of interaction effects (Campbell and Stanley Reference Campbell and Stanley1963). In this sample, 25.8 percent ranked mainstream news first, 20.2 percent ranked partisan news first, and 54 percent ranked entertainment first.
We measured participants reactions to the media content using a semantic differential task in which they were given word pairs on the opposite ends of a continuum and asked to select which word best described the show they just watched. The word pair that tapped hostile media perceptions was fair/unfair. This exercise generated a 9-point scale where 1 indicates that “fair” best described the show and a 9 indicates that “unfair” best described the show.
Findings
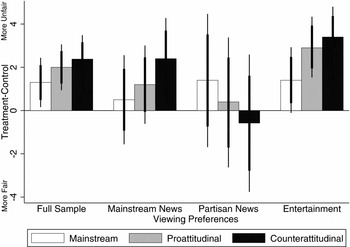
As a manipulation check, we asked participants to rate the shows on a 9-point scale that ranged from liberal (1) to conservative (9). Subjects placed the MSNBC show on the left (M = 4.26), the Fox News show on the right (M = 5.81), and the CBS program in the middle (M = 5.19).Footnote 5 The empirical results are shown in Figure 2. The bars represent differences between each of the treatments and the control group (entertainment shows) and the vertical lines denote confidence intervals. We include two confidence intervals. The 95 percent confidence interval (thin vertical line) indicates whether the treatment effect is different from zero at the 0.05 level (two-tailed test), and the 83.5 percent confidence interval allows one to use overlap in confidence intervals to test whether the difference between two treatment effects is statistically different from zero at the 0.05 level (two-tailed test).Footnote 6 The full sample results average the effects of news exposure across news- and entertainment-seekers. On average, people were more likely to see all news shows as more “unfair” than entertainment shows (mainstream news, p = 0.013, one-tailed; proattitudinal and counterattitudinal news, p < 0.001). In the full sample, we do not find evidence that people perceived proattitudinal news to be more fair than mainstream news (contrary to the friendly media effect hypothesis), but subjects did view counterattitudinal news as less fair than mainstream news (consistent with oppositional hostility effect hypothesis, p = 0.03).
The Effects of News Programs on Reactions to Media Content, Study 1
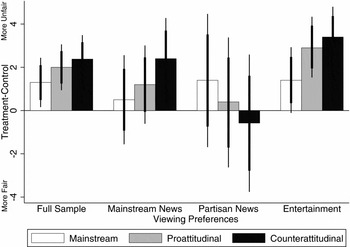
Next we recruit the participant preference design to test our hypotheses by decomposing treatment effects by people’s a priori viewing preferences. We find only suggestive evidence for our expectation that positive reactions to proattitudinal news are isolated among partisan news-seekers (Conditional Friendly Media Effect Hypothesis). It is the case that mainstream news-seekers do not reliably see proattitudinal news as more fair than mainstream news (p = 0.472), while partisan news-seekers tend to rate proattitudinal news as more fair than mainstream news shows, but the effect among partisan news-seekers is not statistically significant (p = 0.208, one-tailed). We also cannot say with confidence that the partisan news-seekers are reliably different from mainstream news-seekers in how they rate proattitudinal vis-à-vis mainstream news (p = 0.133, one-tailed).
We find more evidence for the prediction that everyone rates counterattitudinal shows negatively (Oppositional Media Effect Hypothesis). Both mainstream news-seekers and entertainment-seekers rated counterattitudinal programming as less fair than mainstream news (p = 0.037 and 0.007, respectively, one-tailed). Mainstream news-seekers reliably rated counter-attitudinal news as more unfair than proattitudinal news (p = 0.097, one-tailed), while entertainment-seekers did not (p = 0.28, one-tailed). We do not find an oppositional hostility effect among partisan news-seekers. These viewers did not distinguish between counterattitudinal and other forms of news.
Finally, we find that entertainment-seekers react more negatively to news programming than news-seekers (consistent with the Entertainment-seeker Susceptibility Hypothesis). Relative to partisan and mainstream news-seekers, entertainment-seekers tend to view proattitudinal news as more hostile (p = 0.042 and 0.08, respectively, one-tailed). However, entertainment-seekers do not appear to rate mainstream news differently than partisan and mainstream news-seekers.
These data provide qualified support for our hypotheses. Although viewing preferences shape how people respond to news programming, the pattern of results are not as crisp as our theoretical framework predicts. Before we draw broad conclusions from these findings, it is important to consider the limitations of this study. It is small (n = 124), which increases the size of the standard errors and makes it difficult to detect treatment effects. The fact that we had to assign self-identified moderates to proattitudinal and counterattitudinal conditions likely compounds this problem. We relied on a narrow sample of college students, who may react to media content differently than the broader population. Further, the news shows focused on the same news stories, but approached them in different ways with different sound bites and guests. We cannot rule out that these differences in the stimuli may have interacted with viewing preferences. We attempt to address many of these limitations in Study 2.
STUDY 2
Participants
We recruited 843 participants for a “general attitudes survey” July 6–29, 2013, from the Amazon.com Mechanical Turk on-line labor market. Mechanical Turk is increasingly used in experimental research and is capable of generating broader samples than college subject pools, if still specialized Berinsky, Huber and Lenz (Reference Berinsky, Huber and Lenz2012). The sample for Study 2 is certainly broader than the sample in Study 1 with respect to age (M age = 33.7, range 18 to 84). The racial breakdown is closer to the national distribution, although not as representative as a random sample would be (74.6 percent white, 9.7 percent black, 4.5 percent Latino, 7.7 percent Asian, and 3.5 percent “other”). The sample was balanced in terms of gender (54 percent female) and was predominately middle class (median family income between $35,000 and $50,000). With respect to political ideology, 67.2 percent identified as liberal and 32.7 percent as conservative. Unlike Study 1, subjects were not given a “moderate” option on the self-identified ideology question, forcing them to indicate whether they lean conservative or liberal. This obviated the need to decipher whether to treat moderates as liberals or conservatives when assigning them to pro- or counterattitudinal news.
Procedures
The procedures for Study 2 were similar to Study 1. Subjects who agreed to participate in the study completed a pre-test questionnaire that asked questions about their political ideology, viewing preferences, and other attitudes. Next, subjects were randomly assigned to one of four experimental conditions, exposure to: (1) a proattitudinal partisan talk show from a cable news network, (2) a counterattitudinal talk show, (3) mainstream broadcast news, or (4) an entertainment show. When participants finished watching the assigned program, they were asked to complete a post-test survey that measured their perceptions of the news media.
The news and entertainment clips had a shorter duration than in Study 1 (approximately 2:30 each). Participants in the control group were randomly assigned to which one of the entertainment options, either For Rent or Pet Star. The news shows each originally aired June 4, 2013 and featured coverage of Congressional hearings on the Internal Revenue Service’s investigation of applications of Tea Party organizations for tax-exempt status. We included clips from The Last Word with Lawrence O’Donnell (MSNBC), The O’Reilly Factor, and The CBS Evening News. The O’Reilly clip from Fox News characterized the investigation of these groups as “something that ought not occur certainly in this country.” MSNBC host O’Donnell characterized the Congressional hearings themselves as the real scandal, while the CBS News news clip featured no partisan invective other than the Tea Party organization leaders’ allegations of their mistreatment.
Measures
We measured participants’ viewing preferences using the question wording from Study 1, with a revised list of programs.Footnote 7 In line with Study 1, 25.5 percent ranked mainstream news first, 20.5 percent ranked partisan news first, and 54 percent ranked entertainment first. We measured reactions to media content using the semantic differential protocol used in Study 1, but in addition to fair/unfair, we included the word pairs friendly/hostile and fact/opinion using 9-point scales to measure judgments about the clips participants viewed.
Findings
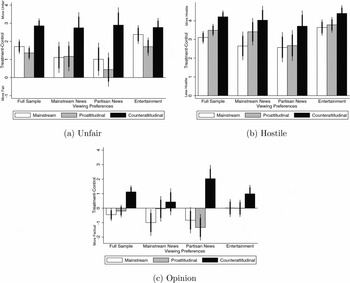
In the manipulation check, subjects placed the MSNBC show on the left (M = 4.33), the Fox News show on the right (M = 7.03), and CBS news in the middle (M = 5.31).Footnote 8 The empirical results are shown in Figure 3. On average, people were more likely to see all news shows as more “unfair” than entertainment shows (mainstream news, p = 0.013, one-tailed; proattitudinal and counterattitudinal news, p < 0.001). In the full sample, we now find that participants rated the proattitudinal news program as fairer than the mainstream news program, consistent with the friendly media effect hypothesis (p = 0.037). Interestingly, though, subjects did not judge proattitudinal news to be less hostile or more factual than mainstream news (p = N.S.). In line with the oppositional hostility effect hypothesis, subjects rated the counterattitudinal program more negatively than both mainstream and proattitudinal news (p < 0.001 for all three items).
The Effects of News Programs on Reactions to Media Content, Study 2
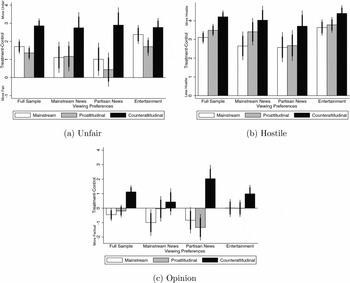
In the subgroup analyses, we find weak support for the prediction that mainstream and partisan news-seekers respond differently to proattitudinal news (Conditional Friendly Media Effect Hypothesis). Consistent with the hypothesis, mainstream news-seekers do not rate proattitudinal news less negatively than mainstream news and actually rate it more negatively, while partisan news-seekers rate proattitudinal news more positively than they do mainstream news. Yet the effect among partisan news-seekers is not statistically significant. Nonetheless, we can confidently conclude that partisan news-seekers and mainstream news-seekers rate partisan and mainstream news differently (i.e., viewing preference interacts with the mainstream and proattitudinal news treatments).
We find that people react negatively to counterattitudinal programming (consistent with the Oppositional Media Effect Hypothesis). Partisan news-seekers rate counterattitudinal news as less fair, more hostile, and less factual than they do either proattitudinal news or mainstream news (p < 0.05). Mainstream news-seekers rate counterattitudinal news as less fair, more hostile, and less friendly than they do mainstream news (p < 0.01). They also see counterattitudinal news as less fair and more hostile than they do proattitudinal news (p < 0.05), but intriguingly, they view both proattitudinal and counterattitudinal news as equally opinionated (p = 0.246). Entertainment-seekers view counterattitudinal news as more negative than both proattitudinal and mainstream news (p < 0.01 for all items except unfair, p < 0.10). Finally, we find that entertainment-seekers rate news content, partisan or mainstream, as less fair and more hostile than news-seekers do (consistent with the Entertainment-seeker Susceptibility Hypothesis).
DISCUSSION
This paper builds upon recent work on selective exposure to consider how the expansion of choices on television influences the evaluation of mainstream and partisan news programming, guided by a new Active Audience Theory. Central to this theory is a motivational model of selective exposure that conceptualizes media preferences as a function of defensive and hedonic motivations. The model predicts that media preferences shape the reactions to mainstream and partisan news. In addition, we offer an innovative experimental design—the participant preference design—to circumvent challenges to causal inference in the face of selectivity.
On the whole, the evidence from Study 1 and Study 2 converge.Footnote 9 We find suggestive evidence for the Conditional Friendly Media Effect Hypothesis. Partisan news seekers seem to be more friendly to proattitudinal news than mainstream news and mainstream news-seekers tend to be more hostile to proattitudinal news than they are to mainstream news. We find strong evidence for Oppositional Media Effect Hypothesis. Across viewer types, people dislike counterattitudinal news shows. Finally, we demonstrate that entertainment-seekers have stronger negative reactions to news—any news—relative to news-seekers. When the news media give viewers what they seek—journalistic balance for mainstream news-seekers and ideologically tinged discourse for partisan news-seekers—we observe muted hostile media effects.
Entertainment-seekers exhibit stronger negative reactions to mainstream and proattitudinal news than news-seekers do. One implication of our findings is that selectivity coupled with a fragmented media market and abundant choice may actually diminish (although not obviate) the hostile media effect in the aggregate. The current media environment allows most people to watch what they want, when they like. Viewers appear not to be watching news, partisan or otherwise, by accident. We encourage scholars to pay more attention to the ways in which preference-based sorting shapes and constrains the influence of mass media.
SUPPLEMENTARY MATERIALS
To view supplementary material for this article, please visit http://dx.doi.org/10.1017/XPS.2014.10