How much did France pay for its colonial empire? Was the cost of colonization a huge burden on France’s public finances that grew over time and became unsustainable on the eve of decolonization, as argued by French historiography (Marseille Reference Marseille1984)? Was it, on the contrary, a relatively cheap endeavor, as shown by Huillery (Reference Huillery2014) for West Africa? To answer these questions, this paper delves into the French archives to reconstruct the total cost of French colonialism for French taxpayers, distinguishing between military costs and civil subsidies to the colonies. We also reconstruct a partial international balance of payments of the French colonial empire to shed some light on the private and public monetary flows between France and its colonial empire. This paper provides first evidence of the small monetary transfers made by France in its colonial empire, be they public or private.
A large literature in social sciences has already documented the racist character of colonization and its human rights abuses, as well as its long-lasting impacts on the political and economic institutions of formerly colonized countries. This paper aims to contribute to this literature by providing the first quantification of the size and nature of the monetary flows between France and its colonies. This is important because, even excluding the non-monetary costs and long-term consequences of colonization, the question of the cost of European colonization and who financed it is far from being settled. In fact, the amount of archival data needed to reconstruct the full history of expenditure for colonization and related monetary flows, public and private, between the colonizing country and the colonies is considerable, explaining why such an exercise has not yet been completed.
Early critics of colonization in the colonizing country pointed out that the cost of colonization was far larger than its economic benefit. In the United Kingdom, the initial skepticism of Smith (1776) toward colonialism was shared by neo-classical economists like Stanley Jevons and Alfred Marshall (O’Brien Reference O’Brien1988). Then, in his critique of imperialism, Hobson (Reference Hobson1902) argued that the empire enabled the British upper classes to invest their capital abroad rather than at home, hurting British workers. In France, after the conquest of Algeria started in 1830, some prominent economists also expressed criticism of the colonial project, among them Jean-Baptiste Say (Steiner Reference Steiner1996) and Clément Juglar (Parent and Butler Reference Parent and Butler2018). In contrast, two professors at the Collège de France, Michel Chevalier and his son-in-law Paul Leroy-Beaulieu, were influential advocates for colonialization, along with professionals linked to business or politics (Singaravélou Reference Singaravélou2008; Clément Reference Clément2013; Todd Reference Todd2021). The cost of colonial occupation to the taxpayer was one of the main arguments of critics, while advocates would usually weigh high prospects for profits, employment, and development, if only for the metropolitan economy. In the first half of the twentieth century, the colonial empire became a fait accompli in France and the United Kingdom, and the argument that colonialism was too expensive was put on the back burner. However, it made a comeback in the post-WWII period of “developmentalist colonialism,” even among initially pro-colonial conservatives such as the cartiériste movement in France (Cooper Reference Cooper1996).
After the end of the colonial era, important works in economic history tried to produce a cold-minded assessment of the benefits and costs of colonialism. Davis and Huttenback (Reference Davis and Huttenback1986) and O’Brien (Reference O’Brien1988) estimated the flows of capital invested by Britain in its colonial empire, their rates of return, and the fiscal burden of imperial defense for the period before 1914. These authors adopted the Hobsonian view that British colonialism imposed a high tax burden on the average British taxpayer due to the huge military expenditure required to maintain the empire, benefiting the gentry and some London businessmen. This argument was criticized by Kennedy (Reference Kennedy1989) and Offer (Reference Offer1993) on the grounds that the military cost of imperial defense was overstated. Kennedy acknowledged that the cost argument could be more valid in the 1930s, and even more in the 1950s. In any case, both Davis and Huttenback (Reference Davis and Huttenback1986) and O’Brien (Reference O’Brien1988) limited their analyses to the pre-1914 period.
Another branch of the literature equated the trade surpluses of colonies with a “drain” of resources by the metropole. Since the balance of payments of a territory is equal to zero by construction, a trade surplus (more exports than imports) must be balanced by outgoing payments, and vice-versa a trade deficit (more imports than exports) must be balanced by ingoing payments. The first economist to denounce the drain of Indian wealth by the British colonizer was perhaps Naoroji (Reference Naoroji1901). Maddison (Reference Maddison1971) confirmed that India’s balance of trade with the United Kingdom was in structural surplus until independence in 1947. This implied monetary flows from India to Britain during the colonial period, such as civil servant pensions, interest payments, remittances, and capital repatriation. The argument of the colonial drain of India was later reformulated by Habib (Reference Habib1995) and Mukherjee (Reference Mukherjee2010). The analysis of Indonesian balances of payments revealed an even larger colonial drain to the Netherlands (Maddison Reference Maddison1989; van der Eng 1998; Gordon Reference Gordon2018).
Studying the case of the French Empire, Marseille (Reference Marseille1984) found that the trade balance of French colonies was, on the contrary, in structural deficit, which led him to argue that, in return, France made important public and private monetary transfers to the colonies. In his view, the colonial empire thus represented a financial burden for France and delayed the modernization of its economy because the capital invested in the colonies would have been more profitable if invested in France. While the thesis of Marseille has been considered authoritative by many scholars (Bairoch Reference Bairoch1988; Fitzgerald Reference Fitzgerald1988; Dormois and Crouzet Reference Dormois and Crouzet1998; Etemad Reference Etemad2005), the idea that French private investments in the colonies had turned less profitable after WWII was contradicted by Saul (Reference Saul2016) in the North African case. In this paper, we examine Marseille’s argument that the empire was expensive because French colonies received large capital transfers from France.
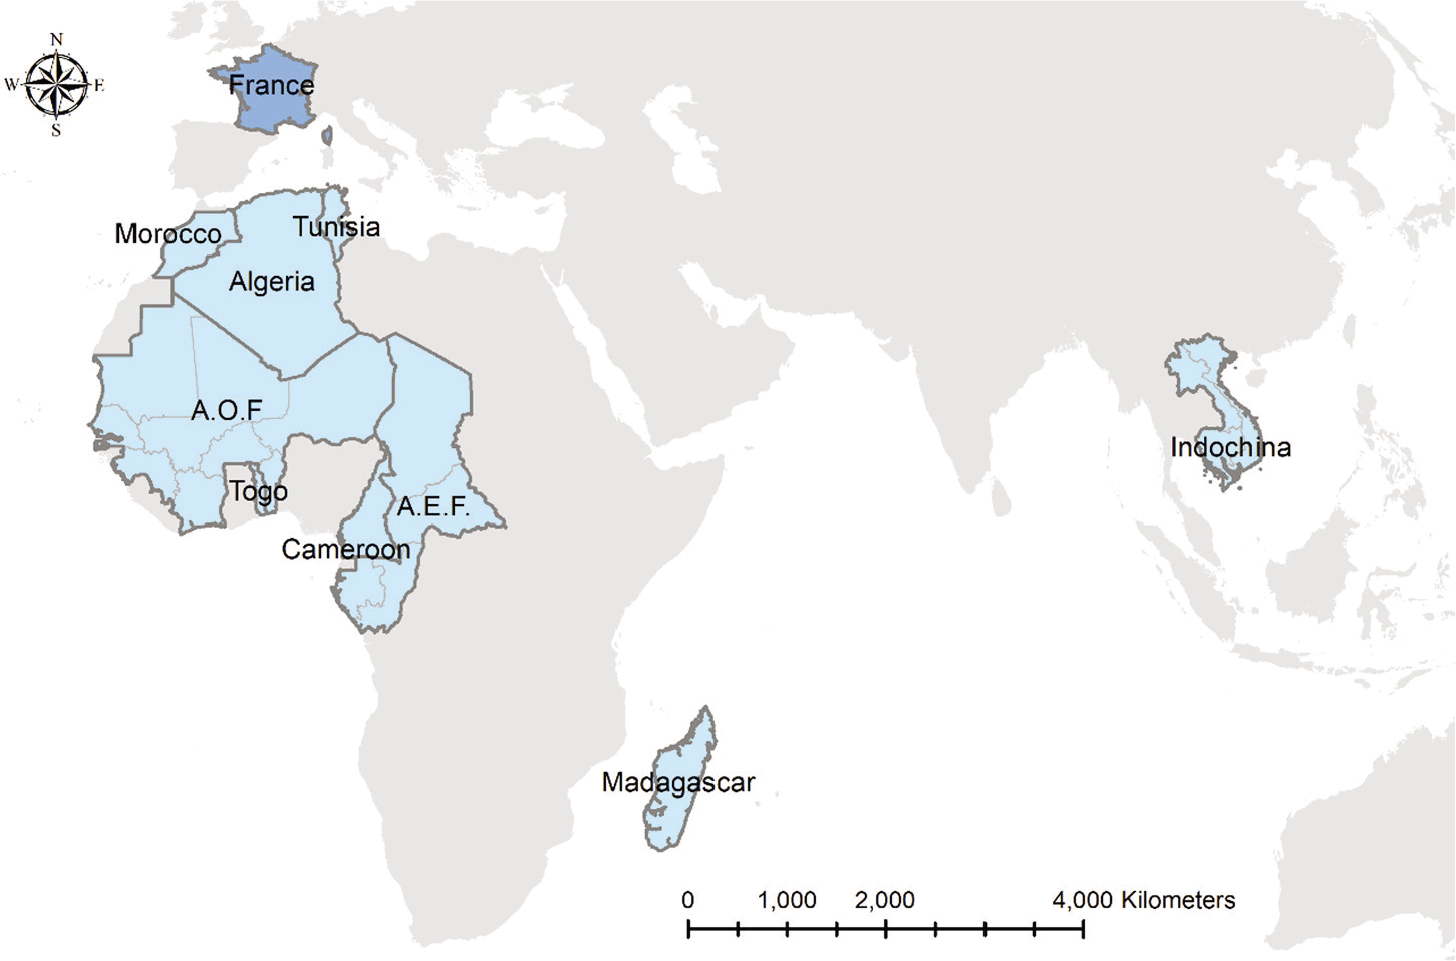
The novelty of this paper is that, rather than using only the balance of trade, we directly collected data on the monetary flows between France and its colonies, both public and private. Huillery (Reference Huillery2014) quantified the public expenditure for French West Africa and found that the cost for France was minimal, as West Africa received very little public aid from France. In this paper, we extend her work in two important ways. First, we study French public expenditure for the whole second French colonial empire between 1830 (beginning of the colonization of Algeria) and 1962 (independence of Algeria). The second French colonial empire included Algeria, Tunisia, Morocco, the federations of French West Africa (Afrique Occidentale Française, hereafter AOF) and of French Equatorial Africa (Afrique Equatoriale Française, hereafter AEF), Togo, Cameroon, Madagascar, and the Indochinese Union (see Figure 1), corresponding to 21 present-day countries.Footnote 1 A few short-lived or small colonies are not included in our analysis, but they represented only a small part of France’s second colonial empire (maximum of 6 percent of the French Empire’s population in 1937).Footnote 2 Second, we collected data on monetary flows other than public expenditure, such as the large loans taken out by the colonies with French lenders, as well as private investments in the colonies through the Paris Stock Exchange. These data allow us to provide new evidence on the monetary flows between France and its colonies and on how the structural trade deficit of French colonies was compensated.
COLONIAL TERRITORIES PRESENT IN OUR DATA
Source: Authors’ illustration.

Our results reveal that French public expenditure in the colonial empire over the period 1833–1962 represented only 1.3 percent of French GDP, 82 percent of which were military expenditure. The public cost of the colonies was disproportionally larger in the last period 1946–1962 (3.2 percent of French GDP) than in earlier periods (0.4 percent in the conquest period 1833–1900, 0.6 percent in the stabilization period 1901–1919, and 0.6 percent in the heyday period 1920–1939), mostly because of the high cost of Indochina and Algeria’s wars of independence. Even when accounting for the debt that may have been forgiven after independence, development aid to the colonies represented only 0.2 percent of French GDP over the period, well below today’s international target of 0.7 percent. Even from the perspective of the colonies, development aid was not an overwhelmingly important resource, representing 1.9 percent of colonial GDP on average, though this varied significantly over time and between countries. In Indochina, Morocco, and Tunisia, aid consistently made up only a small portion of GDP, while it went up to 10 percent of GDP in West and Equatorial Africa after WWII and in Algeria during the Constantine Plan just before independence.
If public aid to the colonies was small, what compensated for the structural trade deficits of French colonies? By reconstructing as many items as we can of the balance of payments of colonies, we find that colonies’ large trade deficits were not primarily compensated by public aid or private capital but by military expenditures spent locally in the colonies, notably during the wars of independence in Algeria and Indochina. We also find that flows of private money going from the colonies to France (measured as a residual) could be large in certain colonies, such as Indochina, Algeria, and Equatorial Africa.
Finally, for the first half of the twentieth century, we compare the trade surplus of British India and Dutch Indonesia, computed by Maddison (Reference Maddison1989), with the balance of trade of French colonies, adjusted for military expenditure inflows from France. Indeed, colonial military expenditure was mainly financed locally in the two former cases, whereas it was mainly financed by the metropole in the French case, and this difference biases the comparison of current account balances. Before WWI or during the interwar period, we find that Dutch Indonesia experienced the largest “colonial drain,” while the drains from British India and from French colonies were more limited. However, Indochina stands as an exception with a colonial drain representing around 5 percent of its GDP, which is more similar (although still lower) to the drain from Dutch Indonesia (7 to 11 percent).
This paper provides two important contributions to the economic history literature. First, it provides the first evidence that French colonialism was not a financial burden for France. The empire became more expensive at the end of the colonial period because of the military costs of independence wars, and not because of large public or private investments in the colonies. Second, the analysis of the monetary flows between France and its colonies shows how colonial trade deficits were compensated and unveils a significant colonial drain from French colonies. Overall, French colonialism was, for the colonizer, colonialism on the cheap, apart from the costly attempts to maintain domination at the end of the period. Our results profoundly revise the conventional wisdom established by Marseille (Reference Marseille1984).
However, our research has a few limitations. Private investments in the colonies are not precisely estimated, so future research could add precision to this part of the analysis. More importantly, because we consider only the monetary flows between France and its colonies, we do not provide a complete cost-benefit analysis of colonization for the colonized and the colonizer. Notably, we do not consider the long-term economic impact of colonization that may have seriously damaged the growth prospects of former colonies by disrupting institutions and distorting economic structures, without bringing much benefit to already industrialized countries (Bairoch Reference Bairoch1993). As another limitation, we do not consider here the heavy tax and human burden imposed by France on the colonized populations. Likewise, the local consumption of settlers is arguably part of the benefits of colonialism for French citizens but is not part of the balance of payments between France and its colonies; only the savings of settlers that flowed out.Footnote 3
The rest of the paper is structured as follows. The second section presents the sources of data, the methodology used to compute French public expenditure for the colonial empire, and the results. The third section examines the balance of payments between France and its colonies to identify what accounted for the structural trade deficits of the colonies. The fourth section concludes.
FRENCH PUBLIC EXPENDITURE FOR THE COLONIAL EMPIRE
Sources of Data and Definition of Variables
In this section, we present our estimation of French public expenditure for the colonial empire, distributed among central administration expenditure, military expenses, net civil subsidy, and outstanding capital at independence. We express expenditures for colonies as shares of French GDP as well as of French government expenditure. We used a variety of archival sources, notably budget accounts at the colony and French ministry levels and archival documents on colonial loans. We made several decisions to harmonize data and deal with missing observations, which are described in detail in the Online Data Appendix. Here, we merely provide the historical context needed to understand each variable and underline the data construction decisions that we consider particularly important.
CENTRAL ADMINISTRATION EXPENDITURE
The French government spent money within Metropolitan France for the management of its colonial empire. This expenditure includes the personnel and operating costs of the Ministry of the Colonies, the Colonial School (École Coloniale), and the colonial exhibitions held in Paris in 1907 and 1931 (more examples are provided in Reference HuilleryHuillery (2014)). It also includes the central administration expenditure of the FIDES (Fonds d’Investissement pour le Développement Economique et Social), a colonial public investment program created in 1946. By its nature, central administration expenditure is not allocated between the different colonies.Footnote 4
MILITARY EXPENDITURE
The military expenditure of France in its colonial empire covered four main activities: the colonial conquest, the pacification of internal conflicts during the colonial period, the administration of soldiers from the colonies serving in the French Army (such as the Tirailleurs Sénégalais) during external conflicts (world wars), and finally the independence wars. For the sake of rigor, we reclassified part of the military expenditure (3.8 percent) as civil subsidies when it benefited civilians, such as infrastructure (railways, roads, bridges, harbors, etc.) and medical assistance (health facilities).
The case of soldiers from the colonies serving in the French army deserves particular attention. These soldiers were often transported to faraway places, which represented a certain cost. After 1912, most of these indigenous soldiers were conscripts; only a minority (around one-fifth) were volunteers, except in Morocco, Cameroon, and Togo, where conscription did not exist. Many of these soldiers served in Europe during WWI and WWII, but also in other colonies for colonial conquest and independence wars. They represented a substantial addition to French soldiers (Echenberg Reference Echenberg1991).
We had to rely on secondary sources to estimate the cost of the two independence wars of Indochina and Algeria and failed to estimate colonial military expenditure during WWII because there was too much missing data in this period. However, we are confident we managed to capture the bulk of colonial military expenditure. More detail is given in the Online Data Appendix.
NET CIVIL SUBSIDY
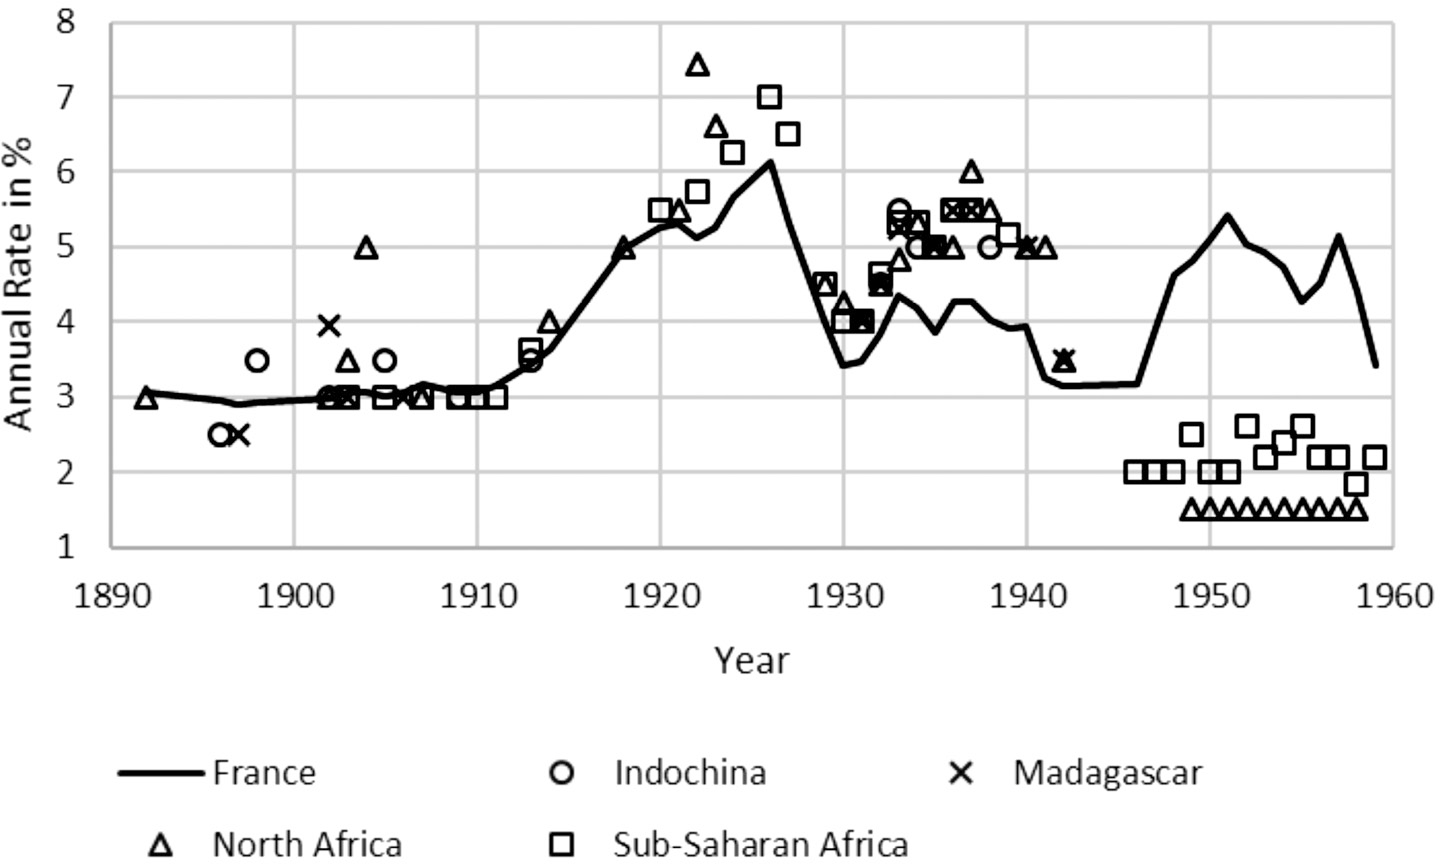
The net civil subsidy from the French government to the colonies is composed of three elements: grants to colonial budgets or public companies (net of grants from colonial budgets and public companies)—71 percent of the total net civil subsidy, expenditure made by the military benefiting civilians mentioned previously—24 percent of the total net civil subsidy, and the implicit subsidy coming from prime interest rates of colonial loans—4 percent of total net civil subsidy. The third element accounts for the possibility that France gave colonial governments the opportunity to benefit from loans at prime interest rates; that is, interest rates lower than what colonies would have faced on the financial market had they been independent. (For a discussion of this “Empire Effect” in the case of the British Empire before WWI, see Ferguson and Schularick (Reference Ferguson and Schularick2006) and Accominotti et al. (Reference Accominotti, Flandreau, Rezzik and Zumer2010).) In fact, colonial loans involved an implicit subsidy only after WWII. Before WWII, the loans of colonial governments were discussed and coordinated by the French government, but then operated by private banks and bought by private bondholders.Footnote 5 After WWII, the French government directly lent money to North African and West African colonies. As shown in Figure 2, the interest rates of pre-WWII loans were above the minimum rate at which the French state could borrow, while after WWII they were systematically lower.Footnote 6 We computed the implied subsidy as the difference between counterfactual annuities (that would have been due if the French government had applied to the colonies the interest rate that applied to itself) and actual annuities. The firsthand detailed information we collected on colonial loans is presented in Online Appendix A.4.
INTEREST RATES ON LOANS CONTRACTED BY COLONIAL GOVERNMENTS VS. THE FRENCH GOVERNMENT
Notes: When there are several loans taken out per region/year, we take the simple average. Before 1945, colonial governments sold bonds on the Paris Stock Exchange. After 1945, colonial governments borrowed directly from the French government. The interest rate on loans contracted by the French government is the “taux de la rente perpétuelle.”
Source: Authors’ calculations using documents from the section “Colonial Loans” of the archive funds “Treasury” at the French Service for Economic and Financial Archives (Services des Archives Economiques et Financières, SAEF).

OUTSTANDING CAPITAL AT INDEPENDENCE
Until independence, colonial budget accounts show that debt repayments were perfectly honored by all colonies. But in the cases of Morocco and Tunisia, the archives of the French Ministry of the Economy and Finance show that the colonial debt due at independence in 1956 was never honored by the newly independent states and was finally cancelled in the early 1960s. To obtain an upper bound of the cost of colonies for France, we assume that Algeria and West Africa also defaulted on their public debt and consider the pending principal calculated from Appendix Table A1–A4 as a forced subsidy of France to the colonies received at the year of independence in 1962 and 1960, respectively—the other colonies had no pending debt capital at independence.
DEVELOPMENT AID AND MILITARY AID
Following the OECD definition of Official Development Assistance, we computed the development aid provided by France to its colonies as the sum of the net civil subsidy described earlier and the outstanding capital at independence, considered as debt cancellation. Since debt may not have been cancelled for all colonies, our measure of development aid should be considered as an upper bound.
We also computed a measure of the military aid provided by France to its colonies. In fact, it would be absurd to claim that 100 percent of the colonial military expenditure incurred by Metropolitan France was military aid, since the bulk of expenditure was spent during the wars of conquest and independence. However, had the colonies been independent countries, they certainly would have incurred costs for their national defense. Part of the French colonial military expenditure may therefore be considered as military aid. To estimate the fraction of military expenses entering this category, we gathered data on the military expenditure of former French colonies in the first decade after independence (see Online Appendix Table A5). On average, between 1957 and 1973, former French colonies spent 1.6 percent of their GDP on military expenditure, so we conclude that 1.6 percent of each colony’s GDP makes a reasonable estimate of the part of French colonial military expenditure that can be considered military aid.Footnote 7 French military expenditure in the colonies was almost always larger than 1.6 percent of colonial GDP.
DEFLATOR AND EXPRESSION AS GDP SHARES
Our main estimates of French public expenditure for the colonial empire are expressed as shares of French GDP. We also provide estimates expressed as shares of French government expenditure. The Online Data Appendix A.6 explains the sources and methodology used to construct price indices, French GDP, and French public expenditure.
We also provide estimates of development aid to the colonies expressed as shares of colonial GDP. Colonial GDP estimates come from Cogneau, Dupraz, and Mesplé-Somps (Reference Cogneau, Dupraz and Mesplé-Somps2021). We first express the GDP figures in nominal terms using the local deflator provided by Cogneau, Dupraz, and Mesplé-Somps (Reference Cogneau, Dupraz and Mesplé-Somps2021), before applying the same deflator as for all other nominal flows.
Results
The results presented next show that France spent little on its colonial empire, and that most of what it spent was military expenditure rather than civil subsidies (what we would classify today as development aid). Even when accounting for the loans that were not repaid after independence and classifying a substantial part of military expenditure as military aid, aid to the colonial empire represented only 0.4 percent of French GDP over the period. All results can be replicated using the replication kit provided by Cogneau et al. (Reference Cogneau, Dupraz, Huillery and Mesplé-Somps2026).
HOW MUCH DID COLONIZATION COST TO FRENCH TAXPAYERS?
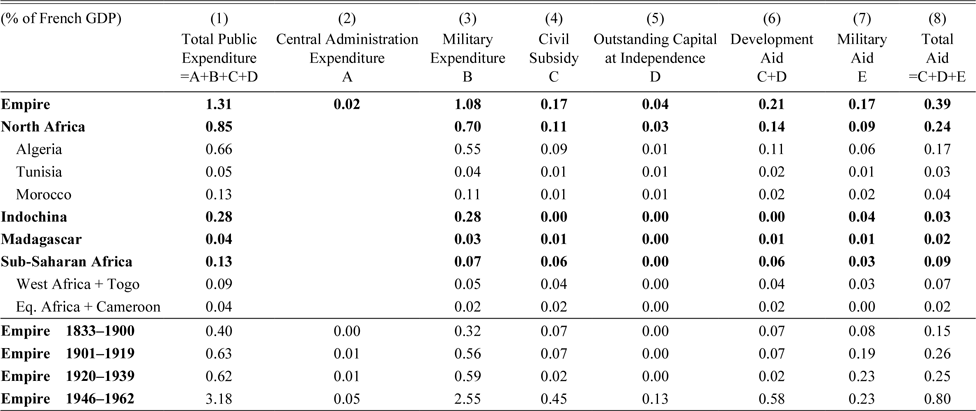
Table 1, Column (1) presents the total public expenditure spent by France on its colonies over the whole colonial period 1833–1962. In total, France spent 1.31 percent of its GDP on its colonial empire. Columns (2)–(5) show the decomposition between central administration expenditure, military expenditure, civil subsidy, and outstanding capital at independence.Footnote 8 We find that military expenditure represented 82 percent of the total, net civil subsidies represented 13 percent, loans likely not reimbursed after independence represented 3 percent, and the central administration of colonies represented 2 percent. The first important lesson from this exercise is thus the striking predominance of military costs over civil costs in French colonization.
FRENCH PUBLIC EXPENDITURE IN THE COLONIES, IN PERCENT OF FRENCH GDP

Notes: This table reports French public expenditure in the colonies, expressed as a percentage of French GDP. Years 1940–1945 are ignored.
Sources: Expenditure in the colonies in Columns (1), (2), and (3) is calculated by the authors from the budgets of the Ministry of Defense (1833–1955), the Ministry of Colonies (1833–1959), the colonies and federation of Equatorial Africa (1899–1960), and the colonies and federation of West Africa (1865–1960), as well as Algeria (1833–1959), Morocco (1912–1956), Tunisia (1891–1955), Cameroon (1922–1960), Indochina (1867–1954), and Madagascar (1898–1960). The Military Subsidy in Column (4) is estimated at 1.6 percent of each colony’s GDP—this roughly corresponds to the share of GDP spent on military expenditure in the corresponding postcolonial independent states. Outstanding Capital at Independence (Column (5)) is estimated by the authors using documents from the section “Colonial Loans” of the archive funds “Treasury” at the Center for Economic and Financial Archives (CAEF).
The second important lesson concerns the temporal variations of this cost. At the bottom of Table 1, we consider four periods of colonial rule: 1833–1900 corresponding to the conquest period from the conquest of Algeria to the law voted in 1900 that acknowledged the principle of financial autonomy of the colonies; 1901–1919 corresponding to the stabilization period in which the administrative organization gradually took shape, until the addition of the two former German colonies, Cameroon and Togo; 1920–1939 corresponding to the heyday period with the empire at its peak and relative administrative and political stability; and finally 1946–1962 corresponding to the demise period with important contestation of the colonial rule and important changes in the financial approach (large public investment program and direct loans from the French government).
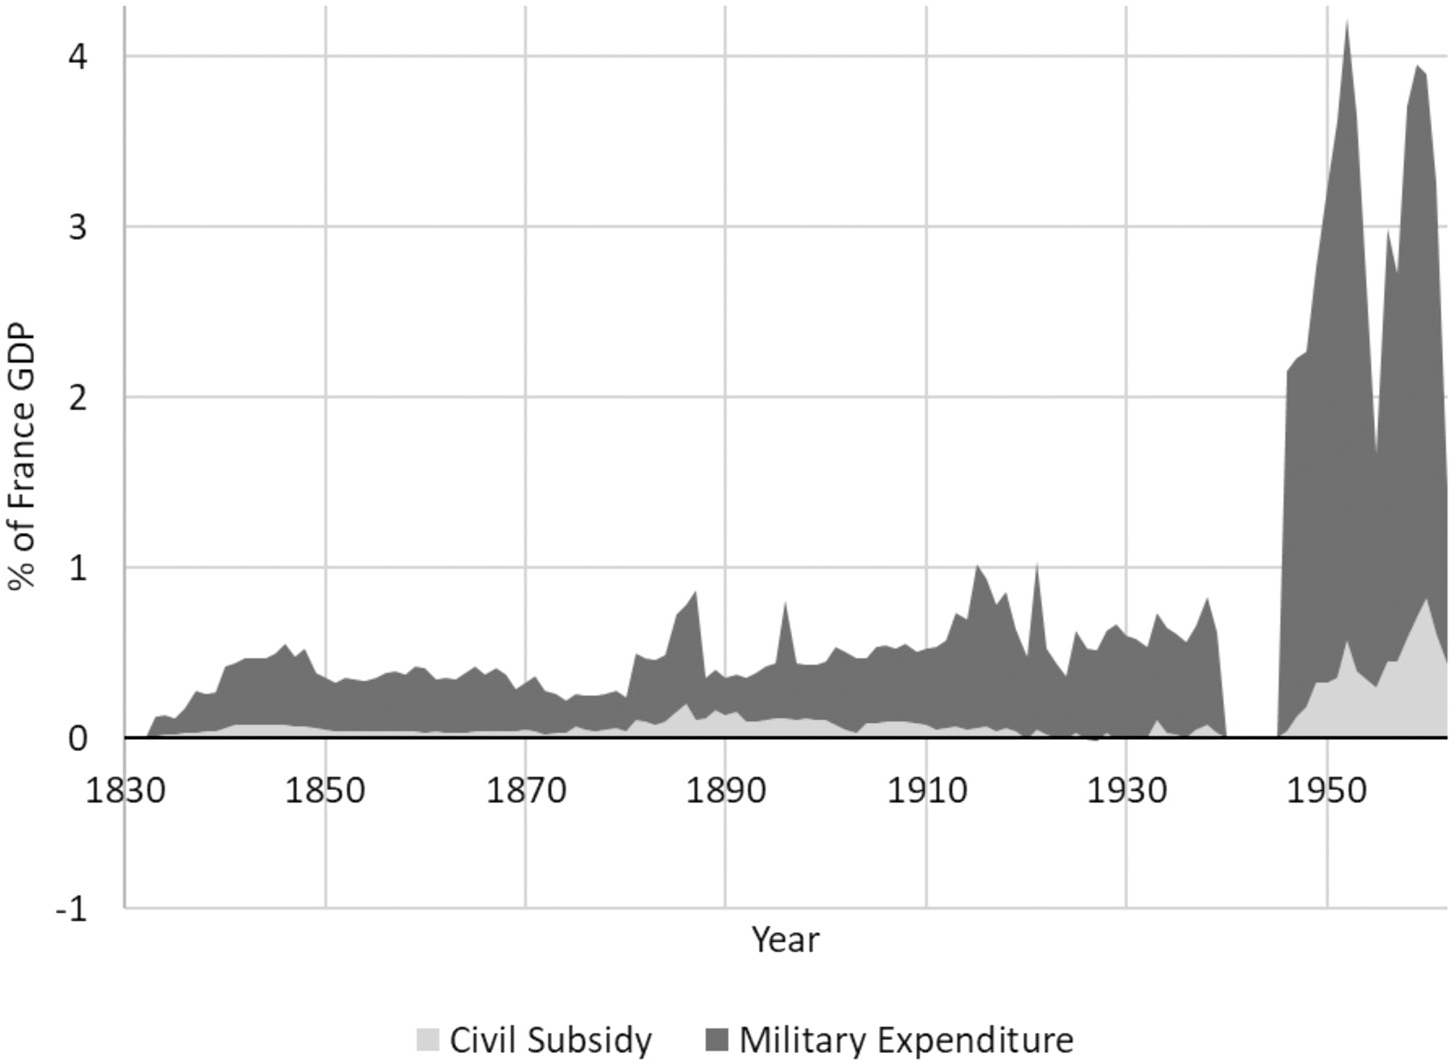
Following this periodization, we find that the cost was disproportionately larger in the last period, 1946–1962 (3.18 percent of French GDP), than in earlier periods (0.40 percent in 1833–1900, 0.63 percent in 1901–1919, and 0.62 percent in 1920–1939). This is largely explained by the cost of the independence wars that occurred in 1946–1954 in Indochina and in 1954–1962 in Algeria.Footnote 9 During the conquest, stabilization, and heyday periods, military expenditure for the empire averaged, respectively, 0.32 percent, 0.56 percent, and 0.59 percent of GDP and never exceeded 1 percent annually, while in the period 1946–1962, it averaged 2.55 percent of French GDP—even spiking at 4 percent of GDP during the most intense phases of the Indochina and Algeria wars (Figure 3 and bottom panel of Table 1).
FRENCH PUBLIC EXPENDITURE FOR THE COLONIAL EMPIRE, IN PERCENT OF FRENCH GDP
Notes: Central administration expenditure is too small to be meaningfully represented.
Source: See Table 1.

Civil expenditure on the empire was very small during the conquest period, at 0.07 percent of French GDP (Table 1). The principle of financial autonomy of the colonies adopted in 1900 did not change this pattern immediately, as civil expenditure also represented 0.07 percent of French GDP during the stabilization period. In the heyday period (1920–1939), civil expenditure fell to 0.02 percent of French GDP. However, like military expenditure, civil expenditure also increased strikingly after 1945 during the demise period, reaching 0.45 percent of French GDP.Footnote 10 Despite the boom in civil expenditure, military expenditure remained largely predominant throughout the colonial period, not only during the colonial conquest in the nineteenth century and during the wars of independence in Indochina and Algeria after WWII, but also in the intermediary periods of 1901–1945.
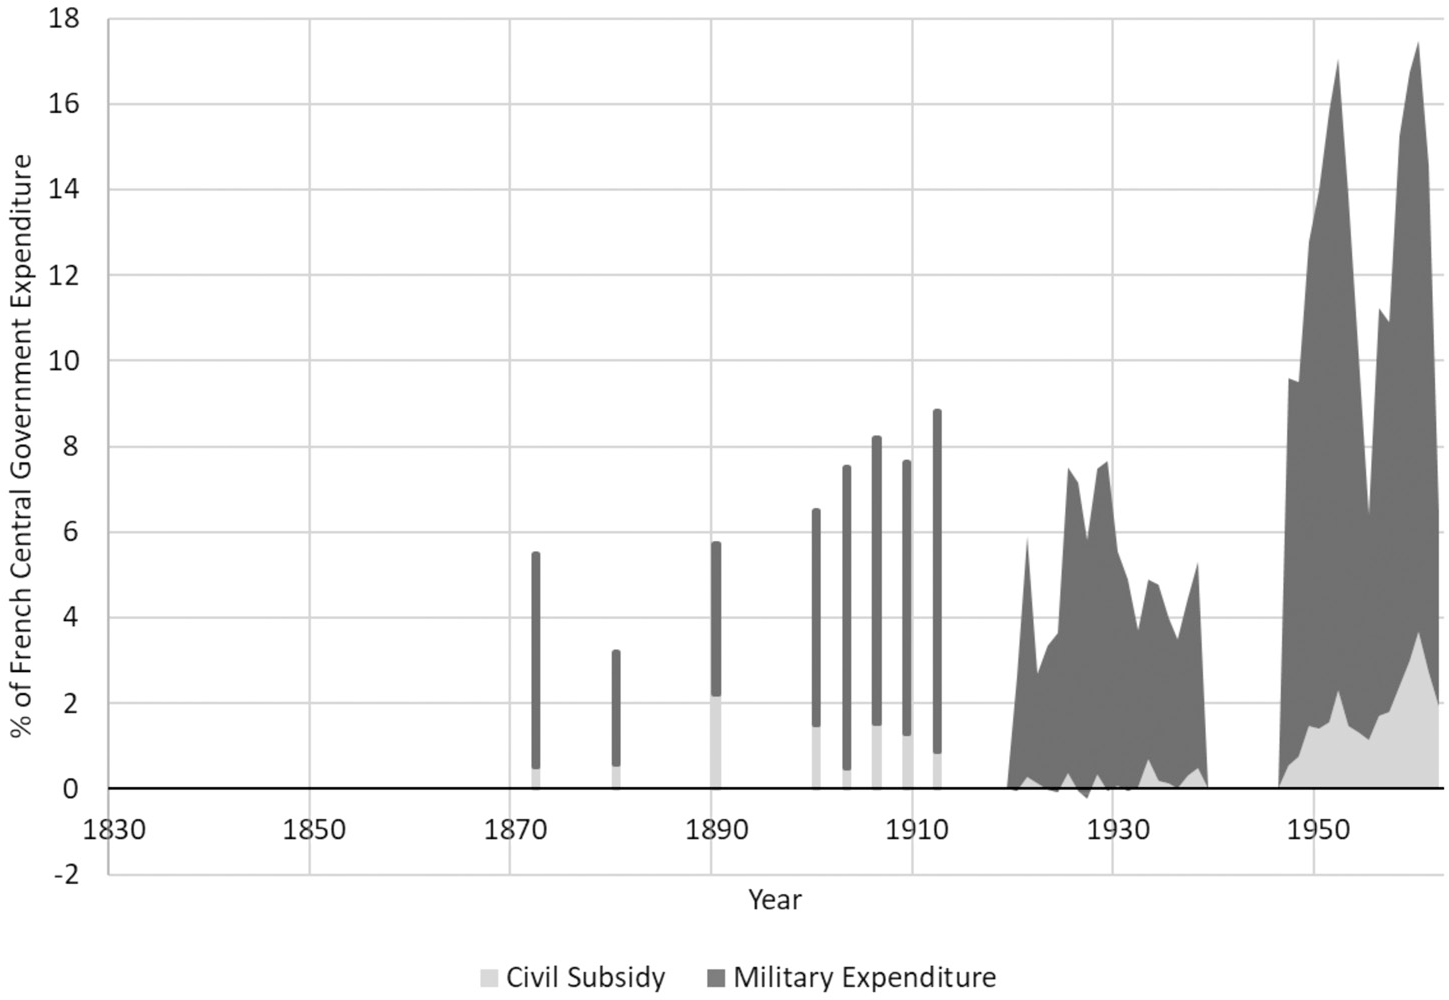
The increases in military and civil expenditure at the end of the colonial period are not unrelated. In the immediate aftermath of WWII, the legitimacy of French colonization was increasingly questioned. The Indochina War (as well as anti-colonial struggles in other colonies, such as in Madagascar in 1947) threatened the colonial order. France, therefore, shifted its colonial policy and started investing in large public investment programs. The “Investment Fund for Economic and Social Development” (FIDES) was established in 1946 to finance large infrastructure and health programs in Sub-Saharan Africa. The “Constantine Plan,” a large investment plan, was also established in 1958 in Algeria at the height of the Independence War.Footnote 11 Though these investment programs were not negligible relative to the size of colonial economies, they did not weigh heavily in the French budget, especially compared to military expenditure. Figure 4 represents civil subsidies to the colonies and military expenditure on the empire as a percentage of French central government expenditure. While colonial military expenditure represented up to an eighth of French central government expenditure at the height of the Indochina and Algeria independence wars, civil subsidies never represented more than 4 percent.
FRENCH PUBLIC EXPENDITURE IN THE COLONIES, IN PERCENT OF FRENCH CENTRAL GOVERNMENT EXPENDITURE
Notes: Central administration expenditure is too small to be meaningfully represented.
Sources: See Table 1 for French public expenditure in the colonies. André and Delorme (Reference André and Delorme1983) for total French public expenditure. Total French central government expenditure is net of debt repayment.

In summary, during more than a century from the beginning of the conquest to WWII, French colonization had been quite inexpensive. The cost of the conquest, stabilization, and heyday periods was small and mostly associated with military expenditure. Due to the combination of the independence wars and large public investment programs, it became suddenly five times costlier after WWII. The total cost of colonization represented up to 16 percent of total French central government expenditure at the height of the Indochina and Algeria wars but fell back to 6 percent in 1962 (Figure 4).
The third remarkable result is that the cost varied substantially from one colony to another.Footnote 12 Algeria on its own accounted for half of the total cost (0.66 percent of French GDP), and Indochina for a fifth (0.28 percent of French GDP). Morocco represented 10 percent of the cost, while Tunisia accounted for 4 percent. All other colonies combined (AOF, AEF, Cameroon, Togo, and Madagascar) accounted for only 13 percent of the total cost. Algeria had a very particular status within the empire, as a settlement colony and the only colony to be, like mainland France, divided into départements administered by the French Ministry of the Interior. Algeria concentrated half of French colonial expenditure overall, despite representing only 10 percent of the empire’s population in 1925, at its greatest extent, and 25 percent of its GDP.Footnote 13 In contrast, while Indochina represented 40 percent of the empire’s population in 1925 and 30 percent of its GDP, it accounted for only a fifth of the cost. The decomposition of the total expenditure between civil and military expenditure provides evidence that the specific role of Algeria was mostly driven by military expenditure, particularly because of the war of Algerian independence. In fact, if we focus on the period between the two world wars, when the empire was at its maximum geographical extent and before the independence wars in Indochina and Algeria, we find that the share of Algeria in total colonial expenditure is only 25 percent, roughly its share in total colonial GDP, while the share of Indochina is 10 percent, well below its share in total colonial GDP.
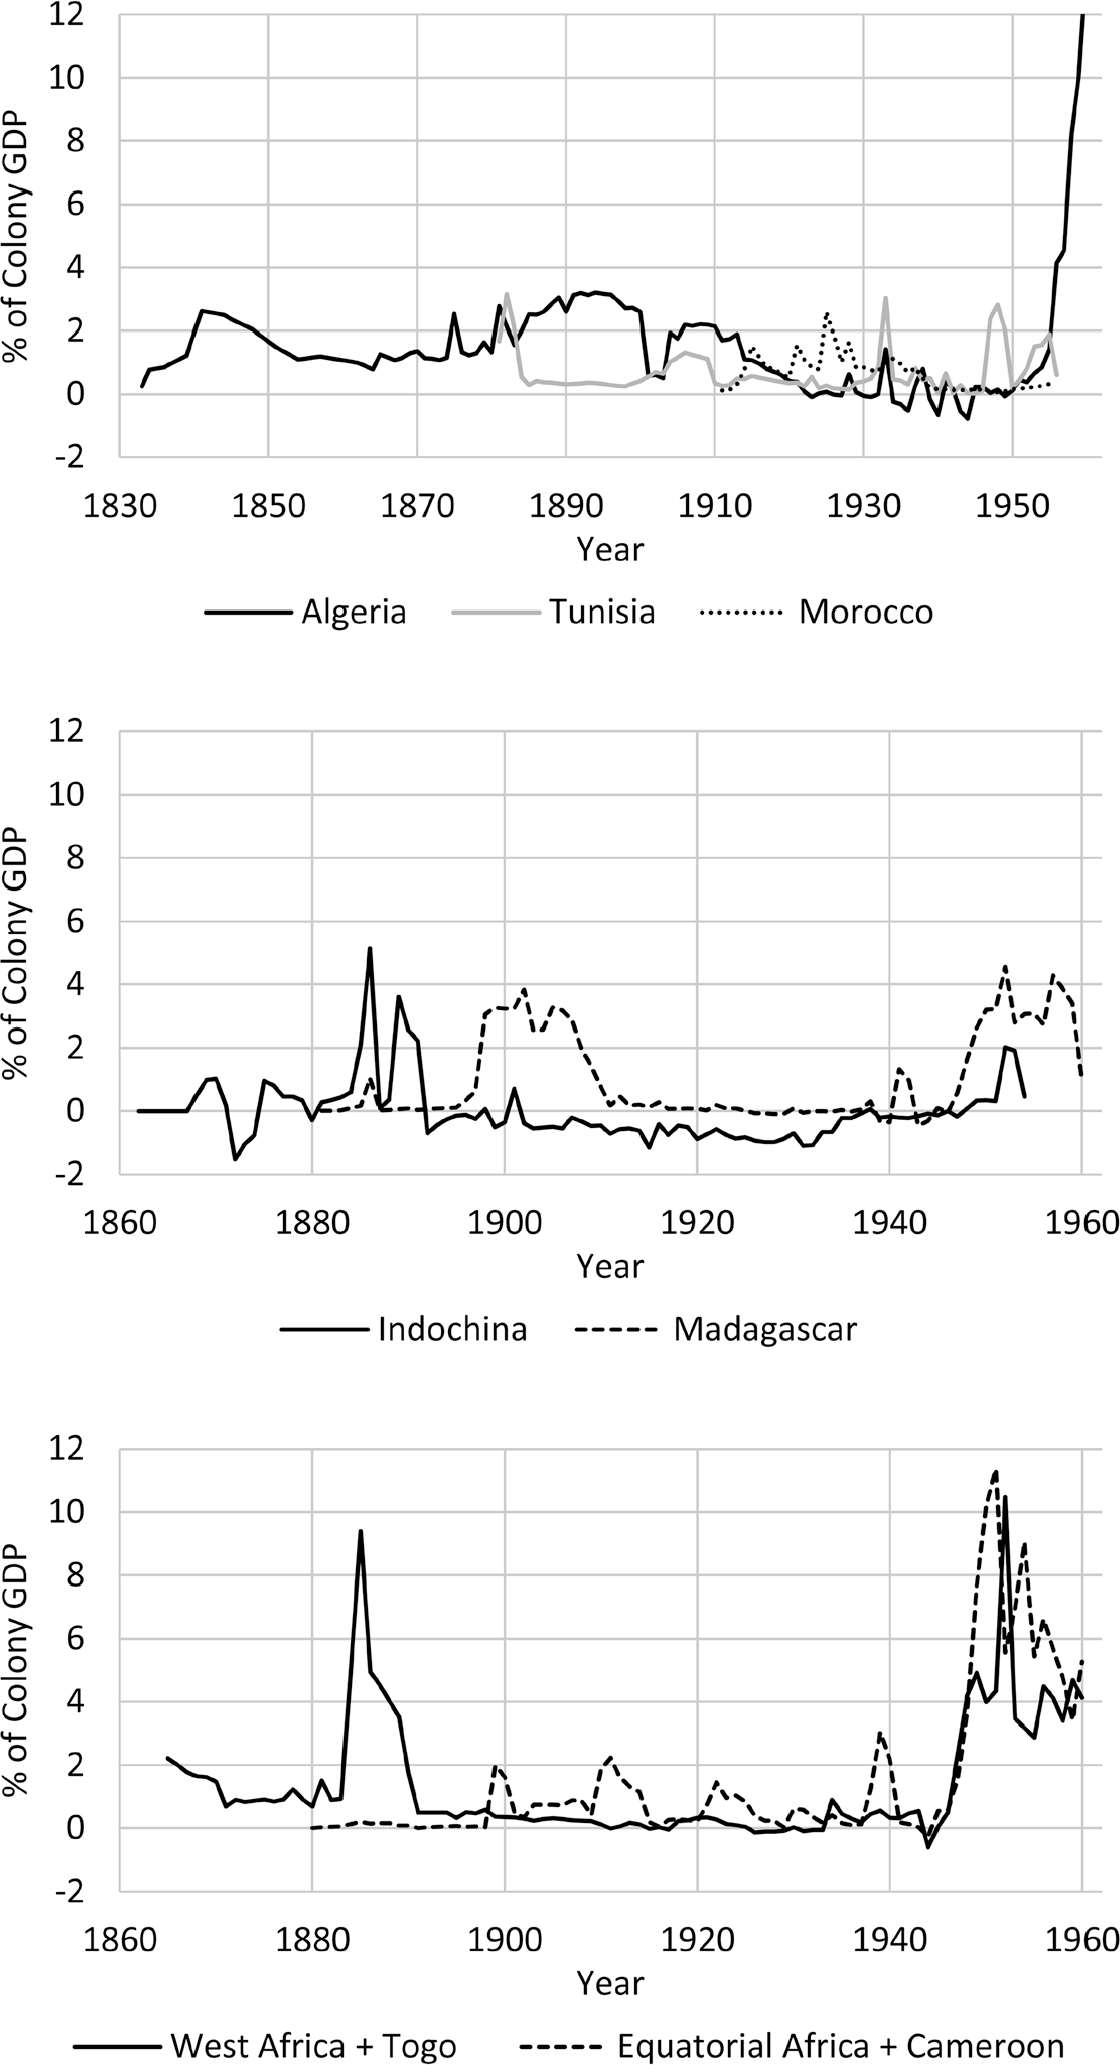
Indeed, another remarkable result is that French colonial expenditure in Indochina was almost entirely military, with the net civil subsidy being close to zero (Table 1). As can be seen in Figure 5, Indochina received positive civil subsidies at the end of the nineteenth century and after WWII, but for most of the colonial period, the net civil subsidy was negative, meaning that Indochinese public revenue was financing the French government. Apart from the military cost of the conquest and independence, Indochina did not cost France anything.
NET CIVIL SUBSIDIES FROM FRANCE AS A SHARE OF COLONIES’ GDP
Notes: In the top graph, net civil subsidies for Algeria in 1960, 1961, and 1962 are out of the frame, reaching 13.7, 16.9, respectively, and 6.3 percent of Algeria’s GDP.
Sources: See Table 1 for net civil subsidies from France. Cogneau, Dupraz, and Mesplé-Somps (Reference Cogneau, Dupraz and Mesplé-Somps2021) for colonies’ GDP.

HOW MUCH AID WAS GIVEN TO THE COLONIES?
In a second step, we calculate the amount of aid that was given to the colonies, keeping in mind that aid to the colonies does not necessarily mean aid to the colonized people, as part of the aid given to the colonies was benefiting French settlers (especially in settler colonies like Algeria) and French firms. In Table 1, Column (6), we start with the amount of development aid. Following the OECD definition of Official Development Assistance, we compute development aid as the sum of the net civil subsidy and the outstanding capital at independence. Over the whole period, French development aid to the colonial empire represented 0.21 percent of French GDP, less than French development aid today (0.55 percent of French GDPFootnote 14), and less than a third of the 0.7 percent target decided by the Assembly of the United Nations in 1970. Algeria alone, one of the richest colonies and home to many French settlers, received half of the total development aid over the period. As shown in the bottom panel of Table 1, development aid to the empire was extremely low for most of the colonial period: 0.07 percent of GDP in 1833–1900, 0.07 percent in 1901–1919, 0.02 percent in 1920–1939. Only in the late colonial period (1946–1962) do we find that French aid to its colonies reached an amount comparable to French public aid today (0.58 percent of French GDP). The increase in development aid at the end of the colonial period is explained not only by the large public investment programs, but also by the (observed or hypothetical) cancellation of the public debt left pending at independence.
Official definitions of development aid never take military aid into account. However, one could argue that colonial governments not paying for external defense allowed them to direct public revenue toward more developmental aims. Column (7) of Table 1 displays our estimate of military aid to the colonies, and Column (8) displays total aid. Including military aid, total French aid to its colonial empire represented 0.39 percent of French GDP over the whole colonial period. In the late colonial period (1946–1962), total aid reached 0.80 percent of GDP. Only in the late colonial period, and only if we include military aid, did French aid to its colonial empire reach an amount in line with today’s largest donors such as Norway, Denmark, and Sweden.
To conclude, at least before WWII, colonization did not cost much to the French taxpayer. The bulk of colonial expenditure was military expenditure, but even these were small compared to the overall military expenditure of France during the period. Between 1872 and 1939, excluding the period of WWI, French military expenses represented 39 percent of central government spending and 6 percent of GDP, so that colonial military expenses represented only 9 percent of total military expenses.Footnote 15 In the post-WWII period (1946–1962), because of the wars in Indochina and Algeria, colonial military expenditure started to account for more, at 31 percent of total military expenditure. It is only after WWII that the colonial empire started to burden French taxpayers, but only because of the cost of independence wars. If we exclude the cost of these wars, subsidies to the colonial empire reached the same order of magnitude as current public aid; however, these subsidies were disproportionately given to Algeria, where a large population of settlers lived.
HOW IMPORTANT WAS FRENCH AID FOR THE COLONIES?
Though French development aid was small as a share of French GDP, it could represent larger amounts relative to the size of colonial economies. Over the whole period, development aid to the empire represented 1.9 percent of colonial GDP, civil subsidies making up 82 percent of this total, the remaining 18 percent being debt forgiveness at independence (see Online Appendix Table B1). Debt forgiveness accounted for more than half of the aid received by Morocco and Tunisia, 14 percent for Algeria, 11 percent for West Africa, and did not apply to other colonies. Figure 5 shows civil subsidies across time in each colony or federation, as a percentage of colonial GDP. Before WWII, civil subsidies rarely represented more than a couple of percentage points of GDP. With the FIDES plan, they went up to 10 percent of GDP in West and Equatorial Africa. With the Constantine Plan between 1959 and 1961, they also exceeded 10 percent of Algerian GDP. French development aid represented, on average, 4 percent of the GDP of recipient colonies over the period 1946–1962. Cogneau, Dupraz, and Mesplé-Somps (Reference Cogneau, Dupraz and Mesplé-Somps2021) provide figures for French ODA between 1960 and 1970 (Figure 3, p. 462), in continuity with colonial civil subsidies. Algeria experienced a stark decrease in French aid after 1962, to only 2 percent of its GDP in 1969, given that it had received large amounts between 1955 and 1962. Tunisia and Morocco received about the same small amounts in the decade after independence as under colonial rule. Indochina was already receiving nothing before independence. Aid to Madagascar decreased to 1 percent of GDP compared to 1.9 percent between 1896 and 1960. Finally, in Sub-Saharan Africa, French aid stabilized around 3 percent of GDP in the 1960s, which is a level similar to average civil subsidies between 1896 and 1960 (2.6 percent).
OVERALL FINANCIAL FLOWS IN AND OUT OF THE EMPIRE
In the previous section, we reconstructed the expenditure of the French government for the colonial empire in the nineteenth and twentieth centuries. In terms of the balance of payments of France and of the colonies, a large share of this expenditure corresponded to flows of money from Metropolitan France to the colonies—though not 100 percent of this expenditure, since part of the money spent for the empire never reached the colonies, such as expenses on central administration, military wages when troops were training in France, or military equipment produced in France and transported with troops. In this section, we attempt to reconstruct other flows in the balance of payments, not limiting ourselves to public flows but considering private flows as well.
The objective of this exercise is to provide insights into the other side of the balance sheet of colonization: the benefits for the French residents. This insight is only partial, first because many of the benefits of colonization for the French did not give rise to a monetary payment (e.g., land grabbing in Algeria), and second because, even focusing on monetary benefits, a balance of payment approach will necessarily miss the benefits that did not leave the colonies (for instance, the consumption of locally produced goods or services by a settler or civil servant in the colonies will not appear in the balance of payments). However, this exercise provides some insight into the nature of the economic relationship between France and its colonial empire by documenting the private monetary flows in and out of the colonies.
The analysis of the costs and benefits of colonization for the colonizing and the colonized country through the analysis of the balance of payments has a long history in the social sciences, especially regarding the balance of trade. Trade flows have the advantage of being relatively easy to measure. Since the balance of payments is equal to zero by construction, a balance of trade surplus (more exports than imports) must necessarily be balanced by outgoing payments—though, without additional information, one cannot know what these payments are. Conversely, a balance of trade deficit (more imports than exports) must necessarily be balanced by incoming payments. In the case of India, as early as the end of the nineteenth century, economists such as Naoroji (Reference Naoroji1901) denounced the drain of Indian wealth by the British colonizer in relation to the Indian trade surplus vis-à-vis Great Britain. Maddison (Reference Maddison1971) later confirmed that India’s trade balance was in surplus during the entire colonial period and turned into a deficit after 1947. Dutch Indonesia similarly had a structural trade balance surplus (Maddison Reference Maddison1989; van der Eng 1998).
Regarding the French colonial empire, Marseille (Reference Marseille1984) pointed out that, except for Indochina, the trade balances of French colonies were structurally in deficit. He concluded that the French colonies had received large inflows of capital from France, especially public capital, in the form of grants and loans. However, this cannot be confirmed by an analysis of the trade balance alone: many other payments can equilibrate the balance of payments, such as private capital or income flows. In the previous section, we showed that France’s public subsidies for its colonies had been particularly low. Does it mean, then, that the colonies received large public loans or large influxes of private capital that compensated for the trade balance deficits? In this section, by reconstructing other elements of the balance of payments of French colonies, we show that the colonies did not receive large inflows of private capital and that, in most cases, the share of French military expenditure spent locally in the colonies (including soldiers’ pay) was sufficient to equilibrate the balance of payments, monetary flows not considered by Marseille (Reference Marseille1984).
Sources of Data and Construction of Different Items of the Balance of Payments
We reconstructed as many items of the balance of payments of French colonies as we could. This was not straightforward because France started publishing (very partial) balance of payments statistics for its colonies only in 1952.Footnote 16 The sources used in the previous section allowed us to compute some important items, such as French aid, French military expenditure spent locally in the colonies, public loan repayments and disbursements, and debt forgiveness. We used other sources to reconstitute two additional items of the balance of payments: the balance of trade and private investments in the colonies. We excluded the period 1940–1945 from our balance of payment series altogether because we miss important information for this period due to the breakdown in administrative relations between the colonies and the metropole.
BALANCE OF TRADE
We computed two estimates of the balance of trade. Our preferred estimate corrects the French official import and export figures for each colony by the TRADHIST database of bilateral trade flows (Fouquin and Hugot Reference Fouquin and Hugot2016), built using the trade records of many industrialized countries (not only France). We show the robustness of our results in estimating the balance of trade for colonies using only French records (Online Appendix Table B2). More detail about the sources and methodology is given in the Online Data Appendix.
FRENCH CIVIL SUBSIDIES
French civil subsidies are a component of the income account. It is the same variable as in the previous section, with one difference: we did not include the grant element of public loans, as it is recorded as loan disbursements in the financial account of the balance of payments.
FRENCH MILITARY EXPENDITURE SPENT LOCALLY IN THE COLONIES
While part of French military expenditure in the colonies was spent in France (to purchase, e.g., military equipment), part of it was spent in the colonies (e.g., for paying French soldiers posted in the colonies), therefore entering the colonial balance of payments. In his book on the cost of Indochina’s independence war, Tertrais (Reference Tertrais2002) estimated that 50 percent of military expenditure for this war was spent locally. We applied the same rate for Algeria’s independence war, as it is also consistent with some balance of payment data we could find (see Online Appendix Table C1). We assumed that the share of military expenditure spent locally was larger for the other periods: 75 percent during the colonial conquest of Algeria (up to 1871), the conquest and pacification of Morocco (up to the Rif War in 1926), the French Madagascar expeditions (Franco-Hova wars in 1883 and 1896), and WWI; and 90 percent the rest of the time. We also probe the sensitivity of our results to these assumptions by assuming that a constant share of 50 percent of military expenditure was spent locally. As mentioned previously, we did not estimate military expenditure between 1940 and 1945, so we do not compute French military expenditure spent locally in the colonies during this period.
PUBLIC LOAN REPAYMENTS AND DISBURSEMENTS
The information on public loan repayments and disbursements during the colonial period comes from colonial budgets (we checked that this information was in line with the loan data collected in the French Ministry of Economics and Finance). Although we included the loans likely not repaid after independence in the cost of colonization for the French (Table 1), we do not include them in the balance of payments series (they would enter under the category “Debt forgiveness” in the Capital Account). The reason is that this debt forgiveness, when it occurred, took place after the colonial period (e.g., Morocco and Tunisia became independent in 1956, but their debt was cancelled in the beginning of the 1960s).
PRIVATE INVESTMENTS IN THE COLONIES
We were able to partially reconstruct flows of private capital in the colonies using data on share capital called at the Paris Stock Exchange. We miss other capital inflows, raised using bonds, raised by non-listed firms, or directly invested by French or foreign households in the colonies. Our estimate is certainly a lower bound; yet, the consequence of this uncertainty is quite limited for our estimates and innocuous for our conclusions, as discussed in Online Appendix A.8.
Results
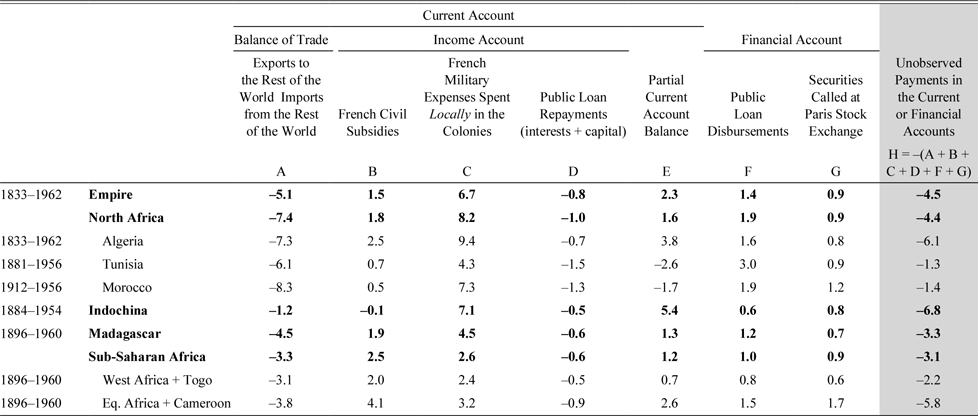
In Table 2, we show the components of colonial balances of payments that can be documented with our data, expressed in percentages of colonies’ GDP, over the entire colonial period (excluding 1940–1945). We organize colonial balances of payments in two parts: the current account and the financial account. Nowadays, the International Monetary Fund uses a third account, the capital account, measuring capital transfers between home and foreign residents that do not affect income, production, or savings. They are limited to a small number of transfers, such as transfers of copyrights and trademarks (non-existent or very limited in our time period) or debt forgiveness. Though some colonial debt was forgiven, this happened after the colonial period, and we, therefore, do not include it in Table 2.
PARTIAL BALANCE OF PAYMENTS OF FRENCH COLONIES, IN PERCENTAGE OF COLONIES’ GDP

Notes: This table reports components of the colonies’ balance of payments. The period 1940–1945 is excluded. Positive quantities are receipts to the colony. Negative quantities are payments from the colony. Amounts are expressed in percentages of colonies’ GDP (Cogneau, Dupraz, and Mesplé-Somps Reference Cogneau, Dupraz and Mesplé-Somps2021). Aggregated figures for the empire, North Africa, and Sub-Saharan Africa are simple averages of the BoP elements of each colony, without consolidation.
Sources: The balance of trade (Column (A)) comes from the CEPII TRADHIST data and from Annuaire Statistique de la France. French civil subsidies, French military expenses, public loan repayments, and public loan disbursements (Columns (B), (C), (D), and (F)) are calculated by the authors from colonial budgets and the budgets of the French Ministry of the Colonies and Ministry of Defense. We assume that 90 percent of military expenditure is spent locally during peacetime, 75 percent during wartime, and 50 percent during the independence wars of Indochina and Algeria. Securities called at the Paris Stock Exchange (Column (G)) are from share capital series of listed colonial firms; see text. Column (H) represents the unobserved transfers, equal to the opposite of all observed transfers, to make the balance of payments equal to zero.
The current account includes a nation’s net trade in goods and services, its net earnings on cross-border loans and investments, and its net transfer payments (both governmental and private, such as remittances). Payments to foreigners count as deficits (negative sign), while receipts count as surpluses (positive sign). Column (A) reports balances of trade over the full colonial period, for the whole colonial empire, and by colony (or federation).Footnote 17 Over the entire colonial period, all colonies exhibited trade deficits, ranging from 1.2 percent of GDP in Indochina to 8.3 percent of GDP in Morocco. This reflects the fact that colonial trade balances were most often in deficit, the main exceptions being the WWI period, the second half of the 1930s (excepting Morocco and Tunisia), Indochina between 1891 and 1939, and AEF until 1913.
In the next two columns of Table 2, we report income receipts from the French government in two categories: net public subsidies from Metropolitan France to its colonies (Column (B)), and military expenditure by Metropolitan France spent locally in the colonies (Column (C)). French civil subsidies to the colonies were much smaller than colonial trade deficits, which contradicts Marseille’s argument, except for Equatorial Africa and Cameroon, where French civil transfers virtually financed the trade deficit. In the rest of the empire, these transfers from France were far from that target, even in West Africa. However, the share of French colonial military expenditure spent locally in the colonies (Column (C)) represents large amounts, often of similar sizes as trade deficits, which suggests that colonial military activities (especially independence wars, which represented the bulk of military expenditure) were an important source of money inflow in the colonies. Changing the rule for the share of military expenditure spent locally in peacetime (50 percent instead of 90 percent) does not modify the overall picture, because wartime expenditure trumps peacetime expenditure.Footnote 18 In Column (D), we display the colonies’ public loan repayments (interests and capital), entering as a deficit (a payment from the colonies to France).Footnote 19 At around 0.8 percent of the colonies’ GDP, they were not negligible in the colonies’ balance of payments, especially for Tunisia (1.5 percent of GDP) and Morocco (1.3 percent of GDP).
The components presented in Columns (A) to (D) represent the bulk of the colonies’ current account. During the colonial period, services such as tourism, finance, counseling, etc., were not developed, and the corresponding transactions were likely minimal. Civil subsidies and military expenditures from countries other than France were virtually nonexistent, and public loan repayments to inhabitants of countries other than France can be considered minimal.Footnote 20 One unobserved category of income transfers, however, might have been important: private transfers from residents of the colonies to French residents, such as dividends paid to owners residing in France, purchase of French land property, housing, etc., by French expatriates or settlers, remittances to their relatives in France, etc., which would enter the current accounts as a deficit. On the opposite direction, from French residents to residents of the colonies (surplus side), dividends from French assets owned abroad by rich French expatriates or settlers are also missed, yet should have been limited. Likewise, remittances from migrants in France to their relatives living in the colonies became important for Algeria, Morocco, Tunisia, or Sub-Saharan countries such as Mali, but only after independence. All these unobserved transfers are grouped in Column (H).
Column (E) thus presents a current account balance that is partial, the sum of Columns (A), (B), (C), and (D). For all colonies except Tunisia and Morocco, the partial current account balance is positive, which means that the inflows of public money from France in Columns (B) and (C) were large enough to compensate for colonial trade deficits and debt repayments. This is mainly driven by the military expenditure spent locally in the colonies, with civil subsidies playing a smaller role in the current account. Taking the average for the whole empire, the trade deficit with the rest of the world represented an outflow of 5.1 percent of GDP, while military expenses spent locally by France represented an inflow of 6.7 percent of GDP. This finding paints a view of the colonial economy very different from the one painted by Marseille (Reference Marseille1984): colonial trade deficits were not financed by substantial public aid from France, but by substantial expenditure by France to maintain French soldiers posted in the colonies and pay the wages of local soldiers serving in the French army. In the case of Tunisia and Morocco, trade deficits and debt repayments were particularly large, and public transfers from France did not compensate, resulting in a negative partial current account balance (however, in the case of Tunisia, the breakdown of military expenditure between this colony and Algeria is uncertain between 1914 and 1950, see Online Data Appendix A.2).
To provide a more comprehensive understanding of the international economics of French colonies, we must also look at the financial account. The financial account reflects a nation’s net change in ownership of international assets. A net increase in ownership of international assets counts as a deficit since money flows out, while a net decrease in international assets means that foreigners buy national assets more than residents buy foreign assets, so money flows in, creating a surplus. Thus, foreign direct investment in the country, purchases of national shares and bonds by foreigners, disbursements of loans granted by foreigners, and sales of foreign currency by the central bank all count as surpluses. Symmetrically, capital investments abroad, purchases of foreign shares and bonds by locals, disbursements of loans granted to foreigners, or purchases of foreign currency by the central bank all count as deficits. Our data provides evidence on two categories of asset transactions between the colonies and Metropolitan France: French loan disbursements to colonial budgets, recorded as a surplus (Column (F)), and private securities called at the Paris Stock Exchange, also recorded as a surplus (Column (G)). The financial account is not complete since there were loan disbursements to private colonial companies and direct private investment in the colonies, not transiting through the Paris Stock Exchange. Columns (F) and (G) should thus provide a lower bound of the inflows of private money in the colonies. Finally, we do not observe the flows of currencies operated by central banks to counteract those that originated from the market. For the period 1952–1962, Banque de France data suggest that these flows of currencies were limited (Online Appendix C). All these unobserved transfers are grouped in Column (H) with previous unobserved payments of the current account described earlier.
We find that the observed inflows of money from the financial accounts (F+G), though partial, were not negligible, representing a surplus of 2.3 percent of colonies’ GDP over the colonial period. Debt disbursements represented 1.4 percent of the empire’s GDP, but two territories stood out: Tunisia received much more than the rest of the empire (3 percent of its GDP), while Indochina received much less (0.6 percent of its GDP). Private investments registered at the Paris Stock Exchange were more homogeneously distributed across colonies, representing almost 1 percent of GDP for most colonies, although less in West Africa (0.6 percent of its GDP) and more in Equatorial Africa (1.7 percent of its GDP).
As the sum of all transactions recorded in the balance of payments is zero (by construction), it is easy to compute all unobserved payments by taking the opposite of the sum of all observed payments. This is what we do in Column (H). For all colonies, the sum of unobserved payments is negative, meaning that unobserved outflows are more important than unobserved inflows. The colony in which the unobserved deficit is the largest is Indochina (6.8 percent of GDP), followed by Algeria (6.1 percent of GDP), and Equatorial Africa (5.8 percent). Tunisia and Morocco display the smallest figures, of 1.3 percent and 1.4 percent, respectively.
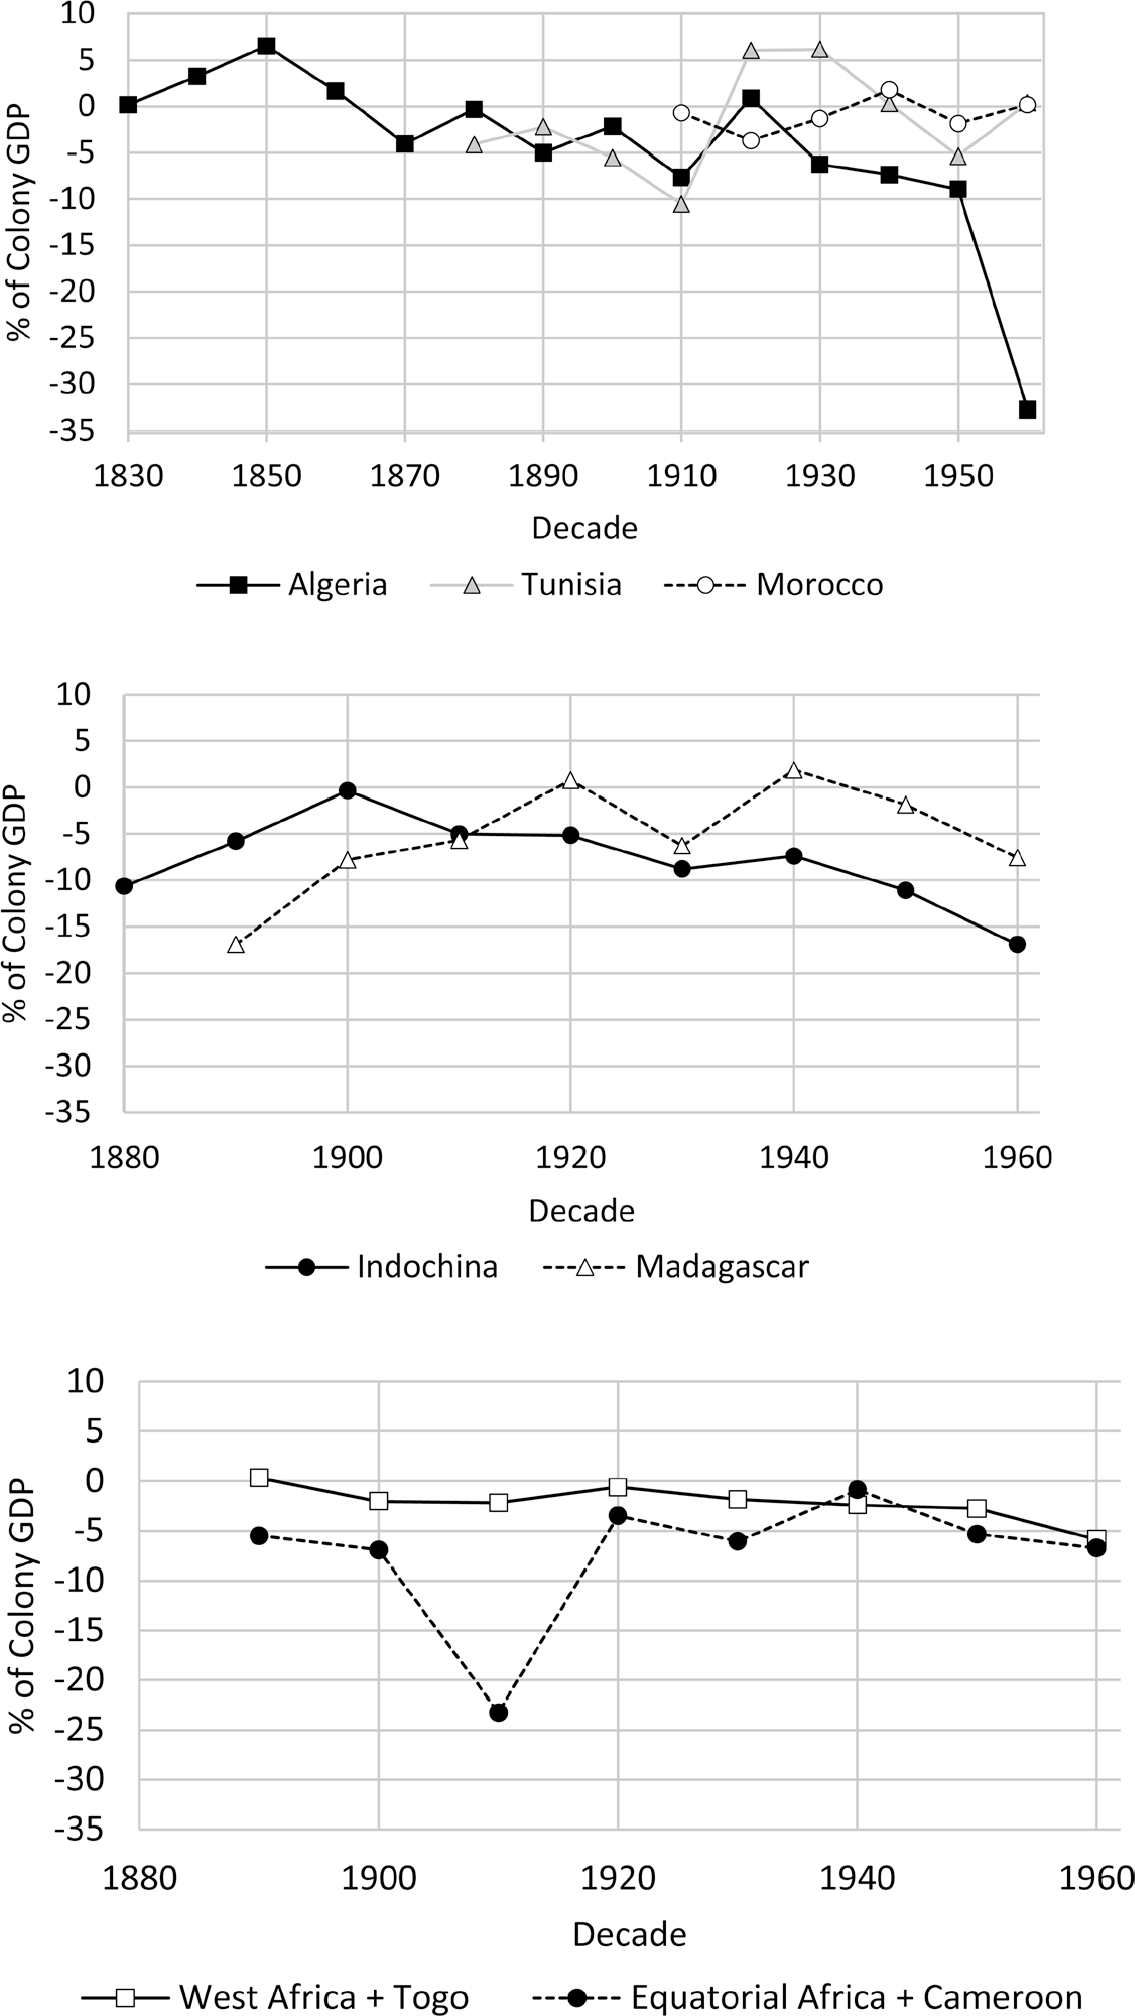
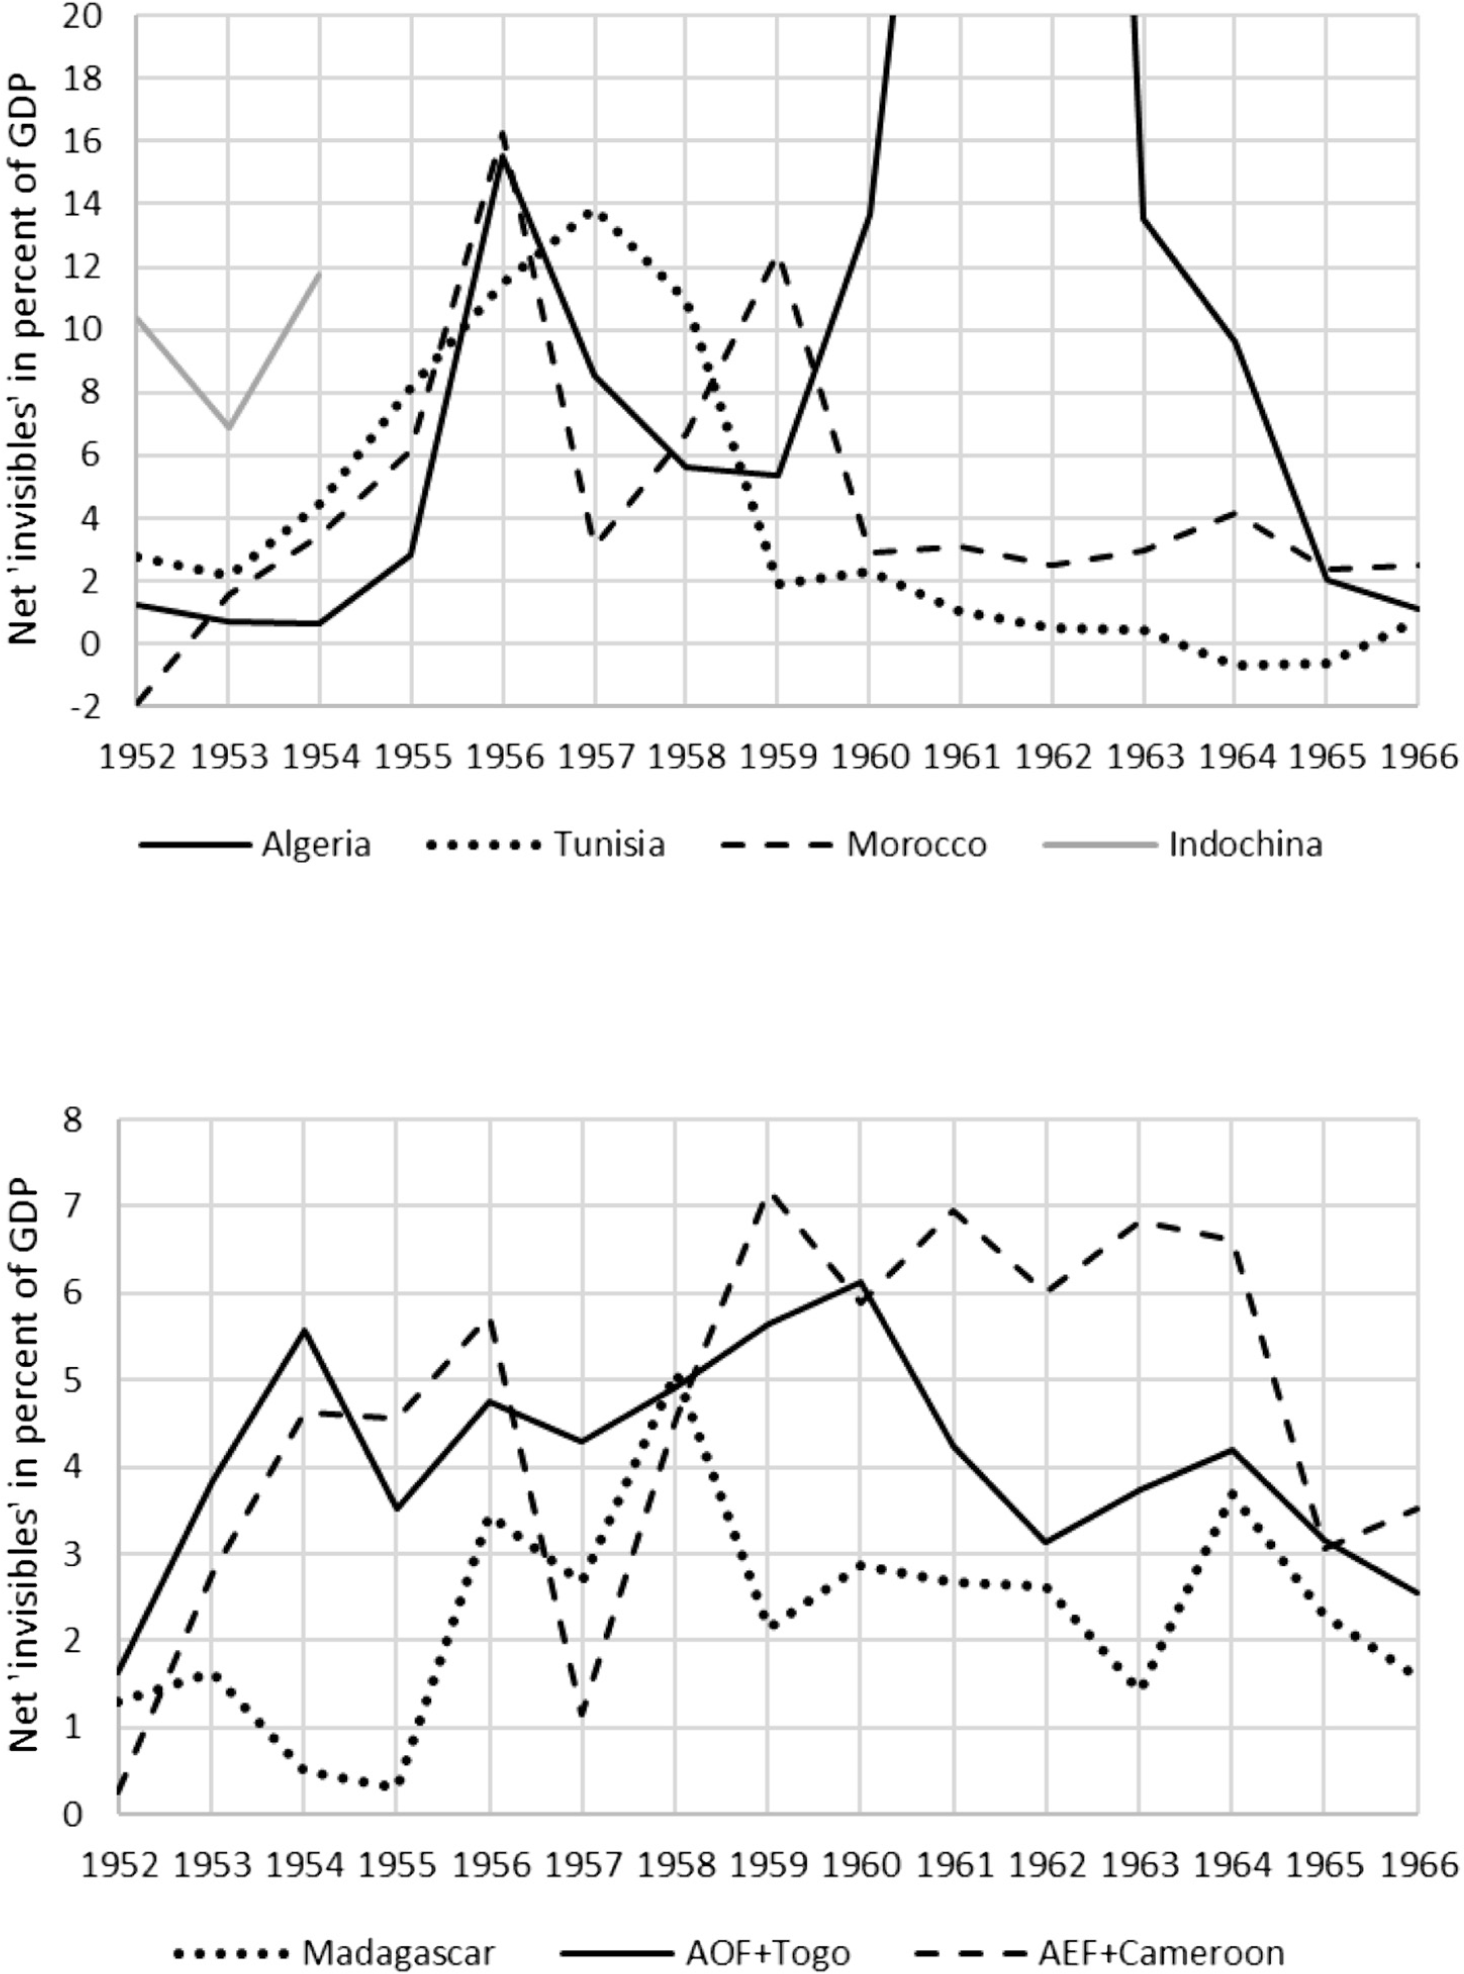
If we assume that inflows into the reserve account were small and that the bulk of private capital inflows to the colonies were going through the Paris Stock Exchange, we can interpret these unobserved payments as the sum of private monetary flows out of the colony in the form of dividends to French owners of capital or repatriated profits of colonial firms, remittances to the relatives of French expatriates and settlers, and transfers to their saving accounts in France.Footnote 21 To the extent that monopsony power of colonial trading companies allowed them to underpay local producers of commodity exports (Tadei Reference Tadei2020), they could pay large dividends to their shareholders in France. The wages paid to French colonizers living in the colonies were disproportionately high (Huillery Reference Huillery2014; Cogneau, Dupraz, and Mesplé-Somps Reference Cogneau, Dupraz and Mesplé-Somps2021) and likely not spent entirely in the colonies, given low prices and a lack of consumption and investment opportunities relative to France. In Figure 6, we plot the decade-by-decade evolution of unobserved payments in each colony. A few things are remarkable. In Equatorial Africa, the deficit is large from the 1890s to the 1930s during the brutal regime of concessionary companies (Coquery-Vidrovitch Reference Coquery-Vidrovitch1972), peaking at 20 percent of GDP in the 1910s. The deficit is also large in Madagascar in the early colonial period and in Indochina in the twentieth century. Unobserved payments are only positive in Algeria before the 1870s and in the 1920s, and in Tunisia in the 1920s and 1930s. In all colonies, unobserved payments turned negative after 1945 and in the years preceding independence. In Algeria, they represented a deficit of more than 30 percent of GDP in the 1960s, which very likely corresponded to capital repatriation by French settlers. Figure 7 shows similar estimates of private outflows, calculated by Banque de France between 1952 and 1966 (see also Online Appendix C). These figures confirm that outflows boomed everywhere in the years preceding independence and, in some cases, like AEF and Cameroon, remained high afterward. The work of Ogle (Reference Ogle2020) suggests that this money did not only flow to the metropole but potentially also to tax havens like Switzerland.
EVOLUTION OF UNOBSERVED PAYMENTS IN THE BALANCE OF PAYMENTS OVER THE COLONIAL PERIOD
Notes: The figures report the decadal averages of unobserved payments in each colony or colonial federation over time (Column (H) of Table 2). Negative numbers correspond to net payments flowing from colonies to France.
Source: See Table 2.

BALANCE OF PAYMENT OUTFLOWS AROUND INDEPENDENCE
Notes: Net “invisible” private operations between each country (colony) and the franc zone, as a percent of country’s GDP. Algeria: for the years 1961 and 1962, outflows reach 39 and 77 percent of GDP, respectively. The net outflow is computed by the Bank of France as the trade balance minus net public transfers, which is equivalent to A+B+C+D+F in Table 2. Net foreign currency operations (current and in capital) are also discarded (these are always small amounts).
Source: Rapports du comité monétaire de la zone franc, 1956–1966.

Though we need to be very cautious in the interpretation of these residual payments, it is likely that in certain colonies and certain time periods, large amounts of private money flowed out of the colonies. On average, unobserved private payments represented a flow of 4.5 percent of GDP out of the colonies. If we break down the balance of payments by sub-period (Online Appendix Table B3), we find that outflows surpassed inflows in all periods considered: the conquest period (1.8 percent), the stabilization period (4.4 percent), the heyday period (2.8 percent), and even more in the demise period (6.9 percent). If we alternatively use the French official customs figures for the balance of trade, we get a lower but still large 3.4 percent figure for the whole 1833–1962 period (Online Appendix Table C1).
Comparison of the French, British, and Dutch Colonial Drains
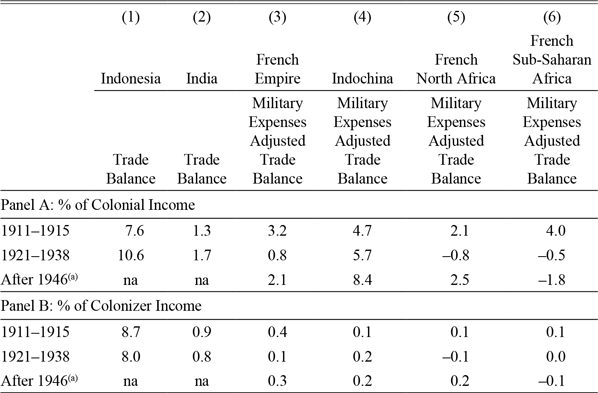
What if we wish to compare our estimates with Maddison’s on British India and Dutch Indonesia (Maddison Reference Maddison1989)? Maddison based his conclusions on the balance of trade and did not consider military expenditure inflows, as in those two colonies, military expenditure was mainly financed locally.Footnote 22 Since French colonies received large military expenditure inflows from France, we need to compare the balance of trade of British India and Dutch Indonesia with the balance of trade adjusted for the military expenditure inflows in French colonies. More precisely, the military expenses-adjusted trade balance for French colonies is equal to exports to the rest of the world minus imports to the rest of the world, plus French military expenses spent locally in the colonies. To make meaningful comparisons, we use the same time periods as Maddison (Reference Maddison1989): 1911–1915 and 1921–1938.Footnote 23 We also report the military expenses-adjusted trade balance of French colonies after 1946 to show the evolution of the colonial drain after WWII, although both India and Indonesia had already become independent at the time. The results are presented in Table 3.
COMPARISON OF COLONIAL DRAIN WITH INDONESIA AND INDIA

Notes: In Panel A, colonial income is Net Domestic Product for Indonesia and India and Gross Domestic Product for the French Empire. In Panel B, colonizer income is NDP for the Netherlands and Britain, and GDP for France. Having NDP rather than GDP as a denominator does not change our conclusion. In 1955, for Algeria or Morocco, depreciation of capital was estimated at 6–7 percent of GDP. For India and Indonesia, the trade balance is adjusted for the movement of treasure (gold and silver), but the adjustment is small (about 5 percent of the surplus in the case of Indonesia). For the French Empire, the military expenses adjusted trade balance is equal to exports to the rest of the world minus imports from the rest of the world, plus French military expenses spent locally in the colonies. In Columns (3)–(6), all figures are expressed in 1937 francs before summing. (a) From 1946 to independence, in 1954 for Indochina, 1955 for Morocco, 1956 for Tunisia, 1961 for Sub-Saharan African colonies, and 1962 for Algeria. In Panel B, the denominator is the GDP of France over the whole period (1946–1962).
Sources: Maddison (Reference Maddison1989, tables 2, 3, 4, 5) for Indonesia and India. See Table 2 for the French Empire.
The first lesson from this comparison is that the “colonial drain” in Dutch Indonesia was much larger than in both British India and French colonies. Between 1911 and 1915, Maddison found that the export surplus of Dutch Indonesia amounted to 7.6 percent of its net domestic product (NDP), versus 1.3 percent for British India. In the same period, the colonial drain in the French Empire lay in between, amounting to 3.2 percent of colonies’ GDP (Table 3, Panel A, Column (3)).Footnote 24 In the interwar period 1921–1938, the export surplus of Indonesia and India rose to 10.6 percent and 1.7 percent of their NDP, respectively, whereas the military expenses-adjusted trade balance of French colonies fell to only 0.8 percent of their GDP. It increased again after 1946, representing 2.1 percent of French colonies’ GDP. Therefore, according to these (admittedly coarse) measurements, the colonial drain from French colonies was overall of the same order of magnitude as from British India, but much smaller than that from Dutch Indonesia.Footnote 25
The second lesson, however, is that the colonial drain from French Indochina was large and of the same order of magnitude as from Dutch Indonesia. In fact, Columns (4), (5), and (6) show important variations in the colonial drain across French colonies. Indochina’s military expenditure-adjusted trade surplus was large, representing 4.7 percent of its GDP in 1911–1915, 5.7 percent in 1921–1938, and 8.4 percent after 1946. The financial counterpart of this large trade surplus consisted mainly of private flows out of Indochina, including dividends to French capital owners, repatriated profits of colonial firms, remittances to the relatives of French expatriates, or transfers to French expatriates’ savings accounts in France. In contrast, the colonial drain was always smaller and sometimes negative in the rest of the French Empire, in North Africa (2.1 percent of its GDP in 1911–1915, –0.8 percent in 1921–1938, and 2.5 percent after 1946) and in Sub-Saharan Africa (4 percent of its GDP in 1911–1915, –0.5 percent in 1921–1938, and –1.8 percent after 1946).
The third lesson that we can draw from Table 3, Panel B, is that, expressed as a share of the colonizer’s GDP, the colonial drain was small in France, a bit higher in the United Kingdom, and considerably higher in the Netherlands. As the population of the French Empire never reached more than twice the population of France (see Online Appendix Figure B1), the colonial drain represented only a small part of French GDP, regardless of the period: 0.4 percent in 1911–1915, 0.1 percent in 1921–1938, and 0.3 percent after 1946, of which 0.2 percent was from Indochina.Footnote 26 In the United Kingdom, the colonial drain from India, though comparable to the French Empire as a share of colonial GDP, represented a larger share of British GDP because the population size of British India was relatively larger, more than six times the population of the United Kingdom in 1925. As the population of the French Empire never reached more than twice the population of France (see Online Appendix Figure B1), the same figures never represented more than 0.2 percent of French GDP before WWII and 0.3 percent between 1946 and 1962. France had a smaller empire, so the same colonial drain relative to the empire’s income meant less relative to France’s income. Maddison’s figures for the Netherlands are much higher: since Indonesia had a very large population and the Netherlands was smaller than France, the Indonesian surplus represented sizeable amounts in terms of Dutch GDP: 8.7 percent in 1911–1915 and 8.0 percent in 1921–1938, whereas the corresponding figure for Indochina was much lower compared to French GDP.
In conclusion, on the colonies’ side, Dutch Indonesia experienced the largest colonial drain, followed by Indochina, while the drains from the other French colonies and from British India were more limited. On the side of colonizers, colonial drains had a much greater impact on the Netherlands’ economy than on those of France or the United Kingdom, due to differences in empire and population sizes.
CONCLUSION
In this paper, we estimate as precisely as possible the monetary flows between France and its colonial Empire, between 1830 (conquest of Algiers) and 1962 (independence of Algeria). At its apex, the surface area of the French Empire was 20 times the area of France, its population twice that of France, and its GDP about one-fifth. The previous historiography (Marseille Reference Marseille1984) told a story in which the French Empire received generous public and private transfers from the metropole. This narrative was at odds with the capital drain story told earlier for British India by Naoroji (Reference Naoroji1901) and confirmed, both for British India and Dutch Indonesia, by Maddison (Reference Maddison1989).
Drawing from an extensive data collection effort in the French administrative archives, we provide a precise estimate of the total amount of net transfers of public money between the French state and the colonies. We show that the Empire cost on average a little more than 1 percent of French GDP annually, and that four-fifths of this amount consisted of military expenditure. For most of the colonial period (until WWII), the overall cost of colonization averaged 0.52 percent of French GDP, which is less than what France spent in 2022 on development aid alone (0.55 percent).Footnote 27 Before WWII, even though military expenditure represented the bulk of colonial expenditure (more than four-fifths), colonial military expenditure only represented 9 percent of the French total military expenditure.
It is only after WWII that the cost of colonization boomed (to 3.2 percent of GDP on average) when France started counteracting independence movements by spending more on development and, above all, by fighting bloody wars in Indochina and Algeria. Overall, outside of independence wars, the French Empire was cheap for the French taxpayer. The cost of the colonial empire was also unequally distributed across space: the most expensive colony was the one with the highest number of French settlers, that is, Algeria, whereas Indochina cost almost nothing. Colonial transfers were very much below what is considered today an acceptable development aid target. Today, French overseas territories (Guyane, Guadeloupe, Martinique, Mayotte, Nouvelle-Calédonie, Réunion, among others) receive significant transfers from the central government, so that their level of public expenditure per capita is the same as in mainland France. Yet, these remains of the French Empire are small enough that they do not cost much (4 percent of total expenditure, while constituting 4 percent of the total population). Online Appendix D shows that perfect equalization of public expenditure per capita in the colonial empire would have meant transferring 17 to 200 times (depending on the year considered) more than what was actually disbursed.
Turning to private money flows, we show that the trade balance deficits of French colonies must be corrected by considering the military expenditure inflows if we want to make them comparable with other colonies like British India, where military expenditure was financed by local revenue. Once this correction is made, French colonies are no longer exceptions. By estimating as many posts as possible in the balance of payments between colonies and the rest of the world, we show that significant amounts of money flowed from the colonies to other countries, and particularly to France. In that respect, the French Empire looks no different from British India or from the Portuguese Empire in Africa. For sure, these comparisons across colonizers should not be over-interpreted. First, estimates of net monetary outflows are coarse and aggregate, with their multiple components remaining largely unknown.Footnote 28 Second, monetary outflows from colonies to metropoles do not summarize “colonial exploitation.” Even if they managed to repatriate their savings, Europeans’ consumption in colonies mattered as well.Footnote 29 Furthermore, the exploitation of indigenous military labor to guard the empires and their mercantile interests, and to defend the metropoles, is not considered in balance of payments accounting (e.g., Offer Reference Offer1993; Killingray and Omissi Reference Killingray and Omissi1999), regardless of how this exploitation was financed, whether by local taxes or metropolitan expenditure.