Dyes have broad uses in various industries, but their release into aqueous systems causes environmental problems. Some dyes are toxic and hazardous to public health. Crystal violet (CV) is a toxic and carcinogenic cationic dye (Yang et al., Reference Yang, Zhou, Chang and Zhang2014; Sarabadan et al., Reference Sarabadan, Bashiri and Mousavi2019b; Falaki & Bashiri, Reference Falaki and Bashiri2021; Sarabadan et al., Reference Sarabadan, Bashiri and Mousavi2021). CV has several applications in the textile, paper, medicine and plastic industries (Li, Reference Li2010).
For the purification of water, several methods have been employed and amongst them adsorption is the most used technique (Eris & Bashiri, Reference Eris and Bashiri2016; Bashiri & Nesari, Reference Bashiri and Nesari2019; Sarabadan et al., Reference Sarabadan, Bashiri and Mousavi2019a; Falaki & Bashiri, Reference Falaki and Bashiri2021; Sarabadan et al., Reference Sarabadan, Bashiri and Mousavi2021). Response surface methodology (RSM) is an operational approach to investigating the variables that affect the purification of water via absorption. It helps us to design the experiments and obtain the optimum conditions for use over the least possible time (Mousavi et al., Reference Mousavi, Salari, Niaei, Panahi and Shafiei2014; Mousavi & Nakhostin Panahi, Reference Mousavi and Nakhostin Panahi2016). We have used RSM previously to optimize CV dye adsorption on zeolite (Sarabadan et al., Reference Sarabadan, Bashiri and Mousavi2019b), zeolite–montmorillonite (Sarabadan et al., Reference Sarabadan, Bashiri and Mousavi2019a), montmorillonite–hyamine (Sarabadan et al., Reference Sarabadan, Bashiri and Mousavi2021) and montmorillonite–hyamine–sodium dodecyl sulfate (SDS) (Sarabadan et al., Reference Sarabadan, Bashiri and Mousavi2021) adsorbents.
Clay minerals are suitable adsorbents for wastewater treatment because they are non-toxic, inexpensive, available widely and have a large specific surface area (Ali et al., Reference Ali, Asim and Khan2012; Chen et al., Reference Chen, Zhou, Fiore, Tong, Zhang, Li, Ji and Yu2016). Montmorillonite (Mnt; Warr, Reference Warr2020) is a layer silicate that is suitable for the adsorption of dyes, especially cationic dyes (Zhu et al., Reference Zhu, Chen, Liu, Ge, Zhu, Zhu and He2014; Sarma et al., Reference Sarma, Sen Gupta and Bhattacharyya2016). However, untreated Mnt cannot be applied as an effective adsorbent. Previous work has investigated the adsorption capacity of clay minerals with various additives and has indicated that the adsorption of pollutants on clay minerals increases when the interlayer cations are replaced by organic cations (Carrizosa et al., Reference Carrizosa, Koskinen, Hermosin and Cornejo2001; Koh & Dixon, Reference Koh and Dixon2001; Andrades et al., Reference Andrades, Rodríguez-Cruz, Sánchez-Martín and Sánchez-Camazano2004). The Mnt layers possess a negative charge and are hydrated strongly. Cationic surfactants render the hydrophilic surface of Mnt as hydrophobic (Shirzad-Siboni et al., Reference Shirzad-Siboni, Khataee, Hassani and Karaca2015). Liu et al. (Reference Liu, Wang, Yang and Sun2011) modified Mnt using surfactants and microwave irradiation for the removal of methyl orange. Acisli et al. (Reference Acisli, Khataee, Karaca and Sheydaei2016) used Mnt modified with dodecyltrimethylammonium bromide (DTMA) to remove acid red 17 from aqueous solution, and Kıranşan et al. (Reference Kıranşan, Soltani, Hassani, Karaca and Khataee2014) investigated the removal efficiency of Mnt–cetyltrimethylammonium bromide (CTAB) for acid orange. Surfactants have various types of chains and head groups. Recently, we utilized the hyamine surfactant to modify Mnt nanoparticles for efficient dye removal from aqueous solution (Sarabadan et al., Reference Sarabadan, Bashiri and Mousavi2021). Although Mnt is a low-cost material, the presence of hyamine as an expensive surfactant renders the cost of the combined adsorbent expensive. Therefore, we decided to synthesize an adsorbent using a lower-cost surfactant. The docosyl-trimethylammonium chloride (BTAC) surfactant is cheaper than hyamine. It is a cationic surfactant with significant water solubility, non-toxicity and biodegradability.
Mnt nanoparticles have a small particle size. Although they have large specific surface area that improves their adsorption capacity, separation of the adsorbent from the whole solution is a complex process. Mnt nanoparticles cannot be separated by centrifugation at 9000 rpm from a solution. In this study, we prepared Mnt-BTAC and Mnt-BTAC-SDS to overcome these separation difficulties during CV adsorption, and the adsorption performances of two Mnts modified by BTAC and SDS were compared. In addition, the essential variables for CV removal were studied using RSM, and kinetic, equilibrium, thermodynamic and optimization studies of CV adsorption on the two surfactant-modified Mnt components were performed.
Experimental
Materials
The Mnt was purchased from Southern Clay Products, Inc. (Tx, USA). The specific gravity of Mnt nanoparticles is 0.7 g cm–3. Mnt has a cation-exchange capacity of 48 meq 100 g–1 and particle sizes of 1 nm–2 μm. The chemical composition of Mnt is 50.95% SiO2, 19.60% Al2O3, 5.62% Fe2O3, 3.29% MgO, 1.97% CaO, 0.98% Na2O, 0.86% K2O, 0.62% TiO2 and 15.45% loss on ignition. BTAC (CH3(CH2)21N(Cl)(CH3)3) with 98% purity and SDS (NaC12H25SO4) with 85% purity were purchased from Merck Co. (Germany). Figure 1 shows the molecular structures of the BTAC and SDS surfactants. CV (C25H30N3Cl) was procured from Merck; 1.00 g CV powder was dissolved in 1000 mL of deionized water.
The chemical structures of the (a) BTAC and (b) SDS surfactants.

Characterization of the surfactants
The structure of the surfactant-modified Mnt was studied using X-ray diffraction (XRD) with Cu-Kα radiation (Philips X'Pert Pro MPD diffractometer). The specific surface area of the surfactant-modified Mnt was determined using a BET Sorb Gas Adsorption Analyzer (BEL Company, Japan). Fourier-transform infrared (FTIR) absorption spectra of the surfactant-modified Mnt were collected using a Nicolet Magna 550 FTIR spectrometer. The morphology of the materials was studied using field-emission scanning electron microscopy (FE-SEM) with a TESCAN MIRA3 FE-SEM. The absorbance spectra of the materials were obtained using ultraviolet–visible light (UV–Vis) spectrophotometry with a Shimadzu model T-80 UV–Vis spectrophotometer.
Preparation of the Mnt-BTAC and Mnt-BTAC-SDS components
The purified Mnt was obtained by dispersing Mnt nanoparticles in deionized water (20 g in 400 mL) under stirring for 2 h at 1500 rpm, followed by centrifugation at 6000 rpm for 25 min and drying at 100°C for 8 h. To synthesize Mnt-BTAC component, the purified Mnt nanoparticles were dispersed in deionized water (10 g in 300 mL) and stirred for 10 h at 1000 rpm. Then, the desired amount of BTAC surfactant (20% of adsorbent weight) was slowly added and stirred at 2000 rpm for 1.5 h. Subsequently, the suspension was filtered and washed thoroughly and dried at 95°C for 12 h. To synthesize the Mnt-BTAC-SDS component, 10 g of the purified Mnt was dispersed in 300 mL of deionized water under stirring (1000 rpm) at 70°C for 1.5 h. Then, 6 g of BTAC surfactant was slowly added under stirring (2000 rpm) at 70°C for 2 h. Subsequently, 2.4 g of SDS surfactant was added under stirring for 1.5 h. The mixture was filtered, washed thoroughly and dried at 95°C for 12 h.
Adsorption experiments
For the equilibrium study of CV removal by Mnt-BTAC, 50 mL of dye solution at concentrations of 10–90 mg L–1 were added to 50 mL of Mnt-BTAC and stirred in a shaker at 130 rpm for 24 h. For the equilibrium study of CV removal by Mnt-BTAC-SDS, 50 mL of dye solution at concentrations of 10–100 mg L–1 and 0.98 g L–1 of Mnt-BTAC-SDS were stirred in a shaker at 130 rpm for 24 h. For the study of the adsorption kinetics, 1.00 g L–1 of Mnt-BTAC or 0.98 g L–1 of Mnt-BTAC-SDS were added to 50 mL of CV solution at concentrations of 4, 6, 8 or 10 mg L–1. The solutions were placed in a shaker and stirred at 130 rpm for 300 min. For a detailed description of the equilibrium and kinetics studies, see our previous study (Sarabadan et al., Reference Sarabadan, Bashiri and Mousavi2019a).
Experimental design
To determine the importance of various variables on CV removal efficiency, we used the central composite design (CCD) method. Four variables were examined: pH (A), temperature (B), concentration of adsorbent (C) and CV concentration (D). Their actual values are presented in Table 1. For the two Mnts modified by BTAC and SDS, 30 experimental runs were performed. The dye-removal efficiencies achieved for the Mnt-BTAC and Mnt-BTAC-SDS components were 92.50–99.95% and 81.00–99.47%, respectively (Table 2). The relationship between the response and the variables is given in Equation 1:

where y is the response, β0, βi, βii and βij are a constant, the linear effect term, the quadratic effect and the interaction effect term, respectively, xi and xj are variables and ɛ is the residual of the model.
The experimental levels of the variables for the Mnts modified with BTAC and SDS.

CCD matrix and the response values for the Mnts modified with BTAC and SDS.

Results and discussion
Characteristics of the surfactant-modified Mnts
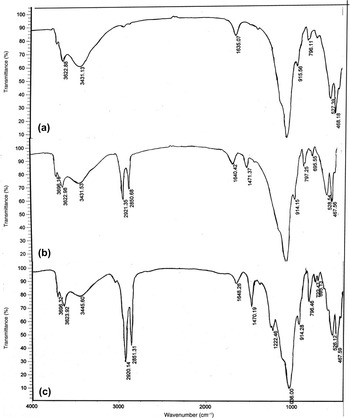
The FTIR spectra of Mnt nanoparticles (Sarabadan et al., Reference Sarabadan, Bashiri and Mousavi2021), Mnt-BTAC and Mnt-BTAC-SDS are presented in Fig. 2. For Mnt nanoparticles, a broad band at ~3429 cm–1 is attributed to stretching vibrations of H2O. The band at 1635 cm–1 in Mnt-BTAC is due to H–O–H bending. In the case of Mnt nanoparticles, the band at 900–1100 cm–1 is attributed to Si–O stretching (Santhana Krishna Kumar et al., Reference Santhana Krishna Kumar, Ramachandran, Kalidhasan, Rajesh and Rajesh2012). In Mnt-BTAC, the bands at 2921 and 2850 cm–1 are assigned to C–H stretching. The lack of these bands in the spectrum of Mnt nanoparticles and the sharp band at 1471 cm–1 in the Mnt-BTAC spectrum indicate the existence of BTAC molecules in the Mnt-BTAC component. In Mnt-BTAC-SDS, the increased intensities of the bands at 2921 and 2850 cm–1 are attributed to C–H stretching in the BTAC and SDS molecules having increased.
FTIR spectra of (a) Mnt nanoparticles, (b) Mnt-BTAC and (c) Mnt-BTAC-SDS.

The XRD traces of Mnt nanoparticles (Sarabadan et al., Reference Sarabadan, Bashiri and Mousavi2021), Mnt-BTAC and Mnt-BTAC-SDS are shown in Fig. 3. By adding BTAC and SDS surfactants, the intensities of the main reflections decrease. In addition, the reflection at 7°2θ in Mnt nanoparticles is not present in the traces of Mnt modified with BTAC and SDS because Na+ ions in Mnt nanoparticles are replaced by BTAC molecules (Shirzad-Siboni et al., Reference Shirzad-Siboni, Khataee, Hassani and Karaca2015). The reflections in the XRD traces of Mnt nanoparticles and surfactant-modified Mnt at 22.5°2θ are attributed to gypsum and the reflections at 27.5°2θ are due to quartz.
XRD traces of (a) Mnt nanoparticles, (b) Mnt-BTAC and (c) Mnt-BTAC-SDS.

The N2 adsorption–desorption analysis results for the Mnts modified by BTAC and SDS are presented in Table 3. For Mnt-BTAC, the Brunauer–Emmett–Teller (BET) surface area and total pore volume are 7 m2 g–1 and 0.058 cm3 g–1, respectively, and the mean pore diameter is 34.9 nm. For Mnt-BTAC-SDS, the BET surface area and total pore volume are 4 m2 g–1 and 0.024 cm3 g–1, respectively, and the mean pore diameter is 22.5 nm. The N2 adsorption–desorption isotherms of the two modified Mnt components are classified as type V according to the International Union of Pure and Applied Chemistry (IUPAC) classification system (Fig. 4). Therefore, these are mesoporous materials with not well-defined pore shapes (Park et al., Reference Park, Ayoko, Kurdi, Horváth, Kristóf and Frost2013). Mnt-BTAC has a larger specific surface area than Mnt-BTAC-SDS, while Mnt-BTAC-SDS has a larger adsorption capacity than Mnt-BTAC. The anionic SDS molecules interact with cationic CV molecules, thereby contributing to dye adsorption on Mnt-BTAC-SDS.
N2 adsorption–desorption isotherms of Mnt-BTAC and Mnt-BTAC-SDS. STP = standard temperature and pressure. ADS = adsorption; DES = desorption.

The specific surface area and total pore volume of the Mnts modified with BTAC and SDS.

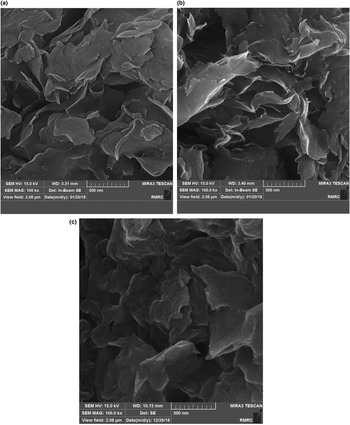
The surface morphology and particle sizes of the two modified Mnts were studied using FE-SEM. FE-SEM images of Mnt nanoparticles (Sarabadan et al., Reference Sarabadan, Bashiri and Mousavi2021), Mnt-BTAC and Mnt-BTAC-SDS are shown in Fig. 5. The Mnt nanoparticle sheets are thicker than those of Mnt-BTAC and Mnt-BTAC-SDS. After modification, the Mnt structure changes to an irregular-layered structure, indicating an increase of the Mnt surface area due to the modification. The thickness of Mnt particles is ~5–10 nm (Fig. 5a)
FE-SEM images of (a) Mnt nanoparticles, (b) Mnt-BTAC and (c) Mnt-BTAC-SDS.

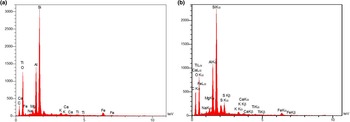
Energy-dispersive X-ray analysis (EDX) spectra of Mnt modified with BTAC and SDS are shown in Fig. 6. For Mnt-BTAC, the weight percentages of C, O, Si, Fe, Al, K, Ca, Mg and Ti are 27.2, 42.3, 17.8, 3.4, 7.8, 0.48, 0.26, 0.35 and 0.21 wt.%, respectively, while Na is absent. For Mnt-BTAC-SDS, the weight percentages of O, C, Si, S, Al, Fe, Mg, K, Ti, Ca and Na are 32.3, 43.2, 12.8, 1.97, 5.9, 1.8, 0.58, 0.64, 0.22, 0.30 and 0.17 wt.%, respectively. The Na concentration in Mnt nanoparticles is 0.80 wt.%, which decreases in Mnt-BTAC and Mnt-BTAC-SDS. The Na+ ions in the Mnt layers are replaced by the surfactants through their addition to the Mnt nanoparticles. BTAC is a cationic surfactant and so it can be replaced by Na+ ions in the Mnt layers via cation exchange.
EDX spectra of (a) Mnt-BTAC and (b) Mnt-BTAC-SDS.

RSM analysis
Regression model equation and statistical analysis. A quadratic model was generated to demonstrate the correlations between the four variables and the response. The equations obtained for the Mnts modified with BTAC and SDS are given in Equations 2 and 3:


These equations for the Mnts modified with BTAC and SDS show that the variables A, B and C have positive effects on the response, with pH (A) having the greatest contribution. The D variable has a negative effect on the response.
ANOVA results. The results of the analysis of variance are presented in Tables 4 & 5. A P-value > 0.1 suggests that the terms of the model are not significant, whereas a P-value < 0.0001 indicates that the model terms are highly significant. For CV adsorption on Mnt modified with BTAC and SDS, the F-values are 15.61 and 16.89, respectively, and the P-values are <0.0001 (Tables 4 & 5), implying that the model used to design the experiments is significant. For Mnt-BTAC, the A, B, C, AC, A 2 and C 2 model terms are significant, while for Mnt-BTAC-SDS, the A, C, D, BC, A 2, C 2 and D 2 model terms are significant. The low coefficient of variation values (0.74% for Mnt-BTAC and 1.70% for Mnt-BTAC-SDS) indicate that the experiments are accurate. The predicted R 2 values for Mnt-BTAC (0.6883) and Mnt-BTAC-SDS (0.6861) are in reasonable agreement with the adjusted R 2 values of 0.8759 and 0.8847, respectively. In addition, the R 2 values obtained for Mnt modified with BTAC and SDS are 0.9358 and 0.9404, respectively.
ANOVA for Mnt-BTAC.

ANOVA for Mnt-BTAC-SDS.

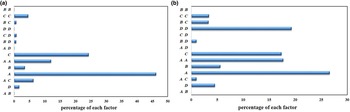
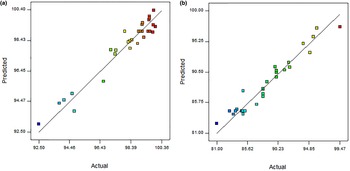
The percentage effect of each variable on dye-removal efficiency was investigated using Pareto analysis. The Pareto analyses for Mnt-BTAC and Mnt-BTAC-SDS show that pH is the variable that has the greatest impact on CV removal (Fig. 7). The actual values obtained from a specific run and the predicted values calculated from the models of the Mnts modified with BTAC and SDS are distributed along a reasonably straight line (Fig. 8), indicating good agreement between the predicted and observed values.
Pareto graphical analyses of (a) Mnt-BTAC and (b) Mnt-BTAC-SDS.

The predicted vs actual data for (a) Mnt-BTAC and (b) Mnt-BTAC-SDS.

CCD plots
The perturbation plots from the selected models for Mnt-BTAC and Mnt-BTAC-SDS also show that pH is the variable that has the greatest impact on CV removal. In addition, the concentration of adsorbent, temperature and pH have positive effects on CV removal. In contrast, the CV concentration has a negative influence on CV removal (Fig. 9).
The effect of pH (A), temperature (B), concentration of adsorbent (C) and CV concentration (D) on dye removal (R%) by (a) Mnt-BTAC and (b) Mnt-BTAC-SDS.

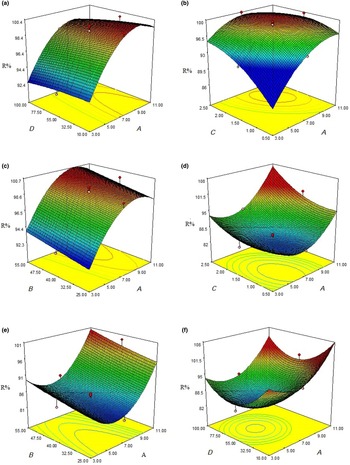
The CCD plots indicate the importance of the various variables for the response of CV removal (Agarwal et al., Reference Agarwal, Tyagi, Gupta, Dastkhoon, Ghaedi, Yousefi and Asfaram2016). Figure 10 shows the response surface plots for Mnt-BTAC and Mnt-BTAC-SDS. The pH, temperature, concentration of adsorbent and CV concentration are marked as A, B, C and D, respectively. Dye adsorption increases with pH and temperature (Fig. 10a,d). With increasing pH and temperature, the number of negative sites for adsorbents increases, thereby increasing the adsorption of the cationic CV dye. The plot of the interactive effect of pH and concentration of adsorbent (Fig. 10b,e) shows that dye removal increases with concentration of adsorbent because of the large number of active sites. The interacting influence of pH and CV concentration shows that dye removal increases with decreasing CV concentration (Fig. 10c,f). In addition, temperature and concentration of absorbent of have positive effects on CV adsorption, whereas the CV concentration has a negative effect on dye adsorption (data not shown). When dye concentration increases at a constant concentration of adsorbent, the adsorbent sites decrease gradually, and so the dye-removal efficiency decreases. Elliptical or saddle-like contour plots demonstrate that the interaction between the variables is significant, whereas circular contour plots indicate an insignificant interaction between variables. For Mnt-BTAC, the contour plots have elliptical or saddle-like shapes, and so the interactions between the various variables are significant. For Mnt-BTAC-SDS, the contour plot for the interaction of pH and dye concentration is circular, suggesting an insignificant interaction. The interactions between the remaining variables for Mnt-BTAC-SDS are significant.
Response surface and counter plots for Mnt-BTAC (a,b,c) and Mnt-BTAC-SDS (d,e,f): pH (A), temperature (B), concentration of adsorbent (C), CV concentration (D) and dye removal efficiency (R%).

Optimization adsorption conditions
Optimization analysis was performed using Design Expert 7.0 software to obtain the values of the influential variables that maximize the dye-removal efficiency. For Mnt-BTAC, total dye removal (100%) was observed at pH 9, concentration of adsorbent 1 g L–1, temperature 25°C and CV concentration 50 mg L–1. The optimum CV concentration for the Mnt–hyamine adsorbent has been reported as 30 mg L–1 (Sarabadan et al., Reference Sarabadan, Bashiri and Mousavi2021). At optimum conditions, Mnt-BTAC was more effective for CV removal than Mnt–hyamine.
For Mnt-BTAC-SDS, total dye removal was observed at pH 10.1, temperature 33.3°C, concentration of adsorbent 0.98 g L–1 and CV concentration 10.44 mg L–1. Desirability values of 1.00 (indicating an ideal response) were obtained at these optimum conditions.
Adsorption isotherms
Equilibrium studies for CV adsorption on Mnt-BTAC were performed for the solutions with CV concentrations of 10–90 mg L–1 at the optimal values of temperature, pH and Mnt-BTAC concentration. The equilibrium experiments for CV adsorption on Mnt-BTAC-SDS were performed at the optimal conditions for the solutions with concentrations of 10–100 mg L–1. Figure 11 shows the CV adsorption isotherms for Mnt-BTAC and Mnt-BTAC-SDS.
The CV adsorption isotherm on (a) Mnt-BTAC and (b) Mnt-BTAC-SDS at optimum conditions.

Non-linear fitting of isotherms was performed using Flory–Huggins (Febrianto et al., Reference Febrianto, Kosasih, Sunarso, Ju, Indraswati and Ismadji2009), Langmuir (Langmuir, Reference Langmuir1916), Redlich–Peterson (Febrianto et al., Reference Febrianto, Kosasih, Sunarso, Ju, Indraswati and Ismadji2009), Freundlich (Freundlich, Reference Freundlich1907), Sips (Sips, Reference Sips1948) and Temkin (Temkin & Pyzhev, Reference Temkin and Pyzhev1940) isotherms. The equations for the adsorption isotherms are shown in Equations 4–9:


The Langmuir isotherm assumes a homogeneous surface for the adsorbent and the Sips and Freundlich isotherms are used for heterogeneous surfaces. In these isotherms, q e (mg g–1) is the adsorbed CV on the surface, C e (mg L–1) is the CV equilibrium concentration, q max (mg g–1) is the maximum adsorption capacity, n is an empirical constant related to surface heterogeneity and KL, KF, KLF and KFH are the Langmuir, Freundlich, Sips and Flory–Huggins constants. B1 is a constant related to the heat of adsorption. A1 is the Temkin equilibrium isotherm constant. The Redlich–Peterson model assumes both monolayer and multilayer adsorption and g, A and B are the Redlich–Peterson constants.
The equilibrium data for CV adsorption on the two surfactant-modified Mnts have been fitted with isotherm equations (Table 6). The goodness of fit of the equilibrium data to the isotherms for both Mnt-BTAC and Mnt-BTAC-SDS is according to the following order: Temkin > Sips > Redlich–Peterson. For both surfactant-modified Mnt components, the Temkin isotherms assumes that the heat of adsorption decreases linearly with loading due to adsorbate–adsorbent interactions (Foo & Hameed, Reference Foo and Hameed2010). The maximum adsorption capacities of Mnt-BTAC and Mnt-BTAC-SDS for CV (267.16 and 321.48 mg g–1, respectively) were obtained using the Sips isotherm at 25°C. Therefore, Mnt-BTAC-SDS has a greater adsorption capacity for CV compared to Mnt-BTAC.
The fitting parameters of the adsorption isotherms for CV adsorption on Mnt-BTAC and Mnt-BTAC-SDS.

Kinetic models
Kinetic studies of CV adsorption on the two surfactant-modified Mnts were carried out at optimum conditions. The results are shown in Fig. 12.
Kinetic adsorption data of CV dye on (a) Mnt-BTAC and (b) Mnt-BTAC-SDS at optimum conditions.

The pseudo-first order (PFO) (Lagergren, Reference Lagergren1898), pseudo-second order (PSO) (Ho, Reference Ho2006), Elovich (Zeldowitsch, Reference Zeldowitsch1934), modified pseudo-first order (MPFO) (Yang & Al-Duri, Reference Yang and Al-Duri2005; Azizian & Bashiri, Reference Azizian and Bashiri2008), intraparticle diffusion (ID) (Weber & Morris, Reference Weber and Morris1963), integrated kinetics Langmuir (IKL) (Marczewski, Reference Marczewski2010) and fractal-like integrated kinetics Langmuir (FL-IKL) (Haerifar & Azizian, Reference Haerifar and Azizian2012) kinetic models were tested in this study. Most similar studies in the past have used linear fitting for the kinetic models. However, it has been shown recently that application of linear fitting to kinetic models might be erroneous (Simonin, Reference Simonin2016), so we applied non-linear fitting for our kinetic study, as shown in Equations 10–16:


where q is the amount of adsorbed CV onto surfactant-modified Mnt components and k1, k2, km, ki, kL and kFL are the rate constants for the PFO, PSO, MPFO, ID, IKL, and FL-IKL kinetic models, respectively, t is the adsorption time and I is a constant parameter. In the Elovich kinetic model, α is the adsorption rate at the beginning of adsorption and β is constant related to the extent of surface coverage and activation energy for chemisorption. In the IKL and FL-IKL equations, a, n and f are constants.
The kinetic parameters and coefficients of determination for CV adsorption on the two surfactant-modified Mnts are listed in Tables 7 & 8. The IKL and FL-IKL kinetic models fit the kinetics data more accurately. In addition, the comparison of the R 2 values of the various kinetic models for both modified Mnt components indicates that the FL-IKL model (R 2 > 0.99) is the most suitable. Therefore, the adsorbents have heterogeneous and porous surfaces (Bashiri & Javanmardi, Reference Bashiri and Javanmardi2021).
Kinetic parameters of CV adsorption on Mnt-BTAC.

Kinetic parameters of CV adsorption on Mnt-BTAC-SDS.

Thermodynamic studies
Equations 17 and 18 were used to calculate the thermodynamic parameters of CV adsorption:


where R is the universal gas constant, T is absolute temperature and Kc is a dimensionless equilibrium constant calculated from the Langmuir constant (Tran et al., Reference Tran, You and Chao2016). The thermodynamic parameters of Mnt modified with BTAC and SDS were determined from the slopes of the straight lines in Fig. 13 and are listed in Table 9. The low and positive values of ΔH° for CV adsorption on the surfactant-modified Mnts indicate physical and endothermic adsorption. This is in accordance with increased CV adsorption at greater temperatures. The positive ΔS° values for the surfactant-modified Mnts confirmed the increased disorder in solution during adsorption. The ΔG° values for the surfactant-modified Mnts are negative, reflecting the spontaneity of the adsorption processes.
The plot of lnKc vs 1/T for Mnt-BTAC and Mnt-BTAC-SDS.

Thermodynamic data of CV removal by Mnt-BTAC and Mnt-BTAC-SDS.

Comparison with other adsorbents
Table 10 shows the maximum adsorption capacity of CV by Mnt nanoparticles, the surfactant-modified Mnts (this work) and other adsorbents reported in the literature (Senthilkumaar et al., Reference Senthilkumaar, Kalaamani and Subburaam2006; Nandi et al., Reference Nandi, Goswami, Das, Mondal and Purkait2008; Bertolini et al., Reference Bertolini, Izidoro, Magdalena and Fungaro2013; Satapathy & Das, Reference Satapathy and Das2014; Yang et al., Reference Yang, Zhou, Chang and Zhang2014; Amodu et al., Reference Amodu, Ojumu, Ntwampe and Ayanda2015; Alipanahpour Dila et al., Reference Alipanahpour Dila, Ghaedi, Ghaedi, Asfaram, Jamshidi and Purkait2016; Ishaq et al., Reference Ishaq, Javed, Amad, Ullah, Hadi and Sultan2016; Sarabadan et al., Reference Sarabadan, Bashiri and Mousavi2021). The maximum adsorption capacity of Mnt-BTAC-SDS is greater than those of some synthesized adsorbents that are expensive or difficult to prepare. The maximum adsorption capacity of Mnt nanoparticles for CV (616.07 mg g–1) is greater than those of Mnt-BTAC (267.16 mg g–1) and Mnt-BTAC-SDS (321.48 mg g–1). Although Mnt nanoparticles have a large adsorption capacity, their separation from solution is difficult and requires ultra-high-speed centrifugation. Therefore, Mnt-BTAC-SDS could represent an affordable adsorbent for CV removal from aqueous solutions.
Maximum CV adsorption capacities of various adsorbents.

Summary and conclusions
This study aimed to modify Mnt nanoparticles first with BTAC surfactant and then with BTAC and SDS surfactants. The variables that control CV removal by the surfactant-modified adsorbents were optimized. The structure and morphology of the surfactant-modified Mnts were studied using FTIR, XRD, BET, FE-SEM and EDX analysis. RSM was used to indicate the importance of the variables pH, temperature, concentration of adsorbent and CV concentration in terms of dye removal. For Mnt-BTAC, CV adsorption was optimized at pH 9, temperature 25°C, concentration of adsorbent 1 g L–1 and CV concentration 50 mg L–1. For Mnt-BTAC-SDS, CV adsorption was optimized at pH 10.1, temperature 33.29°C, concentration of adsorbent 0.98 g L–1 and CV concentration 10.44 mg L–1. pH is the variable that has the greatest impact on CV adsorption. pH, temperature and concentration of adsorbent have positive impacts on CV removal and CV concentration has a negative impact on CV removal. The equilibrium and kinetic data of CV adsorption onto Mnt-BTAC and Mnt-BTAC-SDS best fit the Temkin and FL-IKL models. CV adsorption on these two surfactant-modified Mnts was endothermic and physisorption. The maximum adsorption capacities of the modified Mnts were compared with those of other adsorbents. Mnt-BTAC-SDS could represent a suitable CV adsorbent and might be beneficial in wastewater purification.
Financial support
The authors thank the University of Kashan for supporting this work through grant no. 785108/9.