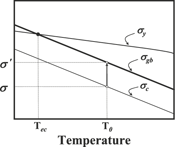
 , where t
I. INTRODUCTION
Effects of applied stress on grain boundary segregation behavior of solute atoms have been first investigated in some studies.Reference Shinoda and Nakamura1, Reference Misra2 When a tensile stress is applied to the specimen that the equilibrium grain boundary segregation concentration of the solute atoms at a temperature has established, the grain boundary segregation concentration of the solute atoms continues to increase to a maximum, after which it decreases gradually to restore the original segregation concentration. Based on a research,Reference Shinoda and Nakamura1 it is observed that the tensile stress enhances the grain boundary segregation kinetics of the solute atoms through its influence on the bulk diffusivity and promotes the capability of the grain boundaries to absorb the solute atoms. Meanwhile, a compressive stress results in the opposite segregation behaviorReference Shinoda and Nakamura1 of the solute atoms, and the bismuth segregationReference Lee and Chiang3 at zinc-oxide grain boundaries is nearly suppressed under a high hydrostatic pressure (∼1 GPa).
The research on the effects of tensile stress on grain boundary segregation behavior of the solute atoms was originally motivated by the occurrence of stress relief cracking of low alloy steels.Reference Hippsley, Knott and Edwards4–Reference Chuang, Kagawa, Rice and Sills8 Reheat or stress relief cracking in heat-resistant alloys has been explained by the combination of a precipitation-strengthened matrix and a soft depleted zone formed adjacent to prior austenite grain boundariesReference Bailey9–Reference Nawrocki, Dupont, Robino, Puskar and Marder12 or by the prior austenite grain boundary segregation of the solute atoms including P.Reference Hippsley, Knott and Edwards4, Reference Raj and Ashby7, Reference Chuang, Kagawa, Rice and Sills8, Reference Shin and McMahon13–Reference Weng and McMahon17 In the former mechanism, the precipitation of M3C and M23C6 forms a C- and Cr-depleted zone along the earlier austenite grain boundaries. Also, interior of the grain is strengthened by the precipitation of fine MC (M=W, Mo, V and Nb) carbides. Therefore, most of the strain that results from a residual or thermal stress is concentrated on the soft depleted zone, causing the intergranular cracking, in which the cracked surface includes many dimples. In the latter mechanism, the segregation of the solute atoms to the prior austenite grain boundaries is known to cause the intergranular cracking by lowering a cohesive strength of the grain boundaries. Although several authors have proposed that the elevated temperature intergranular cracking occurs through the development of closely spaced voids at the grain boundaries oriented normal to the tensile stress,Reference Hull and Rimmer5, Reference Speight and Harris6, Reference Van Der Brug, Van Der Giessen and Brouwer18, Reference Raj19 the intergranular cracking mechanism is not clear yet.
The purpose of this study was to investigate the interfacial segregation behavior of solute atoms under tensile stress and the elevated-temperature intergranular cracking behavior in a 2.25Cr1.5W heat-resistant alloy.
II. EXPERIMENTAL
A 2.25 Cr1.5 W heat-resistant alloy ingot of 6 kg was prepared using a vacuum induction melting process. The chemical composition of the alloy is shown in Table I. The ingot was homogenized at 1200 °C for 1 h and forged to 12-mm thick plates. Unnotched and cylindrical rupture test specimens with a thread-head of 11-mm diameter and a gauge with a length of 15 mm and a diameter of 6 mm were computer numerical control–machined from the plates. The specimens were austenitized at 1050 °C for 1 h under a vacuum of about 10−2 Torr and water-quenched for obtaining a martensitic structure in the matrix. Rupture tests were performed in air using conventional creep test machines at a temperature range of 575–700 °C and a stress range of 75–300 MPa. The specimens to which the N-type thermocouple was attached were heated to the test temperature at a heating rate of 1200 °C/h. Fracture surfaces of the ruptured specimens and reduction in area (RA) were examined using a scanning electron microscope (SEM) after ultrasonic cleaning. The segregation behavior of solute atoms was investigated using a PHI700 Auger electron spectrometer (AES). The AES specimens machined from the ruptured specimens in the tensile stress direction were chilled with liquid nitrogen for ∼30 min and then impact-fractured in a vacuum of about 7 × 10⁻¹⁰ Torr or better to minimize the post-fracture contamination. Grain boundary facets or carbide interfaces more than 10 locations were investigated. Peak-to-peak height ratios (I/I Fe) were obtained from each differential Auger spectrograph and then averaged. The AES peaks used were Fe703, P120, S152, C271, W179, and Cr529.
The chemical composition of the prepared alloy (wt%).

III. RESULTS AND DISCUSSION
A. Time-to-failure under tensile stress
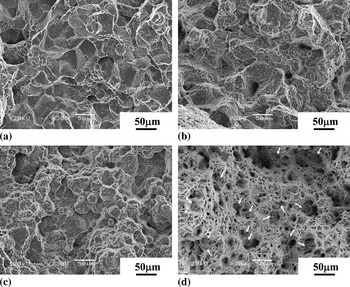
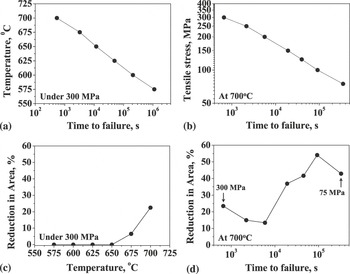
Figure 1 shows fracture surfaces of the various specimens after rupture. As shown in Figs. 1(a) and 1(b), the fracture mode under 300 MPa was changed from intergranular + dimples to quasi-intergranular as the temperature increased from 600 to 700 °C. As shown in Figs. 1(c) and 1(d), the fracture mode at 700 °C was changed from intergranular to ductile with decreasing tensile stress. As identified by arrows, several areas, which are different from the typical ductile fracture mode, are observed in Fig. 1(d). Changes in time-to-failure and RA with temperature and tensile stress are shown in Fig. 2. The time-to-failure increased with decreasing temperature and tensile stress, as shown in Figs. 2(a) and 2(b). Under 300 MPa, the specimens showed zero ductility in the temperature range of 575–650 °C, but the ductility increased with further increase in temperature, as shown in Fig. 2(c). At 700 °C, the specimens showed a considerable ductility under tensile stress, although a minimum in ductility was observed under 200 MPa, as shown in Fig. 2(d).
The fracture surfaces of the various specimens after rupture: (a) the 600 °C-300 MPa condition, (b) the 700 °C-300 MPa condition, (c) the 700 °C-200 MPa condition, and (d) the 700 °C-100 MPa condition.

Changes in time-to-failure and reduction in area (RA) with temperature and tensile stress: (a) the time to failure under 300 MPa, (b) the time to failure at 700 °C, (c) RA under 300 MPa, and (d) RA at 700 °C.

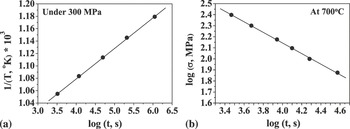
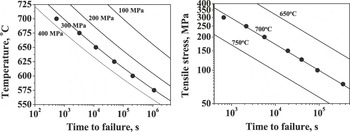
Figure 3 shows plots of 1/T versus log t and log σ versus log t, which are obtained from Figs. 2(a) and 2(b). The time to failure in a log scale was proportional to Q/RT and was inversely proportional to the tensile stress in a log scale. That is, log t ∝ Q/RT and log t ∝ –n log σ. Consequently, t = t 0σ −n exp(Q/RT), where t 0 is the constant of proportionality, n is the stress exponent, and Q is the activation enthalpy. Table II shows the determined t 0, Q, and n. Here Q and n were evaluated from Figs. 3(a) and 3(b), and the averaged t 0 was obtained using the evaluated Q and n and the experimental data of Figs. 3(a) and 3(b). Changes in time-to-failure with temperature and tensile stress were calculated using the constants of Table II, as shown in Fig. 4. The calculated results were consistent with the experimental results and show additionally that the time-to-failure increases abruptly with decreasing stress and temperature.
Plots of 1/T versus log t and log σ versus log t: (a) 1/T versus log t plot obtained from Figs. 2(a), (b) log σ versus log t plot obtained from Fig. 2(b).

The consistency between the calculated results and the experimental results. Here, the lines and the symbols denote the calculated results and the experimental results of Figs. 2(a) and 2(b), respectively.

The evaluated values of the constants in t = t 0σ −n exp(Q/RT).

B. Interfacial segregation behavior of solute atoms and nature of dimples observed at elevated-temperature intergranular fracture surfaces
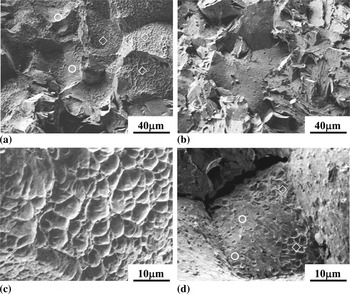
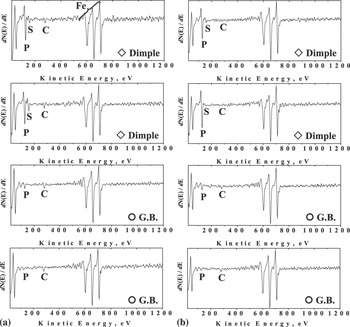
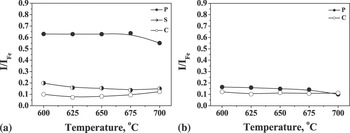
Figure 5 shows the fracture surfaces investigated by AES. The fracture surfaces were composed of smooth grain boundaries and dimples. The area fraction of the dimples was higher at 600 °C than at 700 °C. Representative Auger electron spectrographs, which were obtained from the fracture surfaces of Fig. 5, are shown in Fig. 6. Surprisingly, the segregation concentration of phosphorus was much higher in the dimples than at the smooth grain boundaries, irrespective of temperature. Changes in segregation concentration of the solute atoms with temperature are summarized in Fig. 7. The segregation concentration of phosphorus in the dimples under 300 MPa was about three times higher than that at the smooth grain boundaries. The segregation behavior of sulfur was observed only in the dimples, whereas the segregation behavior of carbon in the dimples and at the grain boundaries was similar. It is strongly suggested that the dimples observed usually at grain boundary fracture surfaces of samples broken at elevated temperatures are not the micro-ductile fracture areasReference Bailey9 but the interfaces between the grain boundary carbides and the neighboring grains.
The fracture surfaces investigated by Auger electron spectrometer: (a) the 600 °C-300 MPa condition, (b) the 700 °C-300 MPa condition, (c) the high magnification image of (a), and (d) the high magnification image of (b).

Auger electron spectrographs: (a) the 600 °C-300 MPa condition and (b) the 700 °C-300 MPa condition.

Changes in segregation concentration of solute atoms with temperature: (a) dimples and (b) smooth grain boundaries.

Considering that the distance between atoms in the broken surface pair is infinite, the surface energy is much higher than the grain boundary energy.Reference Hondros and Seah20, Reference Lea and Seah21 This is because the grain boundary may be treated as a kind of interface at which the average distance between the outermost atoms of two grains is longer than the equilibrium atomic distance. Therefore, the more active segregation of impurities occurs at the free surface. Furthermore, the incoherent grain boundary carbide interface may be considered to be a quasi-free surface at which the atomic bond between the outermost atoms of the carbide surface and the neighboring grain is relatively weak. If it is assumed that the carbide interface energy at the grain boundaries is higher than the grain boundary energy, then this can explain the strong segregation tendency of the impurities to the grain boundary carbide interface under tensile stress, as shown in Figs. 6 and 7.
C. Equicohesive temperature (T ec) and elevated-temperature intergranular cracking
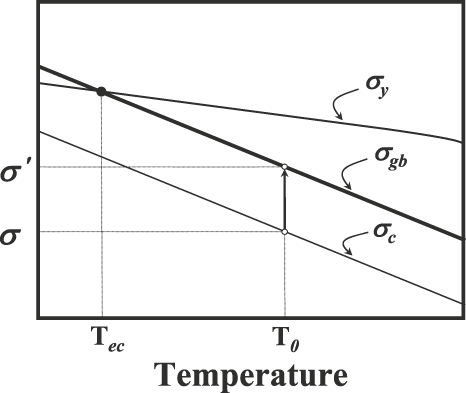
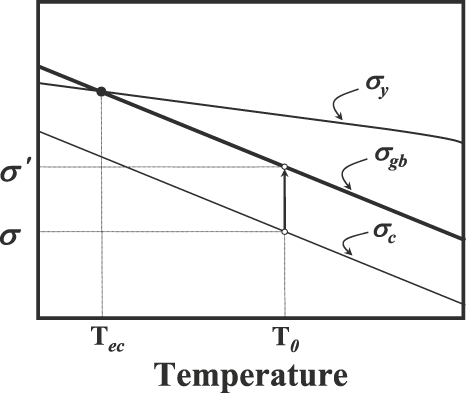
The temperature at which the yield strength is the same as the grain boundary strength is called the equicohesive temperature (T ec).Reference Grant22 This is shown schematically in Fig. 8. Therefore, the fracture mode at elevated temperatures is basically ductile below T ec and intergranular above T ec. During the rupture test at T 0 (T ec < T 0) under the tensile stress σ 0, the yield strength will continue to decrease with increasing time owing to the phenomenon of tempering. The strengths of the grain boundaries and the interfaces between the grain boundary carbides and the neighboring grains will also decrease with increasing time because of the embrittlement caused by the segregation of the impurities. Because the interface strength decreases more rapidly due to the active segregation of the impurities to the interfaces, the carbide interfaces should be first fractured when the interface strength drops to the tensile stress σ. The tensile stress that the carbide-free grain boundaries experience after the interfaces are cracked will increase from σ to σ′ due to the decrease in grain boundary area. When the carbide-free grain boundary strength σ gb drops to the stress σ 0′, the intergranular cracking occurs eventually. Figure 1(a) shows such a fracture surface that is composed of the interfaces between the grain boundary carbides and the neighboring grains and the carbide-free grain boundaries. If the decreasing rate of yield strength to σ′ is more rapid than that of the carbide-free grain boundary strength, it will cause T 0 < T ec. As a result, the fracture mode of the remaining carbide-free grain boundaries will become ductile, as shown in Fig. 1(d). Figure 1(d) also shows traces of the grain boundary carbide interfaces that were first fractured when the interface strength dropped to the tensile stress σ.
A simplified schematic diagram for explaining the mechanism of elevated-temperature intergranular cracking.
IV. SUMMARY
Effects of tensile stress on interfacial segregation of solute atoms and elevated-temperature intergranular cracking have been investigated through simple rupture tests in a 2.25Cr1.5W heat-resistant alloy. The time to intergranular failure t can be expressed by t 0σ −n exp(Q/RT), where t 0 is the constant of proportionality of 3.17 × 10⁻⁸ s, n is the stress exponent of 4.23, and Q is the activation enthalpy of 93.3 kcal/mol. The dimples observed at elevated-temperature intergranular fracture surfaces are the interfaces between the grain boundary carbides and the neighboring grains. The segregation concentration of phosphorus at the grain boundary carbide interfaces is about three times higher than that at the carbide-free grain boundaries. Under tensile stress, the elevated temperature intergranular cracking occurs through the eventual carbide-free grain boundary cracking following the decohesion of grain boundary carbide interfaces.
ACKNOWLEDGMENTS
This work was supported by the Power Generation & Electricity Delivery of the Korea Institute of Energy Technology Evaluation and Planning (KETEP) grant funded by the Korea government Ministry of Knowledge Economy (No. R-2007-1-001-02). We also thank J.H. Yoon from Korea Institute of Science and Technology for AES analyses.