Well-coagulating (GC) milk, i.e. with a quick onset of coagulation and high curd firmness, has been associated with increased cheese yield compared with poorly-coagulating (PC) milk (Bynum & Olson, Reference Bynum and Olson1982; Riddell-Lawrence & Hicks, Reference Riddell-Lawrence and Hicks1989), whereas milk that does not coagulate at all would be detrimental in cheese production. The occurrence of non-coagulating (NC) milk samples has been reported in many studies since the 1920's (Koestler, Reference Koestler1925; Claesson, Reference Claesson1965; Losi et al. Reference Losi, Castagnetti, Morini, Resmini, Volonterio and Mariani1982; Okigbo et al. Reference Okigbo, Richardson, Brown and Ernstrom1985c; Tervala & Antila, Reference Tervala and Antila1985; Ikonen et al. Reference Ikonen, Ahlfors, Kempe, Ojala and Ruottinen1999a; Ikonen et al. Reference Ikonen, Morri, Tyrisevä, Ruottinen and Ojala2004; Wedholm et al. Reference Wedholm, Larsen, Lindmark-Månsson, Karlsson and Andrén2006; Hallén et al. Reference Hallén, Allmere, Näslund, Andrén and Lundén2007; Jõudu et al. Reference Jõudu, Henno, Varv, Kaart, Kart and Kalamees2007; Cassandro et al. Reference Cassandro, Comin, Ojala, Dal Zotto, De Marchi, Gallo, Carnier and Bittante2008; Comin et al. Reference Comin, Cassandro, Chessa, Ojala, Dal Zotto, De Marchi, Carnier, Gallo, Pagnacco and Bittante2008). Apart from NC milk that can be explained by cows being in very late lactation (Flüeler, Reference Flüeler1978; Okigbo et al. Reference Okigbo, Richardson, Brown and Ernstrom1985c) or having mastitis (Koestler, Reference Koestler1925; Okigbo et al. Reference Okigbo, Richardson, Brown and Ernstrom1985a), the phenomenon is prevalent also in healthy cows in mid-lactation (Tyrisevä et al. Reference Tyrisevä, Ikonen and Ojala2003; Ikonen et al. Reference Ikonen, Morri, Tyrisevä, Ruottinen and Ojala2004). The cause of NC milk has not been established, although genetic factors have been suggested (Ikonen et al. Reference Ikonen, Ahlfors, Kempe, Ojala and Ruottinen1999a, Reference Ikonen, Morri, Tyrisevä, Ruottinen and Ojala2004) and two candidate genes associated with NC milk, involved in post-translational modifications of milk proteins, have recently been identified (Tyrisevä et al. Reference Tyrisevä, Elo, Kuusipuro, Vilva, Jänönen, Karjalainen, Ikonen and Ojala2008).
Mixing coagulating milk with NC/PC milk has been shown to have negative effects on curd firmness (Flüeler & Puhan, Reference Flüeler and Puhan1978; Okigbo et al. Reference Okigbo, Richardson, Brown and Ernstrom1985b; Tervala & Antila, Reference Tervala and Antila1985). Thus, if the number of cows that produce NC milk will increase, this is expected to have a negative economic impact for the dairies. Large variations in coagulating properties of milk at herd level have been reported by Ikonen et al. (1999b). To overcome variations in milk coagulation time and accelerate the coagulation reaction in cheese manufacture, 0·005–0·02% CaCl2 is frequently added to the cheese milk prior to renneting. It is possible that CaCl2 treatment would improve, or even eliminate, problems associated with NC milk.
In an attempt to confirm the existence of a genetic component behind NC milk, the recurrence of the phenomenon in individual cows was studied. Moreover, the composition of PC and NC milk compared with GC milk was studied, and the effect of CaCl2 addition on these samples was examined.
Materials & Methods
Milk samples
All lactating cows in Jälla and Kungsängen experimental dairy herds of the Swedish University of Agricultural Sciences (Uppsala, Sweden) were screened in April 2006 regarding milk coagulation properties. Individual milk samples were collected, defatted, and 10 μl chymosin (Chymax Plus, 200 International Milk Clotting Units/ml; Christian Hansen A/S, Hørsholm, Denmark) was added to 6 ml pre-warmed (30°C, 30 min) aliquots. Samples were kept at 30°C and start of coagulation was determined visually. Cows were selected for further sampling when the coagulation time (CT, time from chymosin addition till start of coagulation) of their milk was <5 min or >20 min, with the pre-requisite that they showed no clinical signs of mastitis. Selected cows were sampled once a week during four weeks (May 2006), another screening was performed and selected cows from the second screening were sampled once a week during four weeks (June 2006). A third screening was performed in order to increase the number of GC milk samples, these cows were sampled once (August 2006).
A total of 37 cows were selected and morning milk samples were collected. The cows were in lactation week 12 to 35 when sampled and each cow was sampled between one and seven times, with a total sample number of 99. Of the cows, 26 were of the Swedish Red breed and 11 of the Swedish Holstein breed. Milk samples were preserved with 2 μl/ml of a 17% (w/v) Bronopol solution (Boots Microcheck, Nottingham, England) at sampling and analysed for total protein, fat and lactose concentration by MIR (mid-infrared) spectroscopy (MilkoScan FT120, A/S Foss Electric, Hillerød, Denmark) and for somatic cell count (SCC) by flow cytometry (Fossomatic 5200, A/S Foss Electric). Additional analyses (total calcium, casein micelle size, rheology, milk protein composition) were performed on defatted milk (pre-warming 30°C 30 min, centrifugation 2465 g, 3°C, 25 min; Centrifuge 5810R, Eppendorf AG, Hamburg, Germany). Total calcium concentration of milk was analysed using ICP (inductively coupled plasma) spectroscopy at Steins Laboratorium AB (Löddeköpinge, Sweden) and casein micelle size by PCS (photon correlation spectroscopy) (ZetaSizer 3000HS; Malvern Instruments Ltd, Malvern, UK) according to Devold et al. (Reference Devold, Brovold, Langsrud and Vegarud2000). MIR, SCC and rheological analyses were performed the day after sampling on milk stored at 4°C, whereas milk protein composition, calcium concentration and casein micelle size were analysed in milk that had been stored at −80°C. Information regarding sampling week, morning milk yield, parity number and lactation week was known for each sample.
Also a second set of milk samples, including Finnish Ayrshire cows belonging to the Viikki experimental dairy herd of the University of Helsinki (Helsinki, Finland), were analysed for protein composition and micelle size. These samples were from cows consistently producing either NC or GC milk, observed by monthly samplings between February 2005 and September 2006. Samples used in this study were collected when cows were in lactation week 10 to 34 and showing no symptoms of clinical mastitis. Data on parity and stage of lactation, plus analytical results regarding fat content, protein content, SCC and coagulation properties, were known for each sample (see Ikonen et al. (Reference Ikonen, Morri, Tyrisevä, Ruottinen and Ojala2004) for analytical protocol).
Coagulating properties
Coagulation was measured rheologically the day after sample collection using a Bohlin VOR Rheometer (Malvern Instruments Nordic AB, Uppsala, Sweden) fitted with a C25 measuring system and a 2 g*cm torsion bar. Oscillation mode with a frequency of 1 Hz and a constant strain of 0·0412 was used. Each milk sample (12 ml) was pre-warmed (30°C, 30 min) and pH was measured (Meterlab PHM 83; BergmanLabora AB, Upplands-Väsby, Sweden). The course of coagulation was followed from addition of chymosin (20 μl Chymax Plus) during 30 minutes and G' (storage modulus, curd firmness) of the developing gel was plotted against time. Temperature was kept constant at 30°C. Coagulation time (CT) was recorded as the time from chymosin addition until an increase in G' was detected by the instrument and G' was read 30 min after chymosin addition. The measurement was repeated once on a separate sample aliquot, with 0·05% CaCl2 (Christian Hansen A/S, Graasten, Denmark) added prior to the pre-warming.
Milk protein composition
Concentrations of the major proteins in milk (αs1-, αs2-, β-, κ-CN, β-LG, α-lactalbumin; α-LA) were analysed by RP-HPLC. NC (Swedish) milk samples were analysed twice, before and after 30 min incubation with chymosin. The procedure, including equipment, reagents and buffers, was as described by Hallén et al. (Reference Hallén, Wedholm, Andrén and Lundén2008). Concentration of major proteins was calculated as the sum of concentrations of the individual proteins (αs1-, αs2-, β-, κ-CN, β-LG, α-LA). Total casein concentration was calculated as the sum of individual concentrations of the analysed caseins (αs1-, αs2-, β-, κ-CN).
Statistical analyses
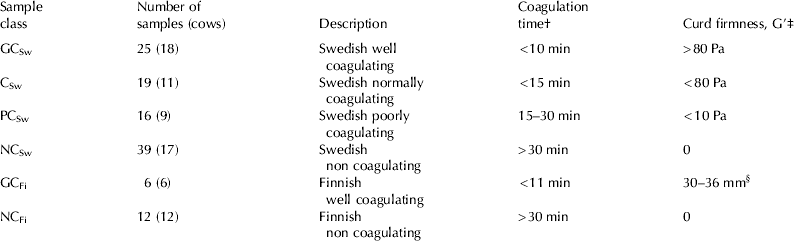
In order to establish if the two most extreme milks regarding coagulation, GC and NC, differed in composition, coagulation properties were treated as a categorical trait with only GC and NC as response levels. Therefore data was analysed with a generalised linear mixed model using the GLIMMIX procedure of SAS (SAS Institute Inc, Cary, USA), with cow and sampling week entered as random effects. In the Swedish data GCSw and NCSw were compared, omitting normally coagulating (CSw) and PCSw samples, whereas all Finnish samples belonged to either of the two most extreme response levels; GCFi or NCFi. For details on response levels see Table 1. Parity was grouped into two classes; first parity and second or higher parity. Fixed effects of parity, breed, lactation week, milk yield, SCC, pH, casein micelle size, concentration of total calcium, fat and lactose, and concentrations of major proteins, total casein, αs1-CN, αs2-CN, β-CN, β-LG and β-LA, were not significant and dropped from the subsequent analyses.
Classification of milk samples by their coagulation properties
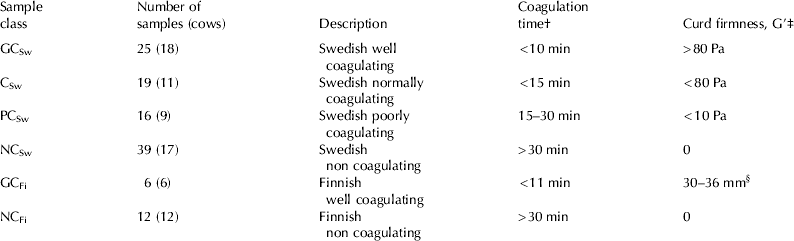
† Time from chymosin addition until start of coagulation
‡ 30 min after chymosin addition
§ E30 measurement from Computerized Renneting Meter, see Ikonen et al. (Reference Ikonen, Morri, Tyrisevä, Ruottinen and Ojala2004)
To model the probability of coagulation on the ijklmnth sample, the following statistical model was used for the Swedish data:

where:
- P ijklmn =
Pr(y ijklmn=1)
- αn =
the nth class effect
- b 1 =
regression coefficient of κ-CN concentration
- κCN i =
κ-CN concentration i in milk sample ijklmn
- Ca j =
fixed effect of CaCl2 addition j (j=yes, no)
- cow k =
random effect of cow k
- sampl l =
random effect of sampling week l (l=1, 2, … 9)
- εijklmn=
random residual effect
To model the probability of coagulation on the ijkth sample, the following statistical model was used for the Finnish data:


where:
- αk =
the kth class effect
- κCN i =
κ-CN concentration i in milk sample ijk
Results & Discussion
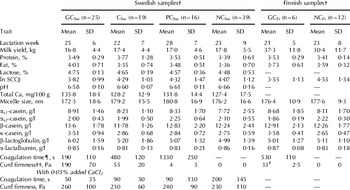
Mean and variation for parameters of Swedish and Finnish milk are given in Table 2. The Swedish samples were categorized into four coagulation classes; GCSw, CSw, PCSw and NCSw. Coefficient of repeatability for G' was 0·89 without CaCl2 and 0·65 with CaCl2. The higher repeatability for G' without CaCl2 addition was due to the low within-cow variation regarding PC/NC milk samples. This also reflects that poor coagulation was a consistent problem in milk from cows sampled in this study and confirms a genetic background of NC. It has previously been reported that the enzymatic phase of the coagulation reaction in NC milk proceeds as in coagulating milk (Tervala & Antila, Reference Tervala and Antila1985; van Hooydonk et al. Reference van Hooydonk, Hagedoorn and Boerrigter1986). This was also observed in the present study, as RP-HPLC analysis of NCSw samples after 30 min incubation with chymosin demonstrated the formation of para- κ-CN (peak confirmed using a para-κ-CN protein standard, data not shown). Addition of CaCl2 (0·05%) to the Swedish samples markedly improved coagulation (Table 2), i.e. reduced CT and increased G', of all samples with the exception of seven NCSw samples with deviating milk composition originating from a single cow. The difference in G' was eliminated after CaCl2 addition, whereas the effect on CT was less clear. Coagulation of PC milk has been found to be improved by CaCl2 addition (van Hooydonk et al. Reference van Hooydonk, Hagedoorn and Boerrigter1986; Okigbo et al. Reference Okigbo, Richardson, Brown and Ernstrom1985b), but PC milk with added CaCl2 has still been associated with lower cheese yield compared with GC milk (Nsofor, Reference Nsofor1989). In the latter two studies, however, milk samples were taken from cows in late lactation where part of the casein may have been degraded due to increased plasmin activity. Extensive protein degradation was not observed in NC milk in the present study, with the exception of the seven samples mentioned above. These deviating milk samples showed an anomalous composition with low fat, lactose, major proteins, αs1-CN, and β-CN concentrations, low CN ratio (sum of caseins divided by sum of major proteins, from the HPLC analysis), high pH, low total calcium content, and remained PC or NC also after CaCl2 addition. Urech et al. (Reference Urech, Puhan and Schallibaum1999) reported increased plasmin activity and casein degradation in quarter milk samples from cows with mild sub-clinical mastitis. Although SCC was not very high (130−200×10−3), the low concentrations of αs1-CN and β-CN indicating degradation by plasmin, along with the high pH and low lactose concentration of these milk samples point to a (sub-clinical) mastitis infection. Therefore the samples from this cow were excluded from the statistical analysis.
Means (with standard deviations) of traits in milk samples from individual cows

† For definition see Table 1
‡ Morning yield in Swedish samples, morning+evening yield in Finnish samples
§ Values transformed to the natural logarithm scale
¶ Time from chymosin addition until start of coagulation
†† 30 min after chymosin addition
# E30 measurement (mm) from Computerized Renneting Meter, see Ikonen et al. (Reference Ikonen, Morri, Tyrisevä, Ruottinen and Ojala2004)
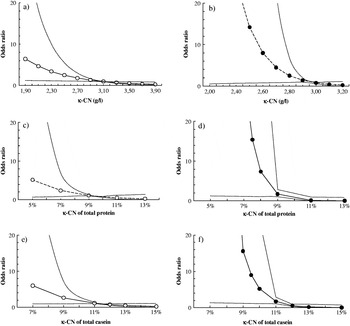
The statistical analysis showed that a decreasing κ-CN concentration of milk increased the risk of NC in the Swedish sample set (P<0·05), with a similar tendency in the Finnish data (P=0·07) (Fig. 1a, b). This difference was found in the unglycosylated fraction of κ-CN. Similar results were obtained when κ-CN was expressed both as a percentage of the concentration of major proteins (Fig. 1c, d) and as a percentage of the total casein concentration (Fig. 1e, f). Wedholm et al. (Reference Wedholm, Larsen, Lindmark-Månsson, Karlsson and Andrén2006) also found κ-CN concentration to be low in PC and NC milk samples, whereas Jõudu et al. (Reference Jõudu, Henno, Kaart, Pussa and Kart2008) found lower concentrations of all the individual caseins as well as β-LG in NC milk. There are studies showing the total casein content to be low in NC milk (Losi et al. Reference Losi, Castagnetti, Morini, Resmini, Volonterio and Mariani1982; Nsofor, Reference Nsofor2000) and low total protein content to increase the risk of NC (Tyrisevä et al. Reference Tyrisevä, Ikonen and Ojala2003), results that are somewhat contradicted by other reports where casein or protein content, as in the present study, showed no significant association with occurrence of NC milk (Flüeler, Reference Flüeler1978; Tervala & Antila, Reference Tervala and Antila1985). Tyrisevä et al. (Reference Tyrisevä, Ikonen and Ojala2003) however found the association of NC milk with total protein content to be confounded with lactation stage. The fact that milk samples in the present study were collected from cows more or less in mid-lactation (week 10–35), might explain why this association was not found here.
Association of milk κ-casein (κ-CN) content with non-coagulation in milk samples from individual dairy cows of the Swedish Red and Swedish Holstein breeds (○), or the Finnish Ayrshire breed (•). Content of κ-CN in milk expressed as: a) and b) concentration; c) and d) percentage of the summed concentrations of αs1-CN, αs2-CN, β-CN, κ-CN, β-LG and α-LA; e) and f) percentage of the summed concentrations of αs1-CN, αs2-CN, β-CN and κ-CN. A lower odds ratio is the decreased risk of non-coagulation (Solid lines P<0·05, dashed lines P<0·1. Dotted lines show 95% CI).

Although 16% of the samples in the present study contained SCC>160 000, SCC was not a risk factor for NC, as also reported by Tyrisevä et al. (Reference Tyrisevä, Ikonen and Ojala2003). In contrast to Tyrisevä et al. (Reference Tyrisevä, Ikonen and Ojala2003) we found milk pH not to be associated with NC, the variation in pH was however limited. Further, in the Swedish data the addition of CaCl2 improved nearly all NCSw milk samples to reach the level of GCSw (P<0·001). Okigbo et al. (1985b) found pH reduction and CaCl2 addition (0·02%) to shorten CT of PC/NC late lactation milk, whereas curd firmness was unaffected. The level of CaCl2 added in our study (0·05%) is used to standardise the milk substrate when analysing the strength of milk-coagulating enzymes (IDF, 1997), by ensuring that enough free calcium ions are present in the milk. Any remaining changes in coagulation would then need to be explained by other parameters. More than 0·02% added CaCl2 is not recommended in commercial cheese making and levels exceeding 0·04% have been reported to produce a bitter flavour (Schwarz & Mumm, Reference Schwarz and Mumm1948). Although no difference in total calcium content was found between NCs samples and coagulating milk, it is possible that the ratio of free calcium ions and colloidal calcium phosphate differed between the two milks as previously reported by van Hooydonk et al. (Reference van Hooydonk, Hagedoorn and Boerrigter1986). Further, although PC/NC milk is improved by the addition of CaCl2, as shown in the present work, and cheese yield is not reduced (Ikonen et al. Reference Ikonen, Ruottinen, Syväoja, Saarinen, Pahkala and Ojala1999b; Wedholm et al. Reference Wedholm, Larsen, Lindmark-Månsson, Karlsson and Andrén2006), this milk may still be unsuitable for cheese manufacture as it is likely to result in cheese with higher moisture content (Nsofor, Reference Nsofor1989; Ikonen et al. Reference Ikonen, Ruottinen, Syväoja, Saarinen, Pahkala and Ojala1999b), which in some cheese varieties is negative for the product quality.
In conclusion, NC milk was associated with low concentration of κ-CN in milk from cows of the Swedish Red and Swedish Holstein breeds. This was also shown as a trend in an independent data set with cows of the Finnish Ayrshire breed. CaCl2 addition at a concentration somewhat exceeding that commercially applied improved coagulation of NC milk to the level of GC milk, particularly G'.
This work was funded by the Swedish Farmers' Foundation for Agricultural Research. The authors wish to thank Lena Hagenvall and Gudrun Franzén for milk sampling at Jälla, and Märta Blomqvist for milk sampling at Kungsängen. Gerd Vegarud and Tove Gulbrandsen-Devold, UMB, Norway, are thanked for valuable help with the micelle size determinations.