INTRODUCTION
Arvicoline rodents (voles and lemmings) are numerically and functionally the dominant mammalian herbivores in the Northern parts of the Holarctic regions (Western Nearctic and the Western half Palaearctic regions). The Arvicolinae subfamily (Cricetidae) consists of 26 genera and 140 species, the most diverse genus being Microtus with 60 recognized species.
Previous studies (Tenora, Reference Tenora1967; Merkusheva and Bobkova, Reference Merkusheva and Bobkova1981) reported that Trichuris muris is a nematode parasite found mainly in Murinae and Arvicolinae rodents. Nevertheless, based on isoenzymatic techniques, Feliú et al. (Reference Feliú, Spakulova, Casanova, Renaud, Morand, Hugot, Santalla and Durand2000) suggested that trichurids parasitizing hosts of the family Arvicolidae (presently regarded as a subfamily in Cricetidae, Wilson and Reeder, Reference Wilson and Reeder2005) constitute a separate species of Trichuris and they described a new species, T. arvicolae, as a parasite of the Arvicolidae rodent family. Cutillas et al. (Reference Cutillas, Oliveros, de Rojas and Guevara2002) amplified and sequenced the ITS1-5·8S-ITS2 region of the ribosomal DNA (rDNA) of T. muris and T. arvicolae using conserved primers; they reported that PCR molecular techniques differentiated T. muris and T. arvicolae as two well-defined species.
Comparative analysis of coding and noncoding regions of ribosomal DNA has become a useful tool for the construction of phylogenetic trees of many organisms including nematodes (Subbotin et al. Reference Subbotin, Vierstraete, de Ley, Rowe, Waeyenberge, Moens and Vanfleteren2001). The internal transcribed spacers 1 and 2 (ITS1 and ITS2) located in the ribosomal DNA are considered appropriate molecular markers to resolve relationships at the Trichuris species (Cutillas et al. Reference Cutillas, Callejón, de Rojas, Tewes, Úbeda, Ariza and Guevara2009, Reference Cutillas, de Rojas and Ariza2007, 2004, 2002).
Mitochondrial DNA (mtDNA) has proven useful in molecular phylogenetics due to its presumed maternal inheritance, rapid rate of divergence and lack of recombination (Arrivillaga et al. Reference Arrivillaga, Norris, Feliciangeli and Lanzaro2002). The first subunit of the mtDNA cytochrome c-oxidase (cox1) gene has been used to study evolutionary relationships among recently diverged rapidly evolving taxa and also to resolve deep branch phylogenies in which multiple substitutions are a critical problem (Bowles and McManus, Reference Bowles and McManus1993; Kumazawa and Nishida, Reference Kumazawa and Nishida1993; Sukhdeo et al. Reference Sukhdeo, Sukhdeo, Black and Vrijenhoek1997; Morgan and Blair, Reference Morgan and Blair1998).
The number of phylogeographical studies on animals and hominids has increased greatly during recent years, particularly in Europe (Taberlet et al. Reference Taberlet, Fumagalli, Wust-Saucy and Cosson1998; Hewitt, Reference Hewitt1999; Avise, Reference Avise2000; Jaarola and Searle, Reference Jaarola and Searle2004; Folinsbee and Brooks, Reference Folinsbee and Brooks2007), but are mainly concerned with vertebrate taxa (fish, amphibians, birds and mammals) while invertebrate taxa, particularly parasite species, have been hardly studied (Burban et al. Reference Burban, Petit, Carcreff and Jactel1999; Attwood, Reference Attwood2001; Wikstrom et al. Reference Wikstrom, Savolainen, Chase, Donoghue and Smith2003; Haukisalmi and Henttonen, Reference Haukisalmi and Henttonen2001; Haukisalmi et al. Reference Haukisalmi, Wickström, Hantula and Henttonen2001, Reference Haukisalmi, Wickström, Henttonen, Hantula and Gubányi2004, Reference Haukisalmi, Henttonen and Hardman2006, Reference Haukisalmi, Hardman, Hardman, Laakkonen, Niemimaa and Henttonen2007, Reference Haukisalmi, Hardman, Hardman, Rausch and Henttonen2008, Reference Haukisalmi, Hardman, Henttonen, Laakkonen, Niemimaa, Hardman and Gubányi2009, Reference Haukisalmi, Hardman and Henttonen2010a, Reference Haukisalmi, Hardman, Foronda, Feliu, Laakkonen, Niemimaa, Lehtonen and Henttonenb). Conversely, the phylogeography of different species of nematodes has been studied avidly recently by several authors (Nieberding et al. Reference Nieberding, Libois, Douady, Morand and Michaux2005; Miranda et al. Reference Miranda, Tennessen, Blouin and Rabelo2008; Traversa et al. Reference Traversa, Kuzmina, Kharchenko, Iorio, Klei and Otranto2008 and Zhou et al. Reference Zhou, Li, Yuan, Hu and Peng2011).
The present work was an attempt to study the phylogeography of T. arvicolae isolated from different rodent hosts from different geographical regions testing whether host specificity or geography play a role in structuring the parasite phylogeography. To discriminate between the alternative hypotheses of co-speciation (host-parasite) versus geographical differentiation, we carried out a molecular study based on the amplification and sequencing of the ITS1-5·8S-ITS2 fragment of the ribosomal DNA and the first subunit of the cytochrome c oxidase (cox1) partial gene mitochondrial DNA, looked on species of Trichuris isolated from Microtus agrestis, Microtus arvalis, Microtus levis, Microtus townsendii, Myodes glareolus, Cricetulus barabensis and Chionomys roberti sampled from different geographical areas (North America, Europe and Asia).
MATERIALS AND METHODS
Collection of samples
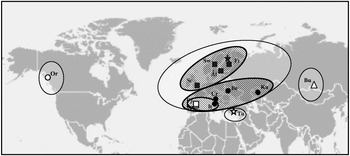
Although Feliú et al. (Reference Feliú, Spakulova, Casanova, Renaud, Morand, Hugot, Santalla and Durand2000) suggested that trichurids parasitizing hosts of the Arvicolidae family (presently subfamily Arvicolinae) are T. arvicolae, we considered different populations of Trichuris isolated from 7 species of rodent hosts (Microtus agrestis, Microtus arvalis, Microtus levis, Microtus townsendii, Myodes glareolus, Chionomys roberti and Cricetulus barabensis) from different geographical regions as Operational Taxonomic Unit (OTUs) (Chilton et al. Reference Chilton, Gasser and Beveridge1995). A total of 38 adult Trichuris sp. were collected from 11 Microtus agrestis (Cricetidae: Arvicolinae), 4 Microtus arvalis (Cricetidae: Arvicolinae), 1 Microtus levis (Cricetidae: Arvicolinae), 1 Microtus townsendii (Cricetidae: Arvicolinae), 6 Myodes glareolus (Cricetidae: Arvicolinae) and 2 Chionomys roberti (Cricetidae: Arvicolinae) from different localities from Europe: Turkey, Spain (Montseny, Barcelona), Eastern Pyrenean Mountains (France), Finland (South), Finland (Åland Island), Sweden, Scotland, Italy, Belarus and Croatia; from Asia: Kazakhstan; and from America: Oregon (Fig. 1, Table 1). Furthermore, 1 Trichuris sp. from Cricetulus barabensis (Cricetidae: Cricetinae) from Buryatia, Siberia, was analysed. Worms were washed extensively in 0·9% saline solution and stored in 70% alcohol until required for PCR and sequencing. The identification of species of Trichuris found in the caecum of these rodent hosts was made according to Feliú et al. (Reference Feliú, Spakulova, Casanova, Renaud, Morand, Hugot, Santalla and Durand2000).
Geographical distribution of Trichuris populations and the extension of their genetic clades. Host species: black square: Microtus agrestis; black star: Microtus levis; black circle: Microtus arvalis; white square: Myodes glareolus; white circle: Microtus townsendii; white star: Chionomys roberti; white triangle: Cricetulus barabensis. Localities: Or: Oregon, Fi: Finland (South), Ål: Finland (Åland island), Sc: Scotland, Sw: Sweden, Py: France (Eastern Pyrenean Mountains), Sp: Spain (Montseny, Barcelona), It: Italy, Cr: Croatia, Ka: Kazakhstan, Be: Belarus, Tu: Turkey, Bu: Buryatia. ○Indicate the subdivision of populations in geographical clades based on ribosomal DNA marker.  Indicate the subdivision of populations in geographical clades based on mitochondrial DNA marker.

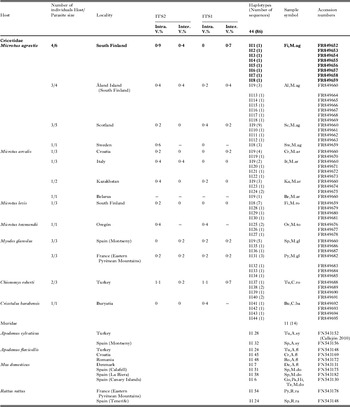
Distribution of 39 individuals of Trichuris isolated from 12 populations of Arvicolinae and Cricetinae (Cricetidae, Muroidea) rodent hosts collected from different localities and their haplotypes (ITS)

Sequence data
Genomic DNA from individual worms was extracted using the DNeasy Blood and Tissue Kit (Qiagen) according to the manufacturer's protocol. Genomic DNA was detected using 0·8% agarose gel electrophoresis and ethidium bromide.
The ribosomal DNA (rDNA) region ITS1-5·8S-ITS2 was amplified by PCR using a Perkin Elmer thermocycler and the following PCR mix: 10 μl 10 × PCR buffer, 2 μl 10 mM dNTP mixture (0·2 mM each), 3 μl 50 mM MgCl2, 5 μl primer mix (0·5 mM each), 5 μl template DNA, 0·5 μl Taq DNA polymerase (2·5 units) and autoclaved distilled water to 100 μl. The following conditions were applied: 94 °C for 3 min (denaturing), 35 cycles at 94 °C for 1 min (denaturing), 55 °C for 1 min (annealing), 72 °C for 1 min (primer extension), followed by 10 min at 72 °C. DNA sequences of the forward primer NC5 (5′-GTAGGTGAACCTGCGGAAGGATCATT-3′) and reverse primer NC2 (5′-TTAGTTTCTTTTCCTCCGCT-3′) corresponded to the conserved 3′–5′ ends of the ITS1-5·8S-ITS2 flanking the 18S and 28S gene regions (Gasser et al. Reference Gasser, Nansen and Guldberg1996). For each set of PCR reactions and extraction of the DNA, samples without DNA (negative) and a known (positive) control DNA samples were also included.
The mitochondrial DNA (mtDNA) cytochrome c-oxidase subunit 1 gene (cox1) was amplified by PCR using a Perkin Elmer thermocycler. PCR conditions and oligonucleotide primers were those designed for amplification of cox1 from Trichinella isolates (Nagano et al. Reference Nagano, Wu, Matsuo, Pozio and Takahashi1999); it was anticipated that the molecular approach employed for Trichinellidae nematodes could also be applied to the Trichuridae group.
Thus, DNA sequences of the forward primer FORCOXI: 5′-TTTGGGCATCCTGAGGTTTA-3′; (L6625 modified from Nagano et al. Reference Nagano, Wu, Matsuo, Pozio and Takahashi1999) and reverse primer H7005: 5′-ACTACGTAGTAGGTATCATG-3′ (Nagano et al. Reference Nagano, Wu, Matsuo, Pozio and Takahashi1999) corresponded to the conserved regions of the cytochrome c-oxidase subunit 1 gene. For each set of PCR reactions and extraction of the DNA, samples without DNA (negative) and a known (positive) control DNA sample were also included.
The PCR products were checked on ethidium bromide-stained 2% Tris-Borate-EDTA (TBE) agarose gels. Bands were eluted from the agarose by using the QIAEX II Gel Extration Kit (Qiagen). The isolated DNA was cloned into Escherichia coli DH5α using pGEM-T Easy vector system (Promega). Transformed cells were selected by overnight incubation at 37 °C on LBB/Amp/X-gal/IPTG plates. In order to check for successful cloning and to study the intra-individual variation, at least 10 single recombinants (clones) were screened for the DNA insert and sequenced. The 10 clones containing the correct insert were used to inoculate 5 ml of LBB/Amp broth and incubated, shaken at 37 °C for 12 h. Plasmid was purified using a Wizard Plus SV (Promega) and sequenced by MWG-Biotech (Germany) with a universal primer (M13).
The intra-individual variation was determined by sequencing between 3 and 5 clones of 1 individual per population of Trichuris. The inter-individual variation was determined by sequencing at least 3 individuals of each locality and host.
Phylogenetic analysis
All analyses were performed on the mtDNA and rDNA datasets, c ox1 partial gene and ITS1-5·8S-ITS2 sequences were aligned using the Clustal X program version 2.0 (Larkin et al. Reference Larkin, Blackshields and Brown2007).
The ribosomal phylogenetic analysis was carried out using sequences of Trichuris muris isolated from European murine rodents (Callejón et al. Reference Callejón, de Rojas, Foronda, Feliú, Guevara and Cutillas2010) (Table 2) as an outgroup, while the mitochondrial phylogenetic analysis was carried out using the cytochrome c oxidase 1 partial sequence of Trichuris muris (GenBank, Accession number: CB013185.1, Blaxter et al. 2000, unpublished) as an outgroup.
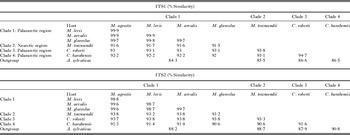
Percentages of similarity observed in the ITS1 and ITS2 sequences of Trichuris populations isolated from different hosts

Phylogenetic relationships were analysed by maximum parsimony (MP) methods using the MEGA 5 program (Tamura et al. Reference Tamura, Peterson, Peterson, Stecher, Nei and Kumar2011), maximum likelihood (ML) using the PHYML package (Guindon and Gascuel, Reference Guindon and Gascuel2003) and Bayesian-based inference as implemented in MrBayes 3.1.2 (Ronquist and Huelsenbeck, Reference Ronquist and Huelsenbeck2003). MrModel Test 2.3 (Nylander, Reference Nylander2008) was used to choose a best-fit model of sequence evolution (Posada, Reference Posada2008). Models of evolution were chosen for subsequent analyses according to the Akaike Information Criterion (Huelsenbek and Rannala, 1997; Posada and Buckley, Reference Posada and Buckley2004). A general time-reversible (GTR + I) model with a proportion of invariable sites was chosen as the optimal model of evolution for cox1 partial gene and a Hasegawa-Kishino-Yano (HKY85) model with gamma-distributed rate variation for ITS1-5.8S-ITS2 fragment. Three independent runs of 4 Markov chains for 10 million generations, were run, sampling every 500 generations. Adequacy of sampling and run convergence were assessed using the effective sample size diagnostic in TRACER 1.5 (Rambaut and Drummond, Reference Rambaut and Drummond2007). Trees from the first million generations were discarded based on an assessment of convergence.
Furthermore, NETWORK (version 4.5.1.0) was used to create intraspecific median-joining networks (Bandelt et al. Reference Bandelt, Foster and Röhl1999; available at www.fluxus-engineering.com), to visualize evolutionary relationships between haplotypes. This approach has been shown to yield the best resolved genealogies relative to other rooting and network procedures (Cassens et al. Reference Cassens, Waerebeek, Best, Crespo, Reyes and Milinkovitch2003).
Phylogeographical analysis
The phylogeographical analysis was performed on the mtDNA datasets. Nucleotide diversity (pi) and haplotype (h) diversities were estimated using the DnaSP version 5.0 (Rozas and Rozas, Reference Rozas and Rozas1997). Nucleotide diversity (pi) and haplotype (h) diversities were calculated at level of clade defined by the phylogenetic and networks analyses. The estimations of nucleotide (pi) and haplotypes (h) diversities were calculated between different clades and genetic groups.
To discriminate between the alternative hypotheses of co-speciation (host-parasite) versus geographical differentiation, we performed an analysis of molecular variance (Arlequin ver. 3.5; Excoffier and Lischer, Reference Excoffier and Lischer2010). This method estimates the proportion of genetic variation assignable to differences between pre-defined hierarchical groups, among populations within these groups, and among populations throughout the entire study area (Turner et al. Reference Turner, Trexler, Harris and Haynes2000). These AMOVA analyses were performed at different hierarchical levels using information from the geographical distribution (among the 3 major geographical groups of populations) and host species.
RESULTS
Ribosomal DNA: ITS1-5.8S-ITS2
A single PCR product (about 1100 base pairs) was amplified from the genomic DNA of Trichuris sp. isolated from different localities and hosts. The sequences of different populations of Trichuris from different Microtus species and Myodes glareolus were of 1035–1093 base pairs (bp), corresponding with 433-448 bp of the ITS1; 173 bp of the 5·8S; 423–473 bp of the ITS2, while the sequences of Trichuris sp. isolated from Chionomys roberti and Cricetulus barabensis were of 1093–1094 and 1086–1096 base pairs, respectively, corresponding with 442 and 443–574 bp of the ITS1; 173 and 168 bp of the 5·8S; 478–479 and 474–475 bp of the ITS2, respectively. In total, 40 haplotypes were observed for the 82 (ITS1-5·8S-ITS2) sequences obtained from Trichuris populations from Arvicolinae hosts (GenBank Accession numbers FR849652 to FR849691) (Table 1), while 4 haplotypes were observed for the ITS1-5·8S-ITS2 sequences of Trichuris sp. isolated from Cricetulus barabensis (Cricetinae) (GenBank Accession numbers FR849692 to FR849695) (Table 1).
Intra-individual and intra-specific variations were observed in the ITS1 and ITS2 sequences of different individuals isolated from different hosts and regions (Table 1).
Different repetitive nucleotide sequences called microsatellites were found in the ITS1 and ITS2 sequences of Trichuris sp. isolated from different localities and hosts. Thus, in the ITS1 sequences of all species of Trichuris analysed, Poly (GC) and Poly (CTG) were observed at positions 26 and 83 respectively, while Poly (TA) was only observed at position 419 in the ITS1 sequences of Trichuris from Microtus agrestis, M. arvalis, M. levis and Myodes glareolus. Furthermore, in the ITS2 sequences, Poly (AGT), Poly (GCT) and Poly (CG) were observed at positions 36, 223 and 407, respectively.
The percentage of similarities observed by the comparative study of the ITS1 and ITS2 sequences of Trichuris populations isolated from different rodent hosts collected from different geographical regions are shown in Table 2.
Mitochondrial DNA: cytochrome c-oxidase subunit 1 partial gen
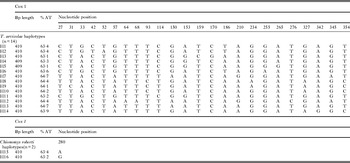
A single PCR product was amplified from each of the genomic DNA of Trichuris species isolated from different localities and hosts. Cytochrome c-oxidase subunit 1 (cox1) partial gene sequences of Trichuris sp. were of 409–410 base pairs (bp) and the AT% content ranging from 63·1 to 64·7% (Table 3).
Interhaplotype differences found in the mtDNA cox1 partial gene sequences of Trichuris populations

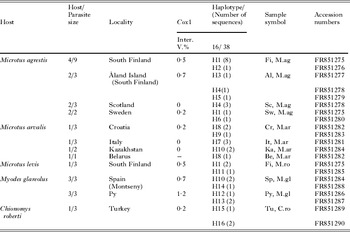
A total of 16 haplotypes (Table 3) were observed for the 38 cox1 partial gene sequences obtained from Trichuris populations from Arvicolinae hosts (GenBank Accession numbers, Table 4). Intraspecific variations were observed in the cytochrome c-oxidase subunit 1 gene sequences of different individuals isolated from different hosts and regions (Tables 3 and 4). It is noteworthy that the highest variability was observed among the individuals from Myodes isolated from Eastern Pyrenees (1·2%, see Table 4). Different repetitive nucleotide sequences called microsatellites were found in the cox1 partial gene sequences of Trichuris populations isolated from different localities and hosts. Thus, Poly (TA) and Poly (TTA) were observed at positions 162 and 384.
Distribution of Trichuris populations isolated from different localities and hosts (Cricetidae, Arvicolinae)

When the cox1 partial gene sequences of Trichuris species from Microtus agrestis, Microtus arvalis, Microtus levis and Myodes glareolus isolated from different Palaearctic regions (Fig. 1) were compared, the percentages of similarities ranged from 96·8% to 100%, while a 85·1% to 87·1% (not shown) of homology was observed when these cox1 gene sequences were compared with Trichuris sp. of Chionomys roberti. Furthermore, when cox1 partial gene sequences of Trichuris populations from voles were compared with those of Trichuris muris, the percentages of similarity were about 82·1% to 82·7%.
Unfortunately, we could not obtain any sequence of the cox1 partial gene of Trichuris populations from Microtus townsendi from Oregon (USA) and Trichuris from Cricetulus barabensis from Buryatia. Thus, a comparative study could not be carried out with these two species.
Phylogenetic reconstruction of Trichuris populations isolated from Arvicolinae hosts
Phylogenetic and network relationships of ITS1-5.8S-ITS2 fragment sequences
The Trichuris species data matrix was composed of 86 rDNA sequences (44 haplotypes) (Table 1) and 38 mtDNA sequences (16 haplotypes) (Table 4). The ML (−ln = 3389·1), MP (Length = 320 steps; Consistency Index (CI) = 0·934169; Retention Index (RI) = 0·986850; Rescaled Consistency Index (RCI) = 0·921885) and Bayesian reconstruction analyses (The potential scale reduction factor (PSRF) were all close to 1·0 for all parameters) were performed on the sequences obtained from Trichuris species collected from 7 species of rodent hosts (Table 1) isolated from different geographical regions. Trichuris muris sequences from murid rodents (Apodemus sylvaticus, A. flavicollis, Mus domesticus and Rattus rattus) were used as outgroups (Callejón et al. Reference Callejón, de Rojas, Foronda, Feliú, Guevara and Cutillas2010, Table 1).
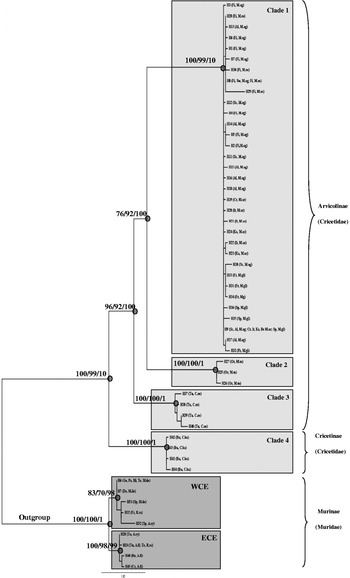
The topology was congruent across the 3 methods assayed. Four well-supported genetic groups (Fig. 2) appeared: clade 1 (Bootstrap values (BP) of 100%, 99% and 100% in ML, MP and Bayesian analyses, respectively) was a large, widely distributed clade corresponding with Trichuris populations from Microtus species and Myodes glareolus from the Palaearctic zone; clade 2: Trichuris populations from Microtus townsendii (BP of 100%, 100% and 100%, respectively) corresponding with the Nearctic zone; clade 3: Trichuris populations from Chionomys roberti (BP of 100%, 100% and 100%, respectively) and clade 4: Trichuris populations from Cricetulus barabensis (BP of 100%, 100% and 100%, respectively).
Most likely tree of the PHYML for the 44 haplotypes observed for the ITS1-5.8S-ITS2 sequences of Trichuris sp. isolated from different voles (Cricetidae: Arvicolinae and Cricetinae). Geographical origins and hosts (see Tables 1 and 2 and Fig. 1) are shown in parentheses. Numbers on branches indicate, from left to right (a) bootstrap support obtained in the PHYML analysis (HKY85); (b) bootstrap support obtained in one tree of 307 trees of the MP reconstruction; (c) bootstrap support obtained in the Bayesian analysis. Note that Bootstrap values under 70% were not considered.

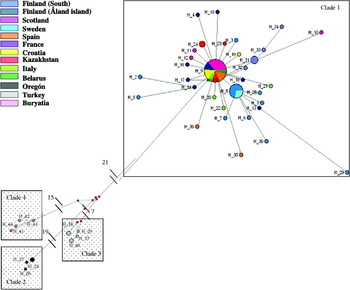
Networks of the 44 haplotypes of Trichuris sp. from voles showed a general congruence with the phylogenetic reconstruction (Fig. 3). The minimum spanning network showed the 4 main groups defined above: clades 2, 3 and 4 appeared well separated with 40, 28 and 36 mutational steps, respectively. Clade 1 clustered all the haplotypes of Trichuris populations from the Western and Eastern European regions. H9 haplotype was the most frequent haplotype observed in Palaearctic populations (showed by 27 taxa) distributed throughout a wide extension of regions (Åland Island, Scotland, Croatia, Italy, Kazakhstan, Belarus and Spain) (Fig. 3). The haplotypes network of clade 1 revealed star-like patterns around haplotype 9. Nevertheless, phylogenetic analysis obtained on the basis of ITS1-5.8S-ITS2 rDNA sequences did not show a differential geographical structure because all of the populations from the Palaearctic region were clustered in clade 1.
A minimum spannig network constructed using the 44 haplotypes of ribosomal ITS1-5·8S-ITS2 fragment sequences. The geographical origin for each haplotype is shown in Table 1. The size of the circle is proportional to the numbers of haplotypes represented. The numbers correspond to the mutational steps observed between clades and groups.

Phylogenetic relationships of cytochrome c-oxidase subunit 1 partial gene sequences
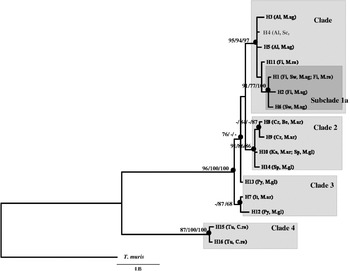
The ML (−ln = 1121·79), MP (Length = 126 steps; CI = 0·920635; RI = 0·921875; RCI = 0·848710) and Bayesian reconstruction analyses (the potential scale reduction factor (PSRF) were all close to 1·0 for all parameters) were performed using Trichuris muris sequences as outgroups (Table 4). The phylogenetic tree (Fig. 4) of Trichuris populations from Microtus sp., Myodes glareolus and Chionomys roberti from Western or Eastern Europe showed four well-supported genetic groups: (1) clade 1: Trichuris populations isolated from Microtus agrestis and Microtus levis from Northern Europe (South Finland, Åland Islands (SW Finland), Scotland and Sweden) (Bootstrap values BP of 95%, 94% and 97% ML, MP and Bayesian analyses respectively); (2) clade 2: Trichuris populations isolated from Microtus arvalis and Myodes glareolus from the southwestern, southeastern and eastern Europe (Spain, Croatia, Belarus) and Central Asia (Kazakhstan) (BP of 91%, 86% and 86% respectively); (3) clade 3: Trichuris populations isolated from Microtus arvalis and Myodes glareolus from France (Pyrenees) and Italy (BP of − %, 87% and 68% respectively); (4) clade 4: Trichuris populations from Chionomys roberti from Turkey (BP of 87%, 100% and 100% respectively). Trichuris populations clustered in clade 1, clade 2 and clade 3 showed high BP values (96%, 100% and 100% respectively), separated from Trichuris populations from Chionomys roberti. Furthermore, in the phylogenetic tree populations of Trichuris isolated from Northern Europe (clade 1) they appeared clustered in 2 main groups including the South of Finland and Sweden populations (subclade 1a) supported by high bootstrap values (91%, 77% and 100% respectively) another group clustering populations of Trichuris from South Finland, Åland Islands SW Finland and Scotland (Fig. 4).
Mayority-rule consensus tree for the 16 haplotypes observed for the cox1 partial sequences of Trichuris sp. isolated from different voles (Cricetidae: Arvicolinae) derived from Bayesian inference. Geographical origins and host (see Table 3 and Fig. 1) are shown in parentheses. Numbers on branches indicate, from left to right (a) bootstrap support obtained in the PHYML analysis (GTR + G+I); (b) bootstrap support obtained in one tree of 51 trees of the MP rescontruction; (C) bootstrap support obtained in the Bayesian analysis. Note that Bootstrap values under 65% were not considered. Symbols: Fi: Finland; Al: Finland (Åland Island); Sc: Scotland; Sw: Sweden; Cr: Croatia; It: Italy; Ka: Kazakhstan; Be: Belarus; Py: France (Eastern Pyrénean Mountains); Sp: Spain; Tu: Turkey. Host: M.ag: Microtus agrestis; M.ar: Microtus arvalis; M.ro: Microtus levis; M.gl: Myodes glareolus; C.ro: Chionomys roberti.

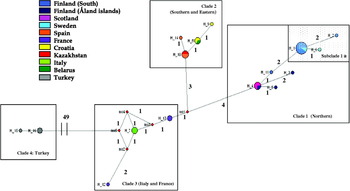
The percentages of similarity intra- and inter-clade are shown in Table 5. The network of the 14 haplotypes of Trichuris populations showed a general congruence with the phylogenetic reconstruction. The minimum spanning network showed the 3 main groups defined above and separated from each other by a genetic distance of 4–7 mutational steps (Fig. 5). Clade 1 clustered 1 distinct group (subclade 1a), linked by 2 mutational steps. A typical haplotype (H1) observed in the clade 1 was the most frequent haplotype (showed by 11 taxa). On the other hand, a typical haplotype (H10) observed in the clade 2 was the most frequent (showed by 4 taxa) in Trichuris populations from the South and East of Europe. Furthermore, clade 4 clustered cox1 sequences of Trichuris isolated from Chyonomis roberti from Turkey and this was separated from the other 3 clades by 49 mutational steps.
A minimum spanning network constructed using 16 haplotypes of mitochondrial cox1 partial gene sequences of Trichuris arvicolae and Trichuris sp. The geographical origin for each haplotype is shown in Table 3. The size of the circle is proportional to the numbers of haplotypes represented and the numbers correspond to the mutational steps observed between clades and/or groups.

Percentages of similarity observed in cox1 partial gene sequences between different clades of Trichuris populations isolated from different hosts (Arvicolinae, Cricetidae)

The phylogenetic analyses of the mtDNA cox1 partial gene sequences (Figs 4 and 5) revealed patterns of genetic differentiation within populations of Trichuris parasitizing rodent hosts (Arvicolinae) from the Palaearctic region.
Phylogeographical analysis of cytochrome c-oxidase subunit 1 partial gene sequences (mtDNA)
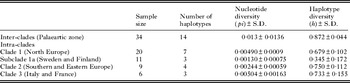
The estimation of nucleotide (pi) and haplotypes (h) diversities was performed on populations of Trichuris isolated from Arvicolinae hosts from the Palaearctic region (Table 6). Despite the lowest sample size, clade 3 (Italy and France) had a nucleotide diversity (pi) higher than the other 2 clades. On the other hand, clade 2 (Southwestern and Eastern Europe), with a similar sample size to clade 3, presented the lowest pi value, while, surprisingly, clade 1 (Northern Europe) showed a higher value than clade 2 (Table 6). Within this clade 1, nucleotide diversity was, contrary to expectations, higher in the Åland Islands than in the rest of the Northern continental region.
Intra-clade and inter-clade genetic variability based on cox1 partial gene sequences among Trichuris populations

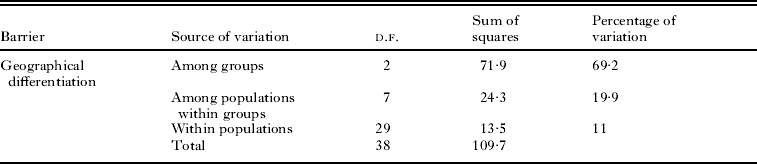
AMOVA analysis (Table 7) showed the influence of geographical factors versus co-speciation (host-parasite) in the biogeography of Trichuris species. Thus, attending to the co-speciation hypothesis, the molecular variance was about 37·3% whereas the geographical differentiation showed 69·2%. Therefore and according to these results the geographical model would explain the 3 genetic lineages (Italy and France, Northern Europe and Southern and Eastern Europe) by analysis of the molecular variance (Table 7). Furthermore, within none of these groups was a low percentage variation (19·9%) observed among populations.
Analysis of molecular variance of cox1 partial gene of Trichuris populations
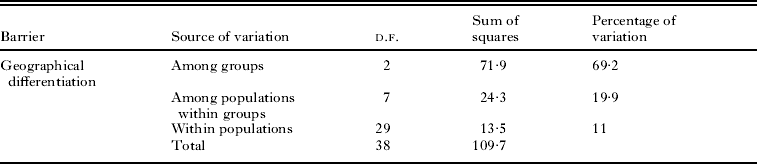
** : P < 0·01; #x002A;**: P < 0·001. d.f. = degrees of freedom. Fixation indices: Fsc = 0·6**; Fst = 0·9***; Fct = 0·7***

** : P < 0·01; ***: P < 0·001. d.f. = degrees of freedom. Fixation indices: Fsc = 0·7**; Fst = 0·8***; Fct = 0·4***
DISCUSSION
The ITS1 and ITS2 sequences observed for Trichuris populations isolated from Microtus agrestis, M. arvalis, M. levis and Myodes glareolus were identical to those obtained by Cutillas et al. (Reference Cutillas, Oliveros, de Rojas and Guevara2002) for T. arvicolae isolated from Myodes glareolus. Nevertheless, when these sequences were compared with those of Trichuris populations from Microtus townsendii from Oregon (USA, Nearctic region), Chionomys roberti (Arvicolinae) and Cricetulus barabensis (Cricetinae) the percentages of similarity showed less than 94%. This observation indicates that there may be a second species of Trichuris in arvicoline rodents.
There are no models which define the level of nucleotide differences required to distinguish between closely related parasite species (Stevenson et al. Reference Stevenson, Chilton and Gasser1995), nevertheless, the range of percentages of variation observed between different Trichuris populations was higher than those observed intraindividually.
Although mitochondrial DNA marker (cox1 sequences) corroborated ribosomal markers results, the percentages of similarity observed between different populations of Trichuris by ribosomal markers were higher than those observed by the sequencing of cox1 partial gene. This observation has been explained by several other authors. Thus, Blouin (Reference Blouin2002) and Hu et al. (2003) cited that the within-nematode species variation in protein-genes of mtDNA are greater than in ribosomal spacers probably due to the absence of cyto-nuclear disequilibrium or to epistatic effects or drift across genomes (Asmussen et al. Reference Asmussen, Arnold and Avise1987). Intra-specific divergence in cox1 gene is usually less than 5% (Blouin, Reference Blouin2002; Hu et al. 2002; Otranto et al. Reference Otranto, Testini, de Luca, Hu, Shamsi and Gasser2005), whilst closely related congeneric species display a range of variation of 10–20% (Blouin, Reference Blouin2002). Thus, if 2 individuals differ by 10% or more, one might question whether they really are conspecific (Blouin et al. Reference Blouin, Yowell, Courtney and Dame1998; Blouin, Reference Blouin2002). Thus, Blouin et al. (Reference Blouin, Yowell, Courtney and Dame1998) found a mitochondrial DNA sequence variation among individuals of the same species (intra-specific variation) of nematode averaging a fraction of a percent up to 1·2% and the maximum difference ever observed between a pair of individuals that were clearly members of the same interbreeding population of Ostertagia ostertagi was 6%. According to these authors, the percentages of similarity observed in the cox1 partial gene and ITS1-5.8S-ITS2 sequences of Trichuris populations could suggest other species of Trichuris than Trichuris arvicolae parasitizing Microtus townsendi and Chionomys roberti. Further morphological and molecular studies could test this hypothesis. It is well known for cryptic/sibling species to be described initially by molecular, karyotypic, ecological or behavioral characters and for minor morphological features to be detected subsequently (Jaarola and Searle, Reference Jaarola and Searle2004; Haukisalmi et al. Reference Haukisalmi, Hardman, Hardman, Rausch and Henttonen2008). Nevertheless, we must be careful, since only 1 individual could be collected from the Nearctic zone.
The phylogenetic analysis carried out on the basis of ribosomal DNA molecular markers suggested the existence of two genetic lineages (Nearctic and Palaearctic lineages) of Trichuris populations and the minimum spanning network showed all the haplotypes from European regions (clade 1) clustered together and with star-like pattern around haplotype 9. Based on coalescent theory (Slatkin and Hudson, Reference Slatkin and Hudson1991) this star topology showed that Trichuris populations had experienced a significant population expansion. At the centre of the network is haplotype 9, which is distributed widely and takes over the highest proportion in the population. This suggests that the haplotype 9 should be the ancestral haplotype. This same topology was found by Zhou et al. (Reference Zhou, Li, Yuan, Hu and Peng2011) in the cox1 gene haplotypes of Ascaris populations from humans and pigs from China.
These results are not in agreement with previous studies in other species of Trichuris (Callejón et al. Reference Callejón, de Rojas, Foronda, Feliú, Guevara and Cutillas2010). Thus, a phylogeographical study carried out on Trichuris muris, nematode parasitizing Murinae rodents from the Muridae family, isolated from 4 different hosts and from different geographical regions of Europe by amplification and sequencing of the ITS1-5.8S-ITS2 fragment of the ribosomal DNA, revealed 2 clear-cut geographical and genetic lineages: one of them was widespread from Northern Spain (Catalonia) to Denmark (Western European region), while the second was widespread in the Eastern and Southeastern European region (Croatia, Romania, and Turkey).
Mitochondrial results based on cox1 partial gene sequences revealed that T. arvicolae populations from the Palaearctic region are separated into 3 clear-cut geographical and genetic lineages corresponding to the Northern Europe (Finland, Scotland and Sweden), Southwestern and Southeastern Europe, and Central Asia (Spain, Croatia and Kazakhstan) and Italian and French populations. Thus, we can conclude that mitochondrial genome sequences clearly present data for analysing a phylogeographical pattern of Trichuris populations whereas the ribosomal genome sequences are not informative enough for this analysis. Nevertheless, previous results (Callejón et al. Reference Callejón, de Rojas, Foronda, Feliú, Guevara and Cutillas2010) established the phylogeographical pattern of Trichuris muris based on ribosomal DNA.
Wu et al. (2009) cited that the mitochondrial marker showed stronger genetic structure than the ribosomal marker because mtDNA is haploid, so that the effective population size is only one-quarter that of nuclear DNA (Page and Holmes, Reference Page and Holmes1998; Ballard and Whitlock, Reference Ballard and Whitlock2004). In addition, they suggest that cox1 is substantially more differentiated than ITS1 rDNA in the studied populations, and that nematode mtDNA evolves more quickly than the mtDNA of other taxa (Blouin et al. Reference Blouin, Yowell, Courtney and Dame1995; Anderson et al. Reference Anderson, Blouin and Beech1998). Mitochondrial DNA has been widely used in studies of population genetics, phylogeography and phylogeny because it provides easy access to an orthologous gene set with rapid evolution and with little or no recombination (Mas-Coma and Bargues, Reference Mas-Coma and Bargues2009). Derycke et al. (Reference Derycke, Backeljau, Vlaeminck, Vierstraete, Vanfleteren, Vincx and Moens2007) concluded that both cox1 and ITS data revealed high levels of molecular diversity, yet, the ITS data revealed the same 5 lineages, but divergence values between the populations were lower than in the mitochondrial cox1 gene.
Haplotype diversity (h) and nucleotide diversity (pi) are important indices to evaluate genetic diversity and differentiation, and a high value of the indices usually indicates a wealth of genetic diversity in the studied population (Huang et al. Reference Huang, Jiang, Chen and Wang2007; Liu et al. Reference Liu, Lu, Hu, Wang, Cui, Chi, Yan, Wang, Song and Xu2006). The estimation of nucleotide (pi) and haplotype (h) diversities performed on populations of Trichuris isolated from Arvicolinae hosts revealed higher nucleotide diversity than expected in Trichuris populations from the Åland Islands. According to Fernández-Palacios (Reference Fernández-Palacios, Pérez-Mellado and Ramón2010), one of the most important island features that make them a biologically interesting study system is the lower biological complexity of island communities when compared to equivalent mainland ones. Furthermore, Delicado et al. (Reference Delicado, Ramos, Machordom, Perez–Mellado and Ramon2010) cited that insular species were less variable genetically than continental species suggesting a more recent divergence of the former. Nevertheless, islands in the Baltic Sea are unique because inter-island distances are generally small, salinity is low, and seasonality is pronounced (Järvingen and Ranta, Reference Järvingen and Ranta1987). Furthermore, there is a long history of research on many of these islands rendering them suitable for studies in population and community ecology and conservation (Niemelä et al. Reference Niemelä, Ranta and Haila1985; Järvinen and Ranta, Reference Järvingen and Ranta1987; Ås et al. Reference Ås, Bengtsson and Ebenhard1997; Nieminen and Hanski, Reference Nieminen and Hanski1998).
Nieberding et al. (Reference Nieberding, Libois, Douady, Morand and Michaux2005) carried out the phylogeography of Heligmosomoides polygirus in the Western half of the Palaearctic region. The analysis of nucleotide diversity (pi) showed values above 0·012 obtaining maximum values of 0·026 corresponding to high genetic diversity. In our case, the low genetic variability observed in our material could be explained by the appearance of genetic bottlenecks during one of the last Ice Ages (Michaux et al. Reference Michaux, Magnanou, Paradis, Nieberding and Libois2003; Nieberding et al. Reference Nieberding, Morand, Libois and Michaux2004). This hypothesis is corroborated by 2 results: the very short branch length between haplotypes within this group in the distance analysis and the star-like topology in the minimum spanning network suggesting a rapid expansion from a small number of founder animals (Michaux et al. Reference Michaux, Magnanou, Paradis, Nieberding and Libois2003).
From a biogeographical point of view, Europe has some distinctive features. It is a large peninsula connected to Asia, with an east-west orientation. The Mediterranean Sea in the south constitutes a strong barrier, and has limited the possibility of southern displacement of biota during cold periods (Taberlet et al. Reference Taberlet, Fumagalli, Wust-Saucy and Cosson1998). Furthermore, the east-west orientation of the main mountain ranges of the Alps and the Pyrenees acted as a barrier to northward expansion of species during warm periods. The effects of the ice ages on European species has been examined in detail by Hewitt (Reference Hewitt1999): during the Quaternary, each species went through many contractions/expansions of range, characterized by extinctions of northern populations when the temperature decreased, and a northward expansion from refuges (e.g. in Carpathians) involving spreading from the leading edge. Such a colonization process implies successive bottlenecks that may lead to a loss of genetic diversity in the northern populations, with the exception of cold-tolerant taxa.
Furthermore, studies on the comparative phylogeny of taxa strongly linked by an ecological factor such as parasitism have shown that the degree of phylogenetic congruence increases with the obligate character of the host-parasite relationships (Nieberding et al. Reference Nieberding, Morand, Libois and Michaux2004). At an intra-specific level, it can be assumed that the phylogeographical patterns observed between species linked by a parasitic relationship are likely to be congruent in time as well as space, providing the parasite is specific and obligate (Price, Reference Price1980). Thus, the degree of genetic differentiation among parasite populations depends on gene flow, which is generally determined by host mobility, effective (i.e. breeding) population sizes, which is determining the rate of genetic drift and therefore the rate of independent differentiation of populations, and reproductive mode (Blouin et al. Reference Blouin, Yowell, Courtney and Dame1995; Nadler et al. Reference Nadler, Lindquist and Near1995). Huyse et al. (Reference Huyse, Poulin and Theron2005) concluded that parasite population ecology and population genetics are closely linked. More specifically, they argue that the structure of parasite populations correlates with (i) host mobility, (ii) mode of reproduction of the parasite, (iii) complexity of the parasite life cycle, (iv) parasite infrapopulation size and (v) host specificity. The importance of these factors varies from one parasite species to the next. Therefore, a comparative approach with a phylogenetic perspective is crucial to disentangle the various processes that drive parasite diversification.
Trichuris arvicolae is a parasite of the caecum of specific hosts (Arvicolinae) and has a direct life cycle; therefore, the biogeography of this parasite is closely linked to the biogeography of its host. Jaarola and Searle (Reference Jaarola and Searle2002) studied the phylogeography of field voles (Microtus agrestis) in Eurasia inferred from mitochondrial DNA sequences and found 3 phylogenetic lineages corresponding with 3 phylogeographical groups with strict geographical distributions labelled as ‘southern’, ‘eastern’ and ‘western’. Furthermore, they cited that the western and eastern lineages entered Fennoscandia from the south and northeast, respectively.
These results were similar to those observed by Nieberding et al. (Reference Nieberding, Libois, Douady, Morand and Michaux2005) of Heligmosoides polygyrus from western Palaearctic region, and Wu et al. (2009) in Camallanus cotti from China.
The mtDNA analysis of Trichuris populations from voles shows signs of a post-glacial northward population expansion starting from the Pyrenees and Italy. Apparently, the Pyrenees and the Alps were not barriers to the dispersal of Trichuris arvicolae populations. Similar results were obtained by Seddon et al. (Reference Seddon, Tobias, Yount, Butchart, Ramanampamonjy and Randrianizahana2001) for Erinaceus europaeus. Thus, mtDNA data showed signals of a post-glacial northward population expansion starting from 3 refugia: Iberia, Italy and the Balkans.
ACKNOWLEDGEMENTS
We wish to thank Mr Geoffrey Giddings for the critical reading of the manuscript, and Voitto Haukisalmi for his collaboration. The research has been funded by a grant from the Ministry of Science and Technology (CGL2008-01459/BOS) and the Generalitat of Catalonia (Ref: 2009SGR403). Material collection was financed by grants from the Research Council for Biosciences and Environment in Finland (Finnish Academy, project nos 40813 and 50474), from University of Helsinki (Clean Baikal project), and Oskar Öflund Foundation., Some of the European materials have been collected in the connection of hantavirus research financed by the EU grants QLK2-CT-2002-01358 and GOCE-CT-2003-010284 EDEN. We thank all people who have supported our material collection.