1. Introduction
Since Faraday (Reference Faraday1831) identified that regular patterns can appear on the surface of a shaken container of fluid, the Faraday experiment has been an important system for investigating pattern formation. Experiments in the 1980s, such as those conducted by Simonelli & Gollub (Reference Simonelli and Gollub1989), tended to focus on the dynamics of the interaction of patterns in small containers excited by a sinusoidal forcing with a single frequency component. More recently the focus has switched to larger containers with multiple frequency components: as pointed out in Arbell & Fineberg (Reference Arbell and Fineberg1998), one special feature of the Faraday experiment is that by using multiple-frequency forcing one can investigate the interaction of a small number of controllable modes with different characteristic length scales. This provides some middle ground between pattern-forming systems where the initial instability involves just a single mode, and in which complexity then results from secondary bifurcations, such as in the Bénard–Marangoni experiment or the Taylor–Couette experiment, and cases where a system is highly turbulent and many spatial and temporal modes are excited.
Within the Faraday experiment, a rich variety of complex patterns are seen, some of which have a complicated spatial structure but are time-periodic with the periodicity of the drive, and some with both a complicated spatial and temporal structure. Aside from the ubiquitous stripes, squares and hexagons, observed patterns include: quasipatterns (Christiansen, Alström & Levinsen Reference Christiansen, Alström and Levinsen1992; Edwards & Fauve Reference Edwards and Fauve1994); superlattice patterns (SL1) (Kudrolli, Pier & Gollub Reference Kudrolli, Pier and Gollub1998; Epstein & Fineberg Reference Epstein and Fineberg2006); spatially subharmonic superlattice states, modulated hexagonal disorder, two-mode superlattices and unlocked states (Arbell & Fineberg Reference Arbell and Fineberg1998); oscillons (Arbell & Fineberg Reference Arbell and Fineberg2000); and double hexagon states (Arbell & Fineberg Reference Arbell and Fineberg1998). An excellent summary of many of the experimental results is given in Arbell & Fineberg (Reference Arbell and Fineberg2002).
In parallel with the experiments, theoretical advances have resulted in an effective numerical method for performing the linear stability analysis of the Navier–Stokes equation that marks the transition from an unpatterned to patterned state (Kumar & Tuckerman Reference Kumar and Tuckerman1994). The challenge here is that many of the experiments are carried out at moderate viscosity, whereas early theoretical results of Benjamin & Ursell (Reference Benjamin and Ursell1954), which help explain the underlying instability mechanism, are for an inviscid fluid. There have also been theoretical explanations for why, unlike the Bénard–Marangoni system, the observed patterned states include superlattice patterns (Silber & Proctor Reference Silber and Proctor1998; Silber & Skeldon Reference Silber and Skeldon1999; Silber, Topaz & Skeldon Reference Silber, Topaz and Skeldon2000; Rucklidge & Silber Reference Rucklidge and Silber2009).
These theoretical mechanisms rely on three-wave resonance between critical modes and modes close to critical and have successfully explained why particular superlattice patterns are observed. The suggested theoretical mechanism for the appearance of superlattice patterns is compelling, and the link between which modes are excited and which patterns are observed has been explored in some detail experimentally (for example, see Arbell & Fineberg (Reference Arbell and Fineberg2002) and Epstein & Fineberg (Reference Epstein and Fineberg2006)). However, without carrying out a careful quantitative comparison between experiment and theory, it is hard to know the extent to which the theoretical ideas really do explain the experimental results (Bodenschatz, Pesch & Ahlers Reference Bodenschatz, Pesch and Ahlers2000). This is particularly true for the Faraday experiment, where, as we will explain in greater detail below, the very region for which the theory predicts superlattice patterns is the region for which some of the underlying assumptions of the theory break down.
While it is not possible to write down closed-form solutions of the full Navier–Stokes equations for the Faraday problem, quantitative predictions of the patterns expected near the transition from non-patterned to patterned states can be made using weakly nonlinear analysis (Skeldon & Guidoboni Reference Skeldon and Guidoboni2007). Weakly nonlinear analysis centres on using an asymptotic expansion in terms of the slowly varying amplitudes of the critical modes at onset, using ideas first developed in Malkus & Veronis (Reference Malkus and Veronis1958) and Segel & Stuart (Reference Segel and Stuart1962) in the context of convection experiments. Analysis of the resulting amplitude equations leads to predictions on the relative stability of different patterned states.
Our aim in this paper is to do a quantitative comparison between previously published experimental results and a weakly nonlinear analysis of the Navier–Stokes equations for the Faraday problem, with a particular focus on multiple-frequency forcing. A previous comparison between the theory and experiments in the Faraday problem was carried out by Westra, Binks & van de Water (Reference Westra, Binks and van de Water2003) for single-frequency forcing, in which the authors declare that the excellent agreement they observe means that the Faraday problem is essentially a ‘solved problem’. In particular, their paper uses a Lyapunov stability argument based on the theory of Chen & Viñals (Reference Chen and Viñals1999) to find the ‘most stable’ pattern as a function of the key non-dimensional groups in the problem representing non-dimensional measures of viscous, gravitational and surface tension forces. Results from this theoretical study agree very well with the author’s experimental results. However, the extension to multiple-frequency forcing is far from trivial. The method used by Chen & Viñals (Reference Chen and Viñals1999) to reduce the Navier–Stokes equations to amplitude equations is not applicable, and the more general theory in Skeldon & Guidoboni (Reference Skeldon and Guidoboni2007) is needed; the addition of more frequency components introduces more non-dimensional parameters, resulting in a much greater ability to probe underlying three-wave mechanisms. Consequently, patterns such as superlattice patterns, which are not observed in the single-frequency context, are found. In fact, as we will show, for multiple-frequency excitation there remain many open questions. We note also that Westra et al. (Reference Westra, Binks and van de Water2003) use a Lyapunov stability argument to determine preferred patterns. We use similar arguments, but have in addition carried out a bifurcation analysis of the relevant amplitude equations. This has the added benefit of not only determining the ‘most stable’ pattern, but also indicating regions where patterns are bistable.
Specifically, in this paper we discuss to what extent the existing weakly nonlinear theory can explain observed patterns in multiple-frequency Faraday experiments and provide some new explanations in some cases. While agreement is very good in many cases, we note that quantitatively linking theory with experiment is particularly challenging after-the-fact, as the results are sensitive to precise values of viscosity and surface tension, and even the sign of the drive term, something that is not normally recorded. There are also places where the analysis strongly suggests that patterns should have a subharmonic component, when no subharmonic component has been observed. In particular, with regard to the superlattice patterns, we discuss two methods that have been used to promote the stability of superlattice patterns: firstly by approaching the so-called bicritical point in two-frequency forced experiments; and, secondly, by adding a third frequency to the drive. We highlight the differences between these two mechanisms.
Overall, we confirm that three-wave interactions sit at the heart of why complex patterns are stabilised. However, the discrepancies between theory and experiment suggest the need for further experimental and theoretical work to fully investigate the issues of pattern bistability and the role of bicritical/tricritical points in determining bifurcation structure.
2. Equations
Using a variety of container shapes, Edwards & Fauve (Reference Edwards and Fauve1994) elegantly demonstrated that many of the patterns that occur with moderate viscosity fluids in large containers are not strongly dependent on the lateral boundaries of the container. Consequently, it is a reasonable modelling assumption to consider an infinite horizontal layer of viscous incompressible fluid of finite depth that is subjected to gravity
 $\tilde{g}$
and to a vertical periodic excitation with non-dimensional frequency components
 $j{\it\omega}$
. At the lower boundary the fluid is in contact with a rigid plane, while at the upper boundary the surface is open to the atmosphere. This means that the upper surface is a free boundary whose shape and evolution is an unknown of the problem.
The motion of the fluid can be described by the Navier–Stokes equations, where, to take account of the parametric excitation, a frame of reference which is moving with the periodic excitation is considered. The
 $z$
-axis is chosen perpendicular to the rigid plane at the bottom, which lies at
 $z=-\tilde{h}/\tilde{l}$
, where
 $\tilde{h}/\tilde{l}$
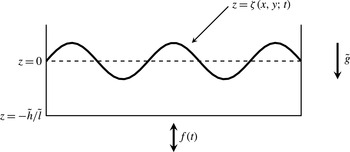
is the non-dimensional depth of the layer when the fluid is at rest. A sketch of the geometry is shown in figure 1. Assuming the free surface may be written as
 $z={\it\zeta}(x,y;t)$
, which excludes the formation of droplets or breaking waves, then the fluid motion in the bulk is described by the dimensionless incompressible Navier–Stokes equations
 $$\begin{eqnarray}\displaystyle & \boldsymbol{{\rm\nabla}}\boldsymbol{\cdot }\boldsymbol{u}=0, & \displaystyle\end{eqnarray}$$
 $$\begin{eqnarray}\displaystyle & \partial _{t}\boldsymbol{u}+\boldsymbol{u}\boldsymbol{\cdot }\boldsymbol{{\rm\nabla}}\boldsymbol{u}=-\boldsymbol{{\rm\nabla}}\mathscr{P}+C{\rm\Delta}\boldsymbol{u}-(1+f(t))\boldsymbol{e}_{3}, & \displaystyle\end{eqnarray}$$
 $\boldsymbol{u}=(u,v,w)$
is the velocity field,
 $\mathscr{P}$
the pressure and for multiple-frequency excitation,
 $$\begin{eqnarray}f(t)=\mathop{\sum }_{j}a_{j}\cos (\,j{\it\omega}t+{\it\phi}_{j}),\end{eqnarray}$$
where
 $j$
are integers and the non-dimensional amplitudes
 $a_{j}$
and phases
 ${\it\phi}_{j}$
are real.
Sketch of a cross-section through the layer of fluid.

It is assumed that the bottom of the container is rigid so that at
 $z=-\tilde{h}/\tilde{l}$
the fluid satisfies the no-slip boundary conditions
 $$\begin{eqnarray}u=v=w=0.\end{eqnarray}$$
At the free surface
 $z={\it\zeta}(x,y;t)$
we have the kinematic condition, which says that the surface is advected by the fluid, and two further conditions, one for the balance of the tangential stresses and one for the balance of normal stresses. This leads to three conditions at
 $z={\it\zeta}(x,y;t)$
, namely
 $$\begin{eqnarray}\displaystyle \left.\begin{array}{@{}c@{}}\partial _{t}{\it\zeta}+u\partial _{x}{\it\zeta}+v\partial _{y}{\it\zeta}=w,\\ \boldsymbol{t}_{1}\boldsymbol{\cdot }\unicode[STIX]{x1D64F}\boldsymbol{n}=\boldsymbol{t}_{2}\boldsymbol{\cdot }\unicode[STIX]{x1D64F}\boldsymbol{n}=0,\\ -\mathscr{P}+2C\boldsymbol{n}\unicode[STIX]{x1D63F}(\boldsymbol{u})\boldsymbol{n}=B\mathscr{H}-p_{e},\end{array}\right\} & & \displaystyle\end{eqnarray}$$
where
 $\unicode[STIX]{x1D64F}=-\mathscr{P}\unicode[STIX]{x1D644}+2C\unicode[STIX]{x1D63F}(\boldsymbol{u})$
is the stress tensor,
 $\unicode[STIX]{x1D63F}(\boldsymbol{u})=(\boldsymbol{{\rm\nabla}}\boldsymbol{u}+\boldsymbol{{\rm\nabla}}^{\text{T}}\boldsymbol{u})/2$
is the rate-of-strain tensor, and
 $\mathscr{H}=\boldsymbol{{\rm\nabla}}_{H}\boldsymbol{\cdot }(\boldsymbol{{\rm\nabla}}_{H}{\it\zeta}/\sqrt{1+|\boldsymbol{{\rm\nabla}}_{H}{\it\zeta}|^{2}})$
is the double mean curvature. Note that
 $\boldsymbol{{\rm\nabla}}=(\boldsymbol{{\rm\nabla}}_{H},\partial _{z})$
and
 $\boldsymbol{{\rm\nabla}}_{H}=(\partial _{x},\partial _{y})$
. The unit normal and tangent vectors are defined as
 $$\begin{eqnarray}\displaystyle & \displaystyle \boldsymbol{n}(x,y;t)=\left(-\frac{\partial _{x}{\it\zeta}}{\sqrt{1+|\boldsymbol{{\rm\nabla}}_{H}{\it\zeta}|^{2}}},-\frac{\partial _{y}{\it\zeta}}{\sqrt{1+|\boldsymbol{{\rm\nabla}}_{H}{\it\zeta}|^{2}}},\frac{1}{\sqrt{1+|\boldsymbol{{\rm\nabla}}_{H}{\it\zeta}|^{2}}}\right), & \displaystyle\end{eqnarray}$$
 $$\begin{eqnarray}\displaystyle & \displaystyle \boldsymbol{t}_{1}(x,y;t)=\left(\frac{1}{\sqrt{1+|\partial _{x}{\it\zeta}|^{2}}},0,\frac{\partial _{x}{\it\zeta}}{\sqrt{1+|\partial _{x}{\it\zeta}|^{2}}}\right), & \displaystyle\end{eqnarray}$$
 $$\begin{eqnarray}\displaystyle & \displaystyle \boldsymbol{t}_{2}(x,y;t)=\left(0,\frac{1}{\sqrt{1+|\partial _{y}{\it\zeta}|^{2}}},\frac{\partial _{y}{\it\zeta}}{\sqrt{1+|\partial _{y}{\it\zeta}|^{2}}}\right). & \displaystyle\end{eqnarray}$$
 $\tilde{l},\sqrt{\tilde{l}/\tilde{g}},\sqrt{\tilde{g}\tilde{l}}$
and
 $\tilde{{\it\varrho}}\tilde{g}\tilde{l}$
, respectively, where
 $\tilde{{\it\varrho}}$
is the density of the fluid and
 $\tilde{g}$
is the acceleration due to gravity. The length scale
 $\tilde{l}$
is taken to be a length scale that is typical for the problem, such as the primary wavelength of the observed patterns. Here,
 $p_{e}$
is the dimensionless pressure of the external ambient fluid and is assumed known. There are two non-dimensional parameters associated with the fluid, namely:
 $C=\tilde{{\it\nu}}/(\tilde{g}\tilde{l}^{3})^{1/2}$
, the square of the inverse of the Galileo number, and
 $B=\tilde{{\it\sigma}}/\tilde{{\it\varrho}}\tilde{g}\tilde{l}^{2}$
, the inverse Bond number, where
 $\tilde{{\it\nu}}$
is the kinematic viscosity and
 $\tilde{{\it\sigma}}$
is the surface tension. These two non-dimensional parameters measure the relative importance of viscous and surface tension forces compared to gravity, respectively. There are three other sets of non-dimensional parameters of importance, all associated with the excitation. These are: the non-dimensional amplitudes
 $a_{j}$
, frequencies
 $j{\it\omega}$
and phases
 ${\it\phi}_{j}$
of the components of the excitation. In the comparison with experiments it is frequently useful to quote the relevant dimensional values: we have used the convention that all dimensional variables are labelled with a tilde.
As in Kumar & Tuckerman (Reference Kumar and Tuckerman1994), it is convenient to define a new pressure,
 $$\begin{eqnarray}p=\mathscr{P}+(1+f(t))z,\end{eqnarray}$$
which has the effect of shifting the acceleration term from the momentum equation to the normal stress condition. In addition, we eliminate the pressure from the momentum equation by taking
 $-(\boldsymbol{{\rm\nabla}}\times \boldsymbol{{\rm\nabla}}\times )$
. Using the relation
 $\boldsymbol{{\rm\nabla}}\times \boldsymbol{{\rm\nabla}}\times \boldsymbol{u}=\boldsymbol{{\rm\nabla}}(\boldsymbol{{\rm\nabla}}\boldsymbol{\cdot }\boldsymbol{u})-{\rm\Delta}\boldsymbol{u}$
and the fact that
 $\boldsymbol{{\rm\nabla}}\boldsymbol{\cdot }\boldsymbol{u}=0$
, the problem then becomes
 $$\begin{eqnarray}\displaystyle & \boldsymbol{{\rm\nabla}}\boldsymbol{\cdot }\boldsymbol{u}=0, & \displaystyle\end{eqnarray}$$
 $$\begin{eqnarray}\displaystyle & \partial _{t}{\rm\Delta}\boldsymbol{u}-C{\it\Delta}{\rm\Delta}\boldsymbol{u}=\boldsymbol{{\rm\nabla}}\times \boldsymbol{{\rm\nabla}}\times (\boldsymbol{u}\boldsymbol{\cdot }\boldsymbol{{\rm\nabla}}\boldsymbol{u}), & \displaystyle\end{eqnarray}$$
 $z=-\tilde{h}/\tilde{l}$
,
 $$\begin{eqnarray}u=v=w=0\end{eqnarray}$$
and on
 $z={\it\zeta}$
,
 $$\begin{eqnarray}\displaystyle \left.\begin{array}{@{}c@{}}\partial _{t}{\it\zeta}+u\partial _{x}{\it\zeta}+v\partial _{y}{\it\zeta}=w,\\ \boldsymbol{t}_{1}\boldsymbol{\cdot }\unicode[STIX]{x1D64F}\boldsymbol{n}=\boldsymbol{t}_{2}\boldsymbol{\cdot }\unicode[STIX]{x1D64F}\boldsymbol{n}=0,\\ 2C\boldsymbol{n}\unicode[STIX]{x1D63F}(\boldsymbol{u})\boldsymbol{n}=B\mathscr{H}+p-p_{e}-(1+f(t)){\it\zeta}.\end{array}\right\} & & \displaystyle\end{eqnarray}$$
Equations (2.11) with boundary conditions (2.12) and (2.13) have a trivial solution,
 $$\begin{eqnarray}\boldsymbol{u}=\mathbf{0},\quad p=p_{e},\quad {\it\zeta}=0.\end{eqnarray}$$
This solution corresponds to an unpatterned state where there is no relative motion of the fluid with respect to the moving frame so the surface of the fluid is flat.
3. Does linear theory agree with experiments?
Understanding the linear stability of the unpatterned state is at the heart of understanding many of the nonlinear patterns that are formed close to onset. This is because when the unpatterned state becomes unstable to one critical mode with a given critical wavenumber, there are often several other modes with different wavenumbers that are themselves only weakly damped. This is particularly true with multiple-frequency forcing. Resonant interaction of instabilities from different critical/close to critical modes drive the selection mechanisms for the occurrence of particular patterns (Silber et al. Reference Silber, Topaz and Skeldon2000).
Benjamin & Ursell (Reference Benjamin and Ursell1954) recognised that the linear stability of the flat-surface solution for an inviscid, infinite depth fluid driven by a single frequency reduces to a Mathieu equation. The Mathieu equation contains two parameters, related to the frequency
 $\tilde{{\it\omega}}$
and amplitude
 $\tilde{a}$
of the excitation, respectively. Solutions to the Mathieu equation divide the parameter plane into regions of bounded and regions of unbounded solutions, where the regions of unbounded solutions form tongues that touch the frequency axis at frequencies
 $m\tilde{{\it\omega}}/2,m=1,2,\dots$
, the largest tongue occurring for
 $m=1$
. The tongues are typically classified as either harmonic or subharmonic, depending on whether or not they are an integer multiple of the frequency
 $\tilde{{\it\omega}}$
. This picture is modified with the addition of damping: the boundaries of the regions are perturbed and no longer touch the frequency axis, consequently, a finite amplitude of excitation is required to excite waves; the regions of bounded solutions become regions where the unpatterned state is locally stable; the unbounded regions become regions where the unpatterned state is unstable.
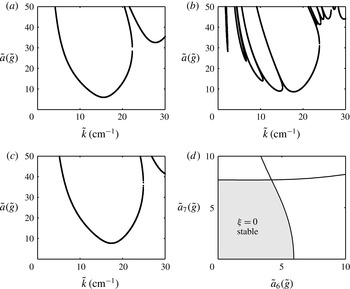
Kumar & Tuckerman (Reference Kumar and Tuckerman1994) identified a numerical method to find the instability tongues that can be used for all fluid viscosities and all depths and applied it to the case of single-frequency excitation. This was extended to multiple-frequency excitation by Besson, Edwards & Tuckerman (Reference Besson, Edwards and Tuckerman1996). A typical example of tongues computed using (Besson et al. Reference Besson, Edwards and Tuckerman1996)’s method and the corresponding bifurcation set for the primary stability boundary is shown in figure 2.
Typical tongues and linear stability region for the unpatterned state computed using the method of Besson et al. (Reference Besson, Edwards and Tuckerman1996). Parameters as for Kudrolli et al. (Reference Kudrolli, Pier and Gollub1998): the (dimensional) excitation is
 $\tilde{f}(\tilde{t})=\tilde{a}_{6}\cos 6\tilde{{\it\omega}}\tilde{t}+\tilde{a}_{7}\cos (7\tilde{{\it\omega}}\tilde{t}+{\it\phi}_{7})$
, where
 $\tilde{a}_{6}=\tilde{a}\cos {\it\chi}$
,
 $\tilde{a}_{7}=\tilde{a}\sin {\it\chi}$
,
 ${\it\phi}_{7}=20^{\circ }$
,
 $\tilde{{\it\omega}}/2{\rm\pi}=16.44~\text{Hz}$
,
 $\tilde{{\it\sigma}}=20.6~\text{dyn}~\text{cm}^{-1}$
,
 $\tilde{{\it\nu}}=0.20~\text{cm}^{2}~\text{s}^{-1}$
,
 $\tilde{{\it\varrho}}=0.95~\text{g}~\text{cm}^{-3}$
,
 $\tilde{h}=0.3~\text{cm}$
. Note that the structure inherited from the Mathieu equation is seen by the fact that the minimum of each tongue occurs at half-integer multiples of the drive frequency. In (a)
 ${\it\chi}=0^{\circ }$
, the forcing reduces to
 $\tilde{f}(\tilde{t})=\tilde{a}_{6}\cos 6\tilde{{\it\omega}}\tilde{t}$
, with a forcing frequency of
 $6\tilde{{\it\omega}}$
. The largest tongue has a minimum for wavenumber of approximately
 $15~\text{cm}^{-1}$
for a forcing amplitude
 $\tilde{a}$
of approximately
 $7.5\tilde{g}$
and corresponds to a mode of frequency
 $6\tilde{{\it\omega}}/2$
. In (c),
 ${\it\chi}=90^{\circ }$
the forcing reduces to
 $\tilde{f}(\tilde{t})=\tilde{a}_{7}\cos 7\tilde{{\it\omega}}\tilde{t}$
with a forcing frequency of
 $7\tilde{{\it\omega}}$
leading to a primary instability mode with frequency
 $7\tilde{{\it\omega}}/2$
. In the case of (b),
 ${\it\chi}=63^{\circ }$
, the presence of both
 $6\tilde{{\it\omega}}$
and
 $7\tilde{{\it\omega}}$
components in the forcing frequency mean that the drive has periodicity
 $2{\rm\pi}/\tilde{{\it\omega}}$
and is therefore of frequency
 $\tilde{{\it\omega}}$
. This leads to tongues at
 $m\tilde{{\it\omega}}/2,\dots ,m=1,2,\dots$
. The first five tongues that are visible from left to right correspond to:
 $\tilde{{\it\omega}}/2,4\tilde{{\it\omega}}/2,5\tilde{{\it\omega}}/2,6\tilde{{\it\omega}}/2,7\tilde{{\it\omega}}/2$
. The largest tongues correspond to the
 $6\tilde{{\it\omega}}/2$
and the
 $7\tilde{{\it\omega}}/2$
modes and are driven by the two main frequency components of the drive. There are tongues corresponding to modes with frequency
 $2\tilde{{\it\omega}}/2$
and
 $3\tilde{{\it\omega}}/2$
but these occur off the top of the region shown. This particular value of
 ${\it\chi}$
is close to the ‘bicritical’ point where both harmonic modes with frequency
 $6\tilde{{\it\omega}}/2$
and subharmonic modes with frequency
 $7\tilde{{\it\omega}}/2$
onset simultaneously. It is close to this bicritical point that many of the exotic patterns are observed. (d) Bifurcation set showing the position of the tongue minimum that marks the instability of the unpatterned state, as a function of
 $\tilde{a}_{6}$
and
 $\tilde{a}_{7}$
.

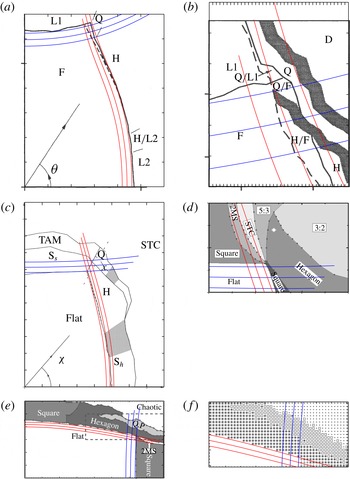
The linear stability problem appears to be solved: the numerical method works well and in Besson et al. (Reference Besson, Edwards and Tuckerman1996) the authors show that there is excellent agreement between their linear stability calculations and experiments. However, unless experiments and theory are carried out hand-in-hand, in practice there remain some difficulties in obtaining really good agreement between theory and experiment even for this first transition from patterned to unpatterned state. This is illustrated in figure 3, where numerical linear stability results are superimposed on the experimental bifurcation sets published in: Edwards & Fauve (Reference Edwards and Fauve1994) (panels (a,b)); Kudrolli et al. (Reference Kudrolli, Pier and Gollub1998) (panel (c)); Epstein & Fineberg (Reference Epstein and Fineberg2006) (panel (d)); and Ding & Umbanhowar (Reference Ding and Umbanhowar2006) (panels (e, f)).
Comparison of the experimentally measured transition from unpatterned to patterned state with numerically calculated linear stability curves using the method of Besson et al. (Reference Besson, Edwards and Tuckerman1996). For each of the numerical calculations, three different values for the viscosity are used. (a,b) Numerical curves overlaid on figure 12 of Edwards & Fauve (Reference Edwards and Fauve1994). Adapted with permission from Edwards & Fauve (Reference Edwards and Fauve1994). Copyrighted by the Journal of Fluid Mechanics.
 $\tilde{{\it\sigma}}=65~\text{dyn}~\text{cm}^{-1}$
;
 $\tilde{{\it\nu}}=1.00\pm 0.05~\text{cm}^{2}~\text{s}^{-1}$
;
 $\tilde{{\it\varrho}}=1.22~\text{g}~\text{cm}^{-3}$
;
 $\tilde{h}=0.29~\text{cm}$
;
 $\tilde{a}_{j},~j=\{4,5\}$
;
 ${\it\phi}_{4}=0$
;
 ${\it\phi}_{5}=75^{\circ }$
;
 $\tilde{{\it\omega}}/2{\rm\pi}=14.6~\text{Hz}$
. (c) Numerical curves overlaid on figure 6(a) of Kudrolli et al. (Reference Kudrolli, Pier and Gollub1998) reprinted from Physica D, Vol 123, A. Kudrolli, B. Pier and J. P. Gollub, ‘Superlattice patterns in surface waves’, pp. 99–111, Copyright (1998), with permission from Elsevier.
 $\tilde{{\it\sigma}}=20.6~\text{dyn}~\text{cm}^{-1}$
;
 $\tilde{{\it\nu}}=0.20\pm 0.01~\text{cm}^{2}~\text{s}^{-1}$
;
 $\tilde{{\it\varrho}}=0.95~\text{g}~\text{cm}^{-3}$
;
 $\tilde{h}=0.3~\text{cm}$
;
 $\tilde{a}_{j},j=\{4,5\}$
;
 ${\it\phi}_{4}=0$
;
 ${\it\phi}_{5}=16^{\circ }$
;
 $\tilde{{\it\omega}}/2{\rm\pi}=22~\text{Hz}$
. (d) Numerical curves overlaid on figure 2 of Epstein & Fineberg (Reference Epstein and Fineberg2006). Adapted with permission from Epstein & Fineberg (Reference Epstein and Fineberg2006). Copyrighted by the American Physical Society.
 $\tilde{{\it\sigma}}=20.6~\text{dyn}~\text{cm}^{-1}$
;
 $\tilde{{\it\nu}}=0.180\pm 0.009~\text{cm}^{2}~\text{s}^{-1}$
;
 $\tilde{{\it\varrho}}=0.949~\text{g}~\text{cm}^{-3}$
;
 $\tilde{h}=0.3~\text{cm}$
;
 $\tilde{a}_{j},j=\{6,7\}$
;
 ${\it\phi}_{j}=0^{\circ }$
;
 $\tilde{{\it\omega}}/2{\rm\pi}=14~\text{Hz}$
. (e, f) Numerical curves overlaid on figures 1 and 3(a) of Ding & Umbanhowar (Reference Ding and Umbanhowar2006). Adapted with permission from Ding & Umbanhowar (Reference Ding and Umbanhowar2006). Copyrighted by the American Physical Society.
 $\tilde{{\it\sigma}}=20.6~\text{dyn}~\text{cm}^{-1}$
;
 $\tilde{{\it\nu}}=0.20\pm 0.01~\text{cm}^{2}~\text{s}^{-1}$
;
 $\tilde{{\it\varrho}}=0.95~\text{g}~\text{m}^{-3}$
;
 $\tilde{{\it\varrho}}=0.95~\text{g}~\text{cm}^{-3}$
;
 $\tilde{h}=0.65~\text{cm}$
;
 $\tilde{a}_{j},j=\{4,5\}$
;
 ${\it\phi}_{4}=0$
;
 ${\it\phi}_{5}=16^{\circ }$
;
 $\tilde{{\it\omega}}/2{\rm\pi}=20~\text{Hz}$
.

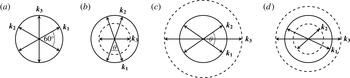
Possible spatial three-wave resonant interactions defined such that
 $\boldsymbol{k}_{\mathbf{1}}+\boldsymbol{k}_{\mathbf{2}}=\boldsymbol{k}_{\mathbf{3}}$
. (a)
 $|\boldsymbol{k}_{\mathbf{1}}|=|\boldsymbol{k}_{\mathbf{2}}|=|\boldsymbol{k}_{\mathbf{3}}|$
; (b)
 $|\boldsymbol{k}_{\mathbf{1}}|=|\boldsymbol{k}_{\mathbf{2}}|>|\boldsymbol{k}_{\mathbf{3}}|$
; (c)
 $|\boldsymbol{k}_{\mathbf{1}}|=|\boldsymbol{k}_{\mathbf{2}}|<|\boldsymbol{k}_{\mathbf{3}}|$
; (d)
 $|\boldsymbol{k}_{\mathbf{1}}|\neq |\boldsymbol{k}_{\mathbf{2}}|\neq |\boldsymbol{k}_{\mathbf{3}}|$
.

The central issue here is that the position of the curves is sensitive to the values of the surface tension, density and viscosity, yet the values quoted in papers are often taken from the manufacturers’ specifications for the fluids used. In order to illustrate the issue, in each case we have plotted the linear stability curves for the quoted viscosity and the quoted viscosity plus or minus 5 %, a typical quoted tolerance for the viscosity value. From figure 3 we see that: for the experiments in Edwards & Fauve (Reference Edwards and Fauve1994) and Ding & Umbanhowar (Reference Ding and Umbanhowar2006), the upper extreme for the viscosity fits the data best (panels (a,b,e, f)); for those in Kudrolli et al. (Reference Kudrolli, Pier and Gollub1998), the lower extreme fits the subharmonic boundary best, but not the harmonic boundary (panel (c)); for the experiments in Epstein & Fineberg (Reference Epstein and Fineberg2006) the linear stability analysis suggests that the actual viscosity of the fluid was higher than the upper value (panel (d)). We have focused here on viscosity because, for the different fluids used in the results presented here, errors in the viscosity have the biggest effect on the linear stability boundary. An error in the viscosity of 5 % can result in an error in the linear stability boundary of 5 %, whereas a 5 % error in either the surface tension or the density leading to a 5 % error in the ratio
 $\tilde{{\it\sigma}}/\tilde{{\it\varrho}}$
leads to an error in the linear stability boundary of only around 1 %.
Our aim in this paper is to compare weakly nonlinear theory with experiments. Since the transitions from one preferred patterns to another turn out to be quite delicate, clearly it is only realistic to hope for agreement for nonlinear pattern selection if there is first excellent agreement with linear theory. In making our nonlinear comparisons below, we have therefore used values of the viscosity found by fitting the linear theory to the published data.
4. Predicting patterns close to onset
4.1. Theoretical ideas
Once a mode with a given wavenumber has become unstable, the fact that there is no preferred horizontal direction means that standing waves of any orientation can occur. In the Bénard–Marangoni experiment, which has a similar orientational invariance, this means that patterns consisting of nonlinear superpositions of modes with wavevectors of the same wavenumber but different orientations often lead to the observation of patterns with, for example, hexagonal symmetry. In principle, superlattice patterns could also occur in convection experiments (Skeldon & Silber Reference Skeldon and Silber1998), but in practice they have not been seen without the addition of a vertical oscillation, as in Rogers et al. (Reference Rogers, Schatz, Brausch and Pesch2000).
The ubiquitous occurrence of hexagons is a consequence of the importance of three-wave interactions in determining which patterned states occur: three-wave interactions give rise to the lowest-order nonlinear (quadratic) terms in the amplitude equations that describe behaviour close to onset. For Bénard–Marangoni convection, where instability to a single dominant wavenumber occurs, the three-wave interaction of importance occurs between three wavevectors with the same critical wavenumber, as shown in figure 4(a). A distinct feature of the Faraday problem is that the Mathieu tongue-like structure to the linear stability problem means that, although typically there is a single mode that becomes unstable first, there are nearby modes with different wavenumbers that are only weakly damped. This can give rise to other three-wave interactions of relevance, such as those shown in figure 4(b–d).
These three-wave interactions involve waves with wavevectors
 $\boldsymbol{k}_{\mathbf{1}},\boldsymbol{k}_{\mathbf{2}}$
and
 $\boldsymbol{k}_{\mathbf{3}}$
and respective frequencies
 $n{\it\omega}/2,p{\it\omega}/2$
and
 $q{\it\omega}$
. For the three waves to interact they must satisfy a spatial resonance condition,
 $$\begin{eqnarray}\pm \boldsymbol{k}_{\mathbf{1}}\pm \boldsymbol{k}_{\mathbf{2}}=\boldsymbol{k}_{\mathbf{3}},\end{eqnarray}$$
and a temporal resonance condition. In the spatial resonance condition the choice of sign arises because the waves are standing waves and so have spatial Fourier components with both signs of wavevector. The temporal resonance condition depends on both the frequencies of the waves and the various frequencies contained within the forcing term
 $f(t)$
and requires
 $$\begin{eqnarray}\pm \frac{n}{2}\pm \frac{p}{2}\pm \,j=q\end{eqnarray}$$
where
 $j$
is one of the frequency components of the drive see (2.3), cf. Topaz, Porter & Silber (Reference Topaz, Porter and Silber2004), and where all possible sign combinations of the different terms on the left-hand side need to be considered because the waves are standing waves and the forcing is real.
The fact that a temporal resonance condition needs to be satisfied is one feature that distinguishes the Faraday problem from Swift–Hohenberg multiple-resonance problems such as those studied in Müller (Reference Müller1994), Lifshitz & Petrich (Reference Lifshitz and Petrich1997), Rucklidge, Silber & Skeldon (Reference Rucklidge, Silber and Skeldon2012) and others. This means that results from Swift–Hohenberg-like equations need to be interpreted with care when applied to the Faraday problem, a point that we will return to in the discussion.
For the appearance of superlattice patterns the argument goes that, given three critical modes
 $\boldsymbol{k}_{i}$
as shown in figure 4(b) or (c) with amplitudes
 $A_{i}$
, then using a multiple time scale expansion near onset would lead to equations for the evolution of the amplitudes on a slow time scale of the form
 $$\begin{eqnarray}\displaystyle \left.\begin{array}{@{}rcl@{}}{\dot{A}}_{1} & = & {\it\lambda}_{1}A_{1}+{\it\alpha}_{1}\overline{A_{2}}A_{3}+A_{1}(a|A_{1}|^{2}+b_{0}|A_{2}|^{2}+c|A_{3}|^{2})+\cdots \\ {\dot{A}}_{2} & = & {\it\lambda}_{1}A_{2}+{\it\alpha}_{1}\overline{A_{1}}A_{3}+A_{2}(b_{0}|A_{1}|^{2}+a|A_{2}|^{2}+c|A_{3}|^{2})+\cdots \\ {\dot{A}}_{3} & = & {\it\lambda}_{2}A_{3}+{\it\alpha}_{2}A_{1}A_{2}+A_{3}(d|A_{1}|^{2}+d|A_{2}|^{2}+e|A_{3}|^{2})+\cdots \,,\end{array}\right\} & & \displaystyle\end{eqnarray}$$
where
 ${\it\lambda}_{1}$
and
 ${\it\lambda}_{2}$
are the linear growth rates of the respective modes, and
 ${\it\alpha}_{1},{\it\alpha}_{2},a,b_{0}$
,
 $c,d$
and
 $e$
are all real-valued constants. The quadratic coefficients,
 ${\it\alpha}_{1}$
and
 ${\it\alpha}_{2}$
are non-zero only if the temporal resonance condition is met. Note that there is no assumption of weak forcing/damping and so terms such as
 $\overline{A_{1}}$
do not appear (Alnahdi, Niesen & Rucklidge Reference Alnahdi, Niesen and Rucklidge2014).
Now, the mode with wavevector
 $\boldsymbol{k}_{\mathbf{3}}$
is not at its critical point but is weakly damped, so
 ${\it\lambda}_{2}<0$
and, close to onset (i.e.
 $|{\it\lambda}_{1}|$
small enough), it is therefore slaved by the critical modes. Consequently, one can perform a centre manifold reduction on (4.3), resulting in
 $$\begin{eqnarray}A_{3}=-\frac{{\it\alpha}_{2}}{{\it\lambda}_{2}}A_{1}A_{2}+\cdots \,,\end{eqnarray}$$
and
 $$\begin{eqnarray}\displaystyle & {\dot{A}}_{1}={\it\lambda}_{1}A_{1}+A_{1}(a|A_{1}|^{2}+b({\it\theta}_{res})|A_{2}|^{2})+\cdots & \displaystyle\end{eqnarray}$$
 $$\begin{eqnarray}\displaystyle & {\dot{A}}_{2}={\it\lambda}_{1}A_{2}+A_{2}(b({\it\theta}_{res})|A_{1}|^{2}+a|A_{2}|^{2})+\cdots , & \displaystyle\end{eqnarray}$$
 $$\begin{eqnarray}b({\it\theta}_{res})=b_{0}+b_{res},\quad b_{res}=-\frac{{\it\alpha}_{1}{\it\alpha}_{2}}{{\it\lambda}_{2}}.\end{eqnarray}$$
The presence of the weakly damped mode therefore changes the value of the cross-coupling coefficient
 $b({\it\theta}_{res})$
between modes with wavevectors
 $\boldsymbol{k}_{\mathbf{1}}$
and
 $\boldsymbol{k}_{\mathbf{2}}$
, offset at an angle
 ${\it\theta}_{res}$
. The value of
 ${\it\theta}_{res}$
is determined by the ratio of critical and weakly damped wavenumbers, but the same idea holds for any three-wave interaction between any
 $\boldsymbol{k}_{\mathbf{1}}$
and
 $\boldsymbol{k}_{\mathbf{2}}$
on the critical circle. This results in a function
 $b({\it\theta})$
with either a distinctive peak or dip at
 ${\it\theta}={\it\theta}_{res}$
, depending on the sign of
 ${\it\alpha}_{1}{\it\alpha}_{2}$
and on the weakness of the damping for the weakly damped mode.
Analysing the amplitude equations (4.6) shows that there are two types of solutions that bifurcate from the trivial solution
 $A_{1}=A_{2}=0$
, namely stripes (
 $A_{1}\neq 0,A_{2}=0$
or vice versa) and rectangles (
 $A_{1}=A_{2}$
). The relative stability of rectangles to stripe perturbations is dependent on the relative size of the self-coupling coefficient
 $a$
in (4.6) and
 $b({\it\theta}_{res})$
where, if
 $b_{res}>0$
(
 ${\it\alpha}_{1}{\it\alpha}_{2}>0$
), then the stability of rectangles is enhanced by the three-wave interaction, and if
 $b_{res}<0$
(
 ${\it\alpha}_{1}{\it\alpha}_{2}<0$
), then the stability of rectangles is suppressed.
Of course, in the Faraday problem there are not just two modes and there are many interactions and several weakly damped circles, but this idea that three-wave resonances can promote patterns associated with the angle
 ${\it\theta}_{res}$
is powerful (Silber et al.
Reference Silber, Topaz and Skeldon2000). The idea is that the dispersion relation determines which wavenumbers are critical or close to critical; allowed three-wave resonant interactions then select out particular wavevectors; the allowed wavevectors are necessarily oriented at particular angles as determined by the ratios of available wavenumbers, leading to specific values for
 ${\it\theta}_{res}$
. Superlattice patterns essentially consist of a nonlinear superposition of two sets of hexagons offset at an angle to each other. There is a whole family of different superlattice patterns (Dionne, Silber & Skeldon Reference Dionne, Silber and Skeldon1997), each corresponding to a different angle, but the particular superlattice that will be promoted will be that with an angle given by
 ${\it\theta}_{res}$
.
The superlattice patterns observed by Kudrolli et al. (Reference Kudrolli, Pier and Gollub1998) for
 $\{6,7\}$
excitation exemplify the idea and motivated the early theoretical work. The superlattice patterns that they observe are spatially periodic, and a spatial Fourier transform of the pattern indicates that they consist of essentially two sets of hexagonal modes offset by an angle of
 $22^{\circ }$
. In this case, the particular three-wave resonance of relevance is of the type illustrated in figure 4(b) and is between a harmonic mode that is weakly damped of frequency
 $2\tilde{{\it\omega}}/2$
, related to the
 $2\tilde{{\it\omega}}/2$
tongue, and two wavevectors with wavenumbers corresponding to the
 $6\tilde{{\it\omega}}/2$
tongue (Silber et al.
Reference Silber, Topaz and Skeldon2000). This was surprising because the superlattice state appears near the bicritical point where both
 $6\tilde{{\it\omega}}/2$
and
 $7\tilde{{\it\omega}}/2$
onset simultaneously, and naively, from inspection of the linear stability diagram (see figure 2
b), one would assume that it was a result of the interaction of
 $6\tilde{{\it\omega}}/2$
and
 $7\tilde{{\it\omega}}/2$
modes – the
 $2\tilde{{\it\omega}}/2$
tongue onsets at an amplitude of approximately
 $50\tilde{g}$
, so is not even visible on the scale shown.
This argument not only explains the presence of the
 $22^{\circ }$
superlattice patterns but also why patterns with angles close to
 $30^{\circ }$
are seen in
 $j=\{4,5\}$
forcing (Skeldon & Guidoboni Reference Skeldon and Guidoboni2007). Extensions of this basic idea have been used to suggest ways to design forcing frequencies to promote particular patterns in both Faraday waves (Porter, Topaz & Silber Reference Porter, Topaz and Silber2004) and in a model partial differential equation (Rucklidge & Silber Reference Rucklidge and Silber2009).
The results of Kudrolli et al. (Reference Kudrolli, Pier and Gollub1998) and the theoretical results of Silber et al. (Reference Silber, Topaz and Skeldon2000) showed how modes visible in the spatial Fourier transform of the experimentally observed pattern can be linked to critical/weakly damped modes and three-wave resonant interactions. It follows that given an experimentally observed pattern it should be possible to confirm whether or not it is a result of a particular interaction by establishing which modes are present in the pattern. However, identifying precisely which modes are involved can be tricky, as we illustrate in the following section.
Linear stability curves and Floquet multipliers calculated from the finite depth Navier–Stokes equations (a,c)
 $\tilde{h}=0.3~\text{cm}$
(b,d)
 $\tilde{h}=0.2~\text{cm}$
. Parameter values are taken from Epstein & Fineberg (Reference Epstein and Fineberg2006) and are
 $\tilde{{\it\sigma}}=20.6~\text{dyn}~\text{cm}^{-1}$
;
 $\tilde{{\it\nu}}=0.18~\text{cm}^{2}~\text{s}^{-1}$
;
 $\tilde{{\it\varrho}}=0.949~\text{g}~\text{cm}^{-3}$
;
 $\tilde{a}_{j},j=\{6,7,2\}$
, where
 $\tilde{a}_{6}=3.4,\tilde{a}_{7}=6.4,\tilde{a}_{2}=0.5$
;
 ${\it\phi}_{j}=0^{\circ }$
;
 $\tilde{{\it\omega}}/2{\rm\pi}=14~\text{Hz}$
.

4.2. Practical identification of relevant modes
In Epstein & Fineberg (Reference Epstein and Fineberg2006) a detailed comparison of different patterns, referred to as ‘grid’ states and labelled as
 $3:2$
,
 $4:3$
and
 $5:3$
respectively, is presented. The spatial Fourier transform of the patterns enables the identification of the wavenumbers that are present in these patterns: in each case they appear to be dominated by modes sitting on two different circles, one on the primary harmonic instability with wavenumber
 $\tilde{k}_{c}$
and a second circle with respective wavenumbers
 $\tilde{k}_{3:2}=0.38\tilde{k}_{c},\tilde{k}_{4:3}=0.55\tilde{k}_{c}$
and
 $\tilde{k}_{5:3}=0.23\tilde{k}_{c}$
. These ratios are fixed by the fact that the observed grid states consist of modes that fit on to a hexagonal lattice. This suggests that they are strong candidates for superlattice patterns that occur as a result of the mechanism discussed in § 4.1. Epstein & Fineberg (Reference Epstein and Fineberg2006) computed the linear stability curves, and their linear stability diagrams are recomputed in figure 5(a,b). We note that the linear stability curves are similar, but not identical, to those given in Epstein & Fineberg (Reference Epstein and Fineberg2006), particularly at small
 $\tilde{k}$
. This is because we have made a different choice in the sign of the forcing term to that made by Epstein & Fineberg (Reference Epstein and Fineberg2006). This is explained further in § 6. As stated by Epstein & Fineberg (Reference Epstein and Fineberg2006), and as can be seen in this figure, the
 $\tilde{k}_{3:2}$
wavenumber lines up with the first harmonic tongue (
 $2\tilde{{\it\omega}}/2$
), strongly suggesting that it is the same mechanism that produces the familiar
 $22^{\circ }$
superlattice patterns, seen by Kudrolli et al. (Reference Kudrolli, Pier and Gollub1998), that produces the
 $\tilde{k}_{3:2}$
grid state. For the two other states the situation is less clear. Epstein & Fineberg (Reference Epstein and Fineberg2006) state that
 $\tilde{k}_{4:3}$
lines up with the second harmonic tongue (
 $4\tilde{{\it\omega}}/2$
), but this is not clear from figure 5 (the position of the line drawn in figure 5 of Epstein & Fineberg (Reference Epstein and Fineberg2006) is not consistent with the value of
 $0.55\tilde{k}_{c}$
given). Epstein & Fineberg (Reference Epstein and Fineberg2006) observe that the
 $\tilde{k}_{5:3}$
mode does not appear to be aligned with any tongue and that the
 $5:3$
pattern occurs in a wedge-shaped region of parameter space that emerges from the bicritical point, unlike the
 $3:2$
and the
 $4:3$
state that occur at a short distance from this point.
The difficulty here is that the linear stability diagram indicates that at an amplitude of excitation of approximately
 $7.5\tilde{g}$
the mode with wavenumber
 $\tilde{k}_{c}$
and frequency
 $6\tilde{{\it\omega}}/2$
becomes unstable, and that there are five other damped modes with smaller wavenumber. But the position of the tongues for these modes only gives a rough idea of the precise wavenumber and damping associated with each mode at the pattern onset amplitude of
 $7.5\tilde{g}$
.
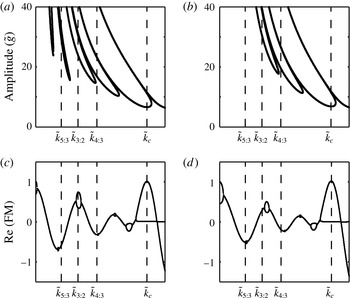
More accurate information on the damped modes can be obtained by calculating the most critical Floquet multipliers, as detailed in appendix A. The results for the parameter values used by Epstein & Fineberg (Reference Epstein and Fineberg2006) are shown in figure 5(c,d). We note that with either possible sign for the forcing, the Floquet multipliers look very similar. As identified by Epstein & Fineberg (Reference Epstein and Fineberg2006), the
 $\tilde{k}_{3:2}$
mode is aligned with the harmonic tongue associated with frequency
 $2\tilde{{\it\omega}}/2$
for
 $\tilde{h}=0.3~\text{cm}$
, but not for
 $\tilde{h}=0.2~\text{cm}$
, and supports their observation that the
 $k_{3:2}$
grid state will be seen for
 $\tilde{h}=0.3~\text{cm}$
and not for
 $\tilde{h}=0.2~\text{cm}$
. The remaining two wavenumbers
 $\tilde{k}_{5:3}$
and
 $\tilde{k}_{4:3}$
are very close to the subharmonic waves of frequencies
 $\tilde{{\it\omega}}/2$
and
 $3\tilde{{\it\omega}}/2$
, respectively. This clarifies the issue that the
 $\tilde{k}_{5:3}$
mode in Epstein & Fineberg (Reference Epstein and Fineberg2006) did not appear to align with any mode on the linear stability graphs, and strongly suggests that the
 $\tilde{k}_{4:3}$
mode was misidentified as harmonic. However, it also presents a problem in that temporal constraints mean that it is not possible for two harmonic wavevectors to form a three-wave resonance with a single subharmonic wavevector. Consequently,
 ${\it\alpha}_{1}={\it\alpha}_{2}=0$
in (4.3), so the discussion in § 4.1 does not hold as it stands and there is no special angle
 ${\it\theta}_{res}$
.
Epstein & Fineberg (Reference Epstein and Fineberg2006) point out that the
 $\tilde{k}_{5:3}$
case could be a result of a three-wave resonance between modes with frequencies
 $\tilde{{\it\omega}}/2,6\tilde{{\it\omega}}/2$
and
 $7\tilde{{\it\omega}}/2$
, and this is strongly supported by our Floquet multiplier calculation and is a permitted resonance in that it satisfies both spatial and temporal constraints. Such a resonance appears to be consistent with the spatial Fourier transform in figure 3(c) of Epstein & Fineberg (Reference Epstein and Fineberg2006) and is similar in structure to previous states identified in figure 20(c) of Arbell & Fineberg (Reference Arbell and Fineberg2002) as 2MS states. This would make it a three-wave resonance of the form shown in figure 4(d). This kind of resonance was discussed briefly by Porter & Silber (Reference Porter and Silber2002) and results in patterns that occur in a wedge that emerges from the bicritical point. This is consistent with the bifurcation sets shown by Epstein and Fineberg. The only remaining conundrum for this particular pattern is that Epstein and Fineberg state that, although all the evidence points to subharmonic modes being important, no subharmonic component was found.
5. Observed patterns near onset: theoretical bifurcation sets compared with experiment
In spite of the difficulties in identifying modes, nevertheless, in experiments with dominant forcing frequencies
 $j=\{4,5\}$
or
 $j=\{6,7\}$
there is a coherent picture: in the
 $\{6,7\}$
case, observed superlattice patterns near onset have an angle of
 $22^{\circ }$
; for
 $j=\{4,5\}$
, observed patterns near onset are quasipatterns with an angle of
 $30^{\circ }$
. Although there are technical difficulties with considering quasipatterns in the same way as superlattice patterns (Rucklidge & Rucklidge Reference Rucklidge and Rucklidge2003; Rucklidge & Silber Reference Rucklidge and Silber2009; Iooss & Rucklidge Reference Iooss and Rucklidge2010), nevertheless they appear to fit within the same framework with resonant interactions with weakly damped modes associated with
 $2\tilde{{\it\omega}}/2$
contributing to
 $b_{res}$
and explaining the appearance of the appropriate angle. The different angle seen in the
 $\{4,5\}$
case as compared with the
 $\{6,7\}$
case is because of differences in the wavenumbers of the interacting modes. In both cases, superlattice/quasipatterns are only seen near the bicritical point where the two modes driven by the two main components of the forcing onset simultaneously.
Here, we aim to carry out a careful comparison of the results of weakly nonlinear theory and experimental results to explore to what extent there is quantitative agreement between experiments and theory as the bicritical point is approached. We present results from the experiments of Ding & Umbanhowar (Reference Ding and Umbanhowar2006) because we have excellent agreement for the linear stability curves with
 $\tilde{{\it\nu}}=0.21~\text{cm}^{2}~\text{s}^{-1}$
, as shown in figure 3(e, f), and this set of experiments includes the most comprehensive study of how multiple frequencies interact via the superlattice mechanism outlined above. Specifically, acknowledging the importance of the
 $2\tilde{{\it\omega}}/2$
tongue, Ding & Umbanhowar (Reference Ding and Umbanhowar2006) carry out a series of experiments that systematically explore the effect of adding a third frequency that promotes this mode.
The weakly nonlinear theory is carried out using the method given in Skeldon & Guidoboni (Reference Skeldon and Guidoboni2007) for analysing (2.11)–(2.13). For all details of how weakly nonlinear analysis is used to derive coefficients for the relevant amplitude equations we refer the reader to Skeldon & Guidoboni (Reference Skeldon and Guidoboni2007). In order to examine the relative stability of superlattice patterns a minimal set of twelve amplitude equations corresponding to twelve vectors on the critical circle are needed. However, the stability of the planforms that bifurcate from the non-patterned state can be found by calculating the coefficients on three one-dimensional subspaces of this twelve-dimensional problem: one describing stripes, one for hexagons and one for rectangles generated from wavevectors separated by an angle
 ${\it\theta}$
, as detailed in Skeldon & Silber (Reference Skeldon and Silber1998). By varying
 ${\it\theta}$
, this formulation then results in determining the stability of stripes to any perturbation of the same wavenumber; the stability of hexagons to (i) stripes arbitrarily close to any given orientation, (ii) rectangles arbitrarily close to any given aspect ratio, (iii) to superlattice patterns of any angle; the stability of rectangles to (i) stripes of any orientation, (ii) superlattice patterns on the same lattice; the stability of superlattice patterns to hexagons, stripes or rectangles that are made up of a subset of the superlattice wavevectors.
Since the weakly nonlinear stability analysis indicates that for many parameter values there is more than one stable pattern, results are presented in two ways: firstly, showing the regions of stability for individual patterns – only those that have some region of stability are shown – and secondly, showing the bifurcation set for the most stable state, as computed from the weakly nonlinear coefficients using the Lyapunov functional given in Skeldon & Guidoboni (Reference Skeldon and Guidoboni2007). The most stable states are superimposed on the experimental results of Ding & Umbanhowar (Reference Ding and Umbanhowar2006). In the case of superlattice patterns, the resonant interactions mean that it is always the particular pattern associated with
 ${\it\theta}_{res}$
that has the largest region of stability, and it is perturbations associated with this angle that first destabilise hexagons. Consequently, where superlattice patterns are shown it is always the superlattice pattern associated with
 ${\it\theta}_{res}$
that is relevant.
Ding and Umbanhowar consider the two sets of frequency components most widely used by other experimental groups – namely
 $j=\{4,5\}$
and
 $j=\{6,7\}$
– and then systematically investigate the inclusion of a third mode, so considering the combinations
 $j=\{4,5,2\}$
and
 $j=\{6,7,2\}$
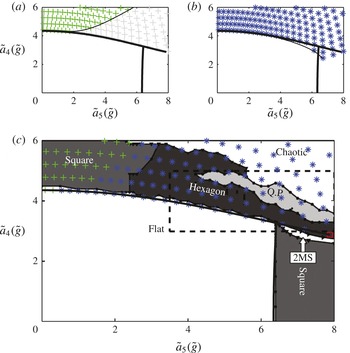
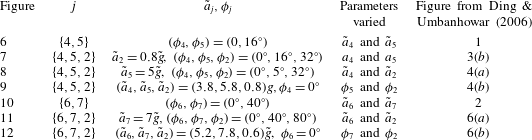
. We have carried out the weakly nonlinear stability analysis for each of their parameter studies, and the results are presented in figures 6–12, where the principal parameters considered and the corresponding figures in Ding & Umbanhowar (Reference Ding and Umbanhowar2006) are summarised in table 1.
Comparison with figure 1 from Ding & Umbanhowar (Reference Ding and Umbanhowar2006).
 $\tilde{a}_{j}=\{4,5\}$
,
 $({\it\phi}_{4},{\it\phi}_{5})=(0,16^{\circ }),\tilde{{\it\omega}}/2{\rm\pi}=20~\text{Hz}$
. The fluid parameters are as in the caption to figure 3(e, f) with
 $\tilde{{\it\nu}}=0.21~\text{cm}^{2}~\text{s}^{-1}$
. (a,b) Stability regions for different planforms. (a) Stable squares in green; unstable squares in grey; (b) stable hexagons in blue; unstable hexagons in grey. Note that for
 $\tilde{a}_{5}>0$
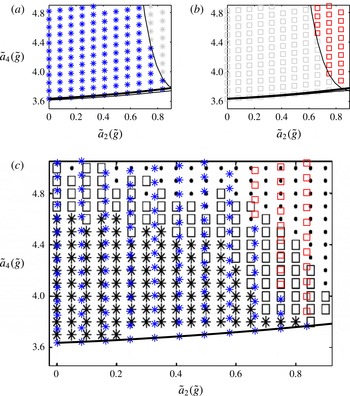
, there are quadratic terms in the amplitude equations which mean that hexagons bifurcate transcritically. The unstable solutions that are produced in this transcritical bifurcation are stabilised in a saddle–node bifurcation, resulting in a small region of stable, subcritical hexagons. This region of stable subcritical hexagons is only visible on the scale of the figure close to the bicritical point. (c) ‘Most stable’ state using a Lyapunov energy argument:
 $+$
squares; * hexagons; ▫ quasipatterns. The theoretical results are overlaid on figure 1 from Ding & Umbanhowar (Reference Ding and Umbanhowar2006). Adapted with permission from Ding & Umbanhowar (Reference Ding and Umbanhowar2006). Copyrighted by the American Physical Society.

Summary information for figures comparing weakly nonlinear analysis with the experiments of Ding & Umbanhowar (Reference Ding and Umbanhowar2006).

In each case the weakly nonlinear results are superimposed on the experimental results. The parameters have been chosen to match those quoted in the paper of Ding & Umbanhowar (Reference Ding and Umbanhowar2006), with the exception of the viscosity, where, as seen in figure 3, the linear stability curves fitted best with a viscosity of
 $\tilde{{\it\nu}}=0.21~\text{cm}^{2}~\text{s}^{-1}$
rather than
 $\tilde{{\it\nu}}=0.20~\text{cm}^{2}~\text{s}^{-1}$
quoted in their paper (or the value of
 $\tilde{{\it\nu}}=0.204~\text{cm}^{2}~\text{s}^{-1}$
quoted in Ding (Reference Ding2006)).
5.1. Results for {4, 5} and {4, 5, 2}
In figure 6 we see that the weakly nonlinear theory predicts bistability between squares and hexagons for low values of
 $\tilde{a}_{5}$
, with squares losing stability as the bicritical point is approached. There is good agreement between the point at which squares become unstable (approximately
 $\tilde{a}_{5}=2.2\tilde{g}$
, figure 6
a), and the transition between squares and hexagons in the experiment. However, before squares become unstable, the theory suggests that there is a region of bistability between hexagons and squares, and that in this region hexagons and not squares, as seen in the experiment, are the most stable state. Of course, in this region, the particular pattern observed experimentally will depend to some extent on the way in which the experiments were carried out. For example, if the experimental procedure was to fix
 $\tilde{a}_{4}$
and to increase
 $\tilde{a}_{5}$
from zero in small steps, one would expect to see squares until the limit of their stability. Regions of quasipatterns are also predicted by the weakly nonlinear theory (almost off the scale of the figure 6) and observed in the experiment, but since they do not occur close to onset it is perhaps not surprising that the theory and experiment do not agree.
In figure 7, we see that by adding in a forcing component that excites the
 $2\tilde{{\it\omega}}/2$
mode directly Ding & Umbanhowar (Reference Ding and Umbanhowar2006) showed that they could increase the region of quasipatterns, to the extent that they become the first pattern observed after the unpatterned state becomes unstable. Our theoretical results for the same parameter values also show an enhanced region for the superlattice patterns – but not as enhanced as for the experiment. Two possible reasons for this are (i) the nearby presence of the bicritical point where both the
 $2\tilde{{\it\omega}}/2$
and the
 $4\tilde{{\it\omega}}/2$
tongue onset simultaneously, which means that our weakly nonlinear calculations would need to be extended; (ii) the sensitivity of the results to phase. We discuss both of these in more detail below.
Comparison with Ding & Umbanhowar (Reference Ding and Umbanhowar2006) figure 3(b),
 $j=\{4,5,2\}$
,
 $({\it\phi}_{4},{\it\phi}_{5},{\it\phi}_{2})=(0,16^{\circ },32^{\circ })$
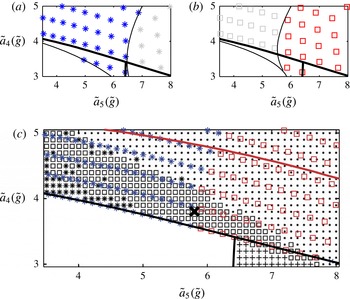
. (a,b) Stability regions for different planforms. (a) Stable hexagons in blue, unstable hexagons in grey; (b) stable quasipatterns in red, unstable quasipatterns in grey. Both quasipatterns and hexagons bifurcate transcritically and may be stabilised in a saddle–node bifurcation. This can result in stable subcritical quasipatterns/hexagons. (c) ‘Most stable’ planform using a Lyapunov energy argument superimposed on figure 3(b) from Ding & Umbanhowar (Reference Ding and Umbanhowar2006). Adapted with permission from Ding & Umbanhowar (Reference Ding and Umbanhowar2006). Copyrighted by the American Physical Society. * hexagons;
 $\Box$
quasipatterns, ● disordered states, where the coloured symbols are the theoretical results and the black symbols the experimental results. The red line is the linear instability curve for the harmonic
 $2\tilde{{\it\omega}}/2$
tongue. The black cross indicates the point at which the experiment shown in figure 9(c) was carried out.

Figure 8 shows excellent agreement between the theoretical results and the experimental results for the pattern at onset for increasing
 $\tilde{a}_{2}$
, with agreement diminishing with distance from onset.
Comparison with Ding & Umbanhowar (Reference Ding and Umbanhowar2006) figure 4(a).
 $j=\{4,5,2\}$
,
 $\tilde{a}_{5}=5\tilde{g},({\it\phi}_{4},{\it\phi}_{5},{\it\phi}_{2})=(0,16^{\circ },32^{\circ })$
. (a) and (b) Stability regions for hexagons and quasipatterns, respectively. Coloured symbols stable; grey unstable. Hexagons and quasipatterns both bifurcate from the unpatterned state at a transcritical bifurcation, where the unstable bifurcating branch changes direction at a saddle–node bifurcation. This leads to regions of stable hexagons and quasipatterns that are subcritical. (c) ‘Most stable’ planform: * hexagons; ▫ quasipatterns, overlaid on figure 4(a) from Ding & Umbanhowar (Reference Ding and Umbanhowar2006). Adapted with permission from Ding & Umbanhowar (Reference Ding and Umbanhowar2006). Copyrighted by the American Physical Society. The coloured symbols are the theoretical results and the black symbols the experimental results. The black dots indicate disordered states. Note that the linear stability boundary for the
 $2\tilde{{\it\omega}}/2$
mode is just off this diagram, and is approximately parallel to the
 $a_{4}$
axis through a value of
 $a_{2}\approx 1$
. The bicritical point where the
 $2\tilde{{\it\omega}}/2$
and the
 $4\tilde{{\it\omega}}/2$
modes onset simultaneously occurs when
 $(\tilde{a}_{2},\tilde{a}_{4})=(1.05,3.80)\tilde{g}$
.

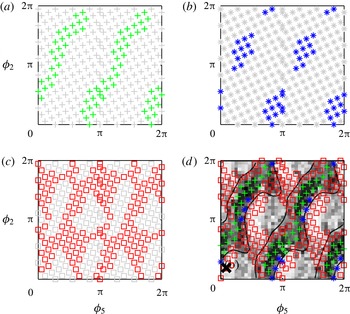
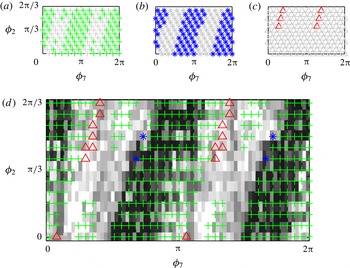
There is surprisingly good agreement for the variation with phase shown in figure 9. In the experimental results, black indicates low correlation at an angle of
 $30^{\circ }$
. This lines up well with areas where the theory indicates competition between squares and hexagons. White areas, where there is high correlation at
 $30^{\circ }$
, line up well with stable quasipatterns. In the regions where there are no coloured symbols, the weakly nonlinear analysis indicates no stable states. This region is mostly mid-grey in the experiment, indicating some correlation at
 $30^{\circ }$
.
Comparison with Ding & Umbanhowar (Reference Ding and Umbanhowar2006) figure 4(b). Phase diagram for
 $j=\{4,5,2\}$
with
 $(\tilde{a}_{4},\tilde{a}_{5},\tilde{a}_{2})=(3.8,5.8,0.8)\tilde{g}$
. (The position of this point for
 $({\it\phi}_{5},{\it\phi}_{2})=(16^{\circ },32^{\circ })$
is shown in figure 7
c.) (a–c) Stability regions for squares, hexagons and quasipatterns, respectively. Coloured symbols stable; grey unstable. (d) ‘Most stable’ planforms:
 $+$
squares; * hexagons; ▫ quasipatterns. The results are overlaid on figure 4(b) of Ding & Umbanhowar (Reference Ding and Umbanhowar2006). Adapted with permission from Ding & Umbanhowar (Reference Ding and Umbanhowar2006). Copyrighted by the American Physical Society. The cross indicates the point which corresponds to the cross in figure 7.

The agreement in figure 9 is surprising because the results correspond to a point with
 $\tilde{a}_{4}=3.8\tilde{g},\tilde{a}_{5}=5.9\tilde{g}$
and
 $\tilde{a}_{2}=0.8\tilde{g}$
, which according to the theory is close to a transition from quasipatterns to hexagons in a region where both hexagons and quasipatterns are stable, whereas in the experiment it is firmly in the quasipattern region. (In order to help cross-reference between the two figures, a black cross has been marked on both figure 7
c and figure 9.) Figure 9 highlights the sensitivity of the results to phase and, in fact, with our weakly nonlinear analysis we find that the size of the region of quasipatterns changes significantly depending on the phase. This sensitivity to the precise value of the phase could be part of the difficulty in obtaining agreement for the onset of quasipatterns in figure 7.
The results are, of course, also sensitive to the viscosity. Away from the bicritical point, changing the viscosity tends to translate the nonlinear bifurcation lines as one might expect: upwards if the viscosity is increased, downwards if the viscosity is decreased, in line with the changes to the transition from unpatterned to patterned state seen in figure 3. Close to the bicritical point the effects are more pronounced, with small changes in viscosity sometimes leading to large changes in the regions in which particular patterns dominate.
5.2. Results for {6, 7} and {6, 7, 2}
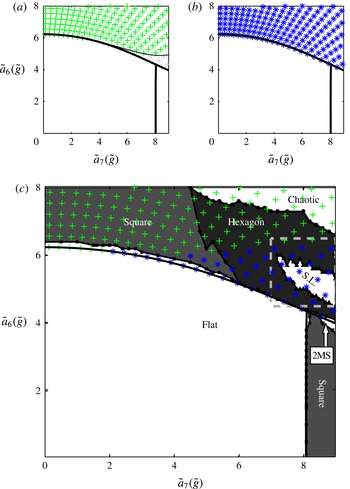
In figure 10 the weakly nonlinear theory predicts bistability between squares and hexagons for low values of
 $\tilde{a}_{7}$
, with squares losing stability as the bicritical point is approached. As for figure 6, although there is good agreement between the point at which squares become unstable (approximately
 $\tilde{a}_{7}=4.5\tilde{g}$
), and the transition between squares and hexagons in the experiment, this agrees less well with the results of the energy argument.
Comparison with Ding & Umbanhowar (Reference Ding and Umbanhowar2006), figure 2.
 $j=\{6,7\},({\it\phi}_{6},{\it\phi}_{7})=(0,40^{\circ }),\tilde{{\it\omega}}/2{\rm\pi}=16.5~\text{Hz}$
. (a,b) Stability regions for rectangles and hexagons. Coloured symbols stable; grey unstable. (c) ‘Most stable’ planform:
 $+$
rectangles; * hexagons, overlaid on figure 2 of Ding & Umbanhowar (Reference Ding and Umbanhowar2006). Adapted with permission from Ding & Umbanhowar (Reference Ding and Umbanhowar2006). Copyrighted by the American Physical Society.

In figure 11 both theory and experiment agree that for low and moderate values of
 $\tilde{a}_{2}$
hexagons are the preferred pattern. As
 $\tilde{a}_{2}$
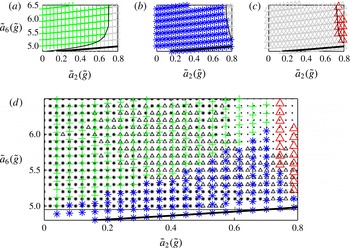
increases, hexagons are replaced by superlattice patterns, although the transition observed experimentally occurs slightly earlier than in the weakly nonlinear calculations. Away from onset, the agreement is qualitative rather than quantitative: in the experiments superlattice patterns are observed for a much larger region than predicted by the weakly nonlinear theory and hexagons are observed in regions where the theory predicts bistability of rectangles and hexagons, with rectangles being the most stable state. For large values of
 $\tilde{a}_{2}$
and
 $\tilde{a}_{6}$
, the experiments see disordered states. The weakly nonlinear theory cannot predict such states, but note that none of the planforms considered are found to be stable for large
 $\tilde{a}_{2}$
and
 $\tilde{a}_{6}$
(there are no symbols from the theoretical calculations in the top right of figure 11).
Comparison with Ding & Umbanhowar (Reference Ding and Umbanhowar2006), figure 6(a).
 $j=\{6,7,2\},\tilde{a}_{7}=7\tilde{g},({\it\phi}_{6},{\it\phi}_{7},{\it\phi}_{2})=(0,40^{\circ },80^{\circ }),\tilde{{\it\omega}}/2{\rm\pi}=16.5~\text{Hz}$
. (a–c) Stability regions for rectangles, hexagons and superlattice patterns, respectively. Coloured symbols stable; grey unstable. (d) ‘Most stable’ planforms superimposed on figure 6(a) from Ding & Umbanhowar (Reference Ding and Umbanhowar2006). Adapted with permission from Ding & Umbanhowar (Reference Ding and Umbanhowar2006). Copyrighted by the American Physical Society. The same symbol styles are used for both experiments and theory (▵ superlattice; * hexagons;
 $+$
rectangles; ● disordered states). Coloured symbols represent theoretical results and black symbols are the experimental results.

The results shown in figure 12 again show that the theoretical results have the same diagonal dependency as seen in the experiments, a consequence of a phase invariant, as discussed further below. For the experimental results, white indicates a high correlation with the angle of
 $22^{\circ }$
and this does seem to align with where superlattice patterns occur, although for much of the lighter regions the weakly nonlinear analysis predicts no stable pattern. The black regions correspond to a low correlation at
 $22^{\circ }$
and Ding & Umbanhowar (Reference Ding and Umbanhowar2006) state that this region contains ‘disordered’ patterns: our theoretical results suggest that both rectangles and hexagons are stable for much of this region, each having a similar Lyapunov energy. Consequently, one might expect competition between these two states, resulting in the observed disorder.
Comparison with Ding & Umbanhowar (Reference Ding and Umbanhowar2006), figure 6(b). Phase diagram for
 $j=\{6,7,2\},(\tilde{a}_{6},\tilde{a}_{7},\tilde{a}_{2})=(5.2,7.8,0.6)\tilde{g},\tilde{{\it\omega}}/2{\rm\pi}=16.5~\text{Hz}$
. (a–c) Stability regions for rectangles, hexagons and superlattice patterns, respectively. Coloured symbols stable; grey unstable. (d) ‘Most stable’ planform, superimposed on figure 6(b), Ding & Umbanhowar (Reference Ding and Umbanhowar2006). ▵ Superlattice; * hexagons;
 $+$
rectangles. Coloured symbols represent theoretical results and black symbols are the experimental results. Note that in (d) hexagons are rarely the ‘most stable’ planform: whenever hexagons are stable, rectangles usually are too. Although the Lyapunov energy for hexagons is often similar to that for rectangles, rectangles nearly always have the lowest value.

5.3. Common themes
From our comparison, a number of themes emerge:
-
(a) There is excellent agreement with theory at onset in some cases (figure 8).
-
(b) In other cases, figures 6 and 10, bistability of patterns makes it difficult to compare theory and experiment. The experimental results for the pattern at onset are consistent with the theory, but sometimes the pattern at onset is not that predicted by considering the Lyapunov argument. This is one difficulty in comparing with experiment post festum, since in regions of bistability, which pattern is observed can depend on the way that the experiments are performed.
-
(c) When the additional forcing component (
 $\tilde{a}_{2}\neq 0$
) is included that promotes the mode with frequency
$2\tilde{{\it\omega}}/2$
, then in both theory and experiments patterns associated with the resonant angle are promoted and consequently appear for a larger region of parameter space.
-
(d) In the experimental results, the additional forcing causes regions where both hexagonal states and superlattice patterns occur close to onset. This is also true in the weakly nonlinear analysis, but to a lesser extent, see figures 7 and 11. There are two possible causes here: firstly, the theoretical results are sensitive to the phase, so changing the phase can expand the region of stable superlattice patterns. Secondly, the presence of the weakly damped
$2\tilde{{\it\omega}}/2$
mode means that the results are in a region that is close to a bicritical point where both
$2\tilde{{\it\omega}}/2$
and
$4\tilde{{\it\omega}}/2$
modes onset simultaneously. In the neighbourhood of this bicritical point, one would expect the regions of stability as predicted from a codimension one analysis, at best, be perturbed, and, at worst, be inaccurate. We will return to this point in the discussion and note for now the red line in figure 7 that marks the onset of this mode. -
(e) Quantitative agreement in most cases only occurs close to onset.


In addition, in all cases, close to the subharmonic instability boundary the theory predicts squares (not shown in the figures), as seen in the experiments.
6. Discussion
The Faraday problem is an important pattern-forming system, yet it is particularly challenging to tie theory to experiment. The experiments are difficult to perform; the parameter regime of interest (large box, moderate viscosity) along with the technical difficulties of solving the free-boundary Navier–Stokes equations make numerical solution of the problem hard, to the extent that although there has been some progress (see Périnet, Juric & Tuckerman Reference Périnet, Juric and Tuckerman2009, Reference Périnet, Juric and Tuckerman2012) it is only very recently that any fully three-dimensional calculations of superlattice patterns in the Faraday problem have been reported (Kahouadji et al. Reference Kahouadji, Périnet, Tuckerman, Shin, Chergui and Juric2015). The fact that the instabilities result in an entire circle of unstable wavenumbers presents considerable theoretical difficulties (see Melbourne Reference Melbourne1999) and has meant that theory is, by necessity, restricted to a finite number of modes – the finite number normally chosen as the minimal set which will allow for the existence of the experimental pattern of most interest. Furthermore, by its nature, weakly nonlinear theory cannot be expected to capture behaviour that is inherently strongly nonlinear: so a weakly nonlinear analysis of the transition from non-patterned to patterned state can only be expected to agree with experiment close to onset.
Nevertheless, our detailed comparison with Ding & Umbanhowar (Reference Ding and Umbanhowar2006) shows very good agreement between experiment and weakly nonlinear results at onset, with the caveat that the theory often predicts bistability of patterns. Where there is bistability, the observed pattern will be dependent on the path taken through parameter space and might consist of competition between the different possible stable states. Consequently, in some cases it is only possible to say that the weakly nonlinear theory is consistent with experiments.
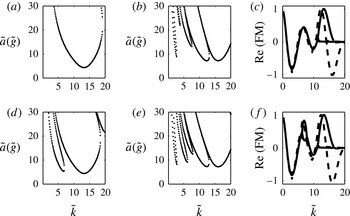
Linear stability curves and Floquet multipliers for
 $j=\{4,5\}$
and
 $j=\{4,5,2\}$
excitation using parameter values as in Ding & Umbanhowar (Reference Ding and Umbanhowar2006). (a,b) Linear stability curves for
 $\tilde{f}(\tilde{t})=\tilde{a}(\cos {\it\chi}\cos 4\tilde{{\it\omega}}\tilde{t}+\sin {\it\chi}\cos 5\tilde{{\it\omega}}\tilde{t})$
, where (a) has
 ${\it\chi}=0$
and (b) has
 ${\it\chi}=63^{\circ }$
. (c) The corresponding Floquet multipliers, where the solid line is for
 ${\it\chi}=0$
and the dashed line is for
 ${\it\chi}=63^{\circ }$
. The Floquet multipliers are calculated for
 $\tilde{a}$
fixed at the value for the minimum of the
 $4{\it\omega}/2$
tongue. So, for
 ${\it\chi}=0,\tilde{a}=4.35\tilde{g}$
, for
 ${\it\chi}=63^{\circ },\tilde{a}=7.19\tilde{g}$
. (d,e) Linear stability curves for
 $\tilde{f}(\tilde{t})=\tilde{a}(\cos {\it\chi}\cos 4\tilde{{\it\omega}}\tilde{t}+\sin {\it\chi}\cos 5\tilde{{\it\omega}}\tilde{t}+\hat{a}_{2}\cos 2\tilde{{\it\omega}}\tilde{t})$
where (d) has
 ${\it\chi}=0$
,
 $\tilde{a}_{2}=\tilde{a}\hat{a}_{2}=0.8g$
and (e) has
 ${\it\chi}=62^{\circ },\tilde{a}_{2}=\tilde{a}\hat{a}_{2}=0.8\tilde{g}$
. (f) The corresponding Floquet multipliers where the solid line is for case (d), where
 $\tilde{a}_{5}=0$
, and the dashed line is for (e), where
 $\tilde{a}_{5}\neq 0$
. The Floquet multipliers are calculated for
 $\tilde{a}$
fixed at the value for the minimum of the
 $4\tilde{{\it\omega}}/2$
tongue. So, for
 ${\it\chi}=0,\tilde{a}=4.40\tilde{g}$
, for
 ${\it\chi}=63^{\circ },\tilde{a}=7.27\tilde{g}$
.

The results suggest that the qualitative idea that the three-wave resonances determine the angles that appear in the patterns does indeed explain many of the patterns observed close to onset.
The results also highlight the particular aspects of the Faraday problem that lead to an amplification of
 $b_{res}$
. Equation (4.7),
 $$\begin{eqnarray}b({\it\theta}_{res})=b_{0}+b_{res},\quad b_{res}=-\frac{{\it\alpha}_{1}{\it\alpha}_{2}}{{\it\lambda}_{2}},\end{eqnarray}$$
suggests that there are two main contributions, one from the quadratic coupling coefficients (
 ${\it\alpha}_{1}$
and
 ${\it\alpha}_{2}$
) and one from the linear damping of the weakly damped mode (
 ${\it\lambda}_{2}$
). Promotion of patterns with angle
 ${\it\theta}_{res}$
requires the quadratic coefficients to be sufficiently large and/or the damping to be sufficiently small. As illustrated in figure 13(a,b) for
 $j=\{4,5\}$
and in (d,e) for
 $j=\{4,5,2\}$
, although increasing
 $a_{5}$
and heading towards the bicritical point would appear to change the value of the linear damping for the
 $2\tilde{{\it\omega}}/2$
tongue, this is in fact not the dominant effect. This can be seen in figure 13(c) and also in (f), where the Floquet multipliers are plotted for both
 $\tilde{a}_{5}=0$
and a value of
 $\tilde{a}_{5}$
near the bicritical point. It can be seen that increasing the amplitude of the
 $j=5$
mode in the forcing promotes the
 $5\tilde{{\it\omega}}/2$
tongue, as expected, but has little impact on the damping of the other modes. In contrast, now comparing figure 13(c) with (f), we see that the addition of the
 $j=2$
mode does have the effect of reducing the damping of the mode associated with the
 $2\tilde{{\it\omega}}/2$
tongue, as seen by an increase in the Floquet multiplier from approximately 0.5 for
 $\tilde{a}_{2}=0$
to 0.9 for
 $\tilde{a}_{2}=0.8\tilde{g}$
.
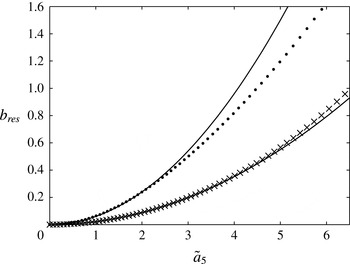
The value of
 $b_{res}$
for
 $j=\{4,5\}$
(crosses) and for
 $j=\{4,5,2\}$
(dots) for increasing
 $\tilde{a}_{5}$
. The solid lines are proportional to
 ${\tilde{a}_{5}}^{2}$
. Parameter values as in Ding & Umbanhowar (Reference Ding and Umbanhowar2006) but with
 $\tilde{{\it\nu}}=0.21~\text{cm}^{2}~\text{s}^{-1}$
.

Rather than changing the damping of the weakly damped mode, increasing the amplitude of the
 $j=5$
mode, so heading towards the bicritical point, has the effect of increasing the quadratic coefficients
 ${\it\alpha}_{1}$
and
 ${\it\alpha}_{2}$
: in the limit when
 $\tilde{a}_{5}=0$
the quadratic coefficients are zero. This is because the temporal resonance condition discussed in § 4.1 is not met when
 $\tilde{a}_{5}=0$
, so there can be no coupling between the
 $2\tilde{{\it\omega}}/2$
mode and the
 $4\tilde{{\it\omega}}/2$
mode.
Topaz et al. (Reference Topaz, Porter and Silber2004) consider a weak viscosity limit and show that in the case of
 $j=\{m,n\}$
forcing the temporal resonance condition results in possible three-wave interactions with an
 $(n-m)$
mode, where one expects
 $$\begin{eqnarray}b_{res}=\frac{{\it\alpha}|a_{n}|^{2}}{|{\it\lambda}_{2}|},\end{eqnarray}$$
where
 ${\it\lambda}_{2}$
is the linear damping of the weakly damped mode and
 ${\it\alpha}$
is a coefficient. Although this cannot necessarily be expected to apply to the moderate viscosity case of the experiments in Ding & Umbanhowar (Reference Ding and Umbanhowar2006), we see in figure 14 that the calculated values for
 $b_{res}$
for the
 $j=\{4,5\}$
case have a close to quadratic dependence on
 $a_{5}$
, as suggested by (6.2). For
 $j=\{m,n,p\}$
frequency forcing that has a three-wave resonance with an
 $(n-m)$
mode, as for the case
 $j=\{4,5,2\}$
, Topaz et al. (Reference Topaz, Porter and Silber2004) find that the dominant contribution to
 $b_{res}$
is given by
 $$\begin{eqnarray}b_{res}={\it\alpha}|a_{n}|^{2}P_{2}({\it\Phi}),\end{eqnarray}$$
where
 ${\it\Phi}={\it\phi}_{p}+2{\it\phi}_{m}-2{\it\phi}_{n}$
and
 $P_{2}$
is given by
 $$\begin{eqnarray}P_{2}=\frac{|{\it\lambda}_{2}|+{\it\mu}a_{2}\sin {\it\Phi}}{|{\it\lambda}_{2}|^{2}-{\it\mu}^{2}a_{2}^{2}},\end{eqnarray}$$
where
 ${\it\mu}$
is a coefficient. As
 $a_{2}\rightarrow 0$
, (6.3) reduces to (6.2). However, for
 $a_{2}$
non-zero, the effect of
 $P_{2}$
is to make the leading-order dependence of
 $b_{res}$
on
 $a_{2}$
not purely quadratic, so it is not surprising that, for this case, an assumption of quadratic dependence fits less well.
Note that the
 ${\it\Phi}$
dependence, which comes from a parameter symmetry, does explain the strong diagonal structure to the figures showing the pattern dependence as a function of two of the phases, see figures 9 and 12.
There is a further issue to consider. Increasing the amplitude of the
 $j=2$
mode brings the location of the bicritical point where both the
 $4\tilde{{\it\omega}}/2$
and the
 $2\tilde{{\it\omega}}/2$
mode onset simultaneously closer to the pattern onset point. This is seen in figure 7, which shows both the linear stability boundaries for both
 $4\tilde{{\it\omega}}/2$
and
 $2\tilde{{\it\omega}}/2$
modes. The proximity of the linear stability boundary means that, in order to quantitatively predict the regions of quasipatterns, it is likely that one would need to consider the tricritical problem where
 $4\tilde{{\it\omega}}/2,5\tilde{{\it\omega}}/2$
and
 $2\tilde{{\it\omega}}/2$
modes all occur simultaneously. The onset boundaries for the three modes for
 $j=\{4,5,2\}$
are shown in figure 15: the position of the tricritical point is at approximately
 $(\tilde{a}_{4},\tilde{a}_{5},\tilde{a}_{2})=(3.5,6.4,1.0)\tilde{g}$
. The situation for
 $j=\{6,7,2\}$
forcing is similar, and one explanation for discrepancies between the weakly nonlinear theory and experimental results may be that they are a consequence of the proximity of the codimension three point. This kind of discrepancy was previously demonstrated by Riyapan (Reference Riyapan2012) in a comparison of a codimension one and a codimension two analysis of superlattice patterns in a model PDE.
Surfaces for the onset of modes with frequencies
 $4\tilde{{\it\omega}}/2,5\tilde{{\it\omega}}/2$
and
 $2\tilde{{\it\omega}}/2$
. Parameter values as in Ding & Umbanhowar (Reference Ding and Umbanhowar2006) but with
 $\tilde{{\it\nu}}=0.21~\text{cm}^{2}~\text{s}^{-1}$
.

Another important feature of the analysis considered here is that the codimension one description of the problem results in amplitude equations that are variational. This variational structure is useful and enables us to construct a Lyapunov functional to predict the ‘most stable’ pattern. However, this variational framework also means that all predicted patterns repeat with either the period or half the period of the drive, but cannot exhibit more complicated time dependence. As discussed in Rucklidge et al. (Reference Rucklidge, Silber and Skeldon2012), in the vicinity of the bicritical point, and depending on the signs of the quadratic terms, an infinite sequence of resonances can take place, leading to spatiotemporal chaos. This may explain some of the disordered states seen close to onset in the experiments in Epstein & Fineberg (Reference Epstein and Fineberg2004) and Ding & Umbanhowar (Reference Ding and Umbanhowar2006). The difficulties of analysing and numerically solving the time-dependent Navier–Stokes equations leave a clear role for reduced models here. For example, the model of Zhang & Viñals (Reference Zhang and Viñals1997) is derived from the Navier–Stokes equations under the assumptions of infinite depth and weak viscosity, but, as was shown in Skeldon & Porter (Reference Skeldon and Porter2011), weakly nonlinear analysis of the Zhang–Viñals equations agrees surprisingly well with weakly nonlinear analysis of the full Navier–Stokes equations, even for the moderate viscosity values used in many Faraday experiments.
Finally, our results suggest that weakly nonlinear theory is a useful tool to understand the pattern transitions near onset, but there are some caveats. Ideally experiments and theory would be done hand-in-hand, otherwise it may be hard to get agreement even in the linear theory, as we saw in § 3; or establish which modes are present in patterns, as we saw in § 4; or establish if there is bistability, as we saw in § 5. There are even problems at the basic level of the definition of the forcing in (2.2). In single-frequency experiments, changing the sign of
 $f(t)$
is equivalent to a phase shift in time, so the sign of the forcing is not important. However, for multiple frequencies the analogous result is perhaps less transparent: changing the sign requires not just a translation in time but requires an altered definition for the phases. The particular sign convention used by any one experimental group will depend on how the accelerometer is wired up to the experiment. Specifically, it will depend on whether or not the accelerometer records its maximum value when the oscillator is at its highest point or at its lowest. This level of detail is not normally recorded – perhaps because an assumption is made that it does not matter. However, this can lead to some confusion: for example, the phase invariant
 ${\it\Phi}$
discussed in Porter et al. (Reference Porter, Topaz and Silber2004) is derived with one particular choice of sign for
 $f(t)$
, and thus one specific definition of the phases for the forcing components. Ding & Umbanhowar (Reference Ding and Umbanhowar2006) note that they find a difference between the position of the maximum value of the phase invariant and the theory of Porter et al. (Reference Porter, Topaz and Silber2004), and between their results and those of Epstein & Fineberg (Reference Epstein and Fineberg2006), but in both cases these differences can be explained by a different convention for the sign of the forcing
 $f(t)$
. Based on the observations in Ding & Umbanhowar (Reference Ding and Umbanhowar2006), we have used the same sign convention as Porter et al. (Reference Porter, Topaz and Silber2004) for our comparison with the work of Epstein & Fineberg (Reference Epstein and Fineberg2006) and the opposite sign convention for Ding & Umbanhowar (Reference Ding and Umbanhowar2006).
Acknowledgements
This paper builds on discussions about pattern formation in the Faraday problem with many individuals over the years. In particular the authors would like to acknowledge the input of M. Silber, J. Porter and J. Fineberg. We thank the referees for their thorough reading of the paper and their helpful comments.
Appendix A. Calculating Floquet multipliers
The Floquet multipliers can be calculated by considering the linear stability of the trivial solution (2.14) of (2.11) and associated boundary conditions to perturbations of the divergence-free form
 $$\begin{eqnarray}\boldsymbol{u}=\left(\frac{\text{i}}{k}\partial _{z}W(z,t),0,W(z,t)\right)\text{e}^{\text{i}kx}.\end{eqnarray}$$
This leads to a fourth-order equation for
 $W(z,t)$
for
 $-\tilde{h}/\tilde{l}<z<0$
 $$\begin{eqnarray}(\partial _{t}-C(-k^{2}+\partial _{zz}))(-k^{2}+\partial _{zz})W=0,\end{eqnarray}$$
with boundary conditions at
 $z=-\tilde{h}/\tilde{l}$
,
 $$\begin{eqnarray}W(-\tilde{h}/\tilde{l},t)=\partial _{z}W|_{-\tilde{h}/\tilde{l}}=0\end{eqnarray}$$
and at
 $z=0$
,
 $$\begin{eqnarray}\displaystyle & \partial _{t}Z=W, & \displaystyle\end{eqnarray}$$
 $$\begin{eqnarray}\displaystyle & (k^{2}+\partial _{zz})W=0, & \displaystyle\end{eqnarray}$$
 $$\begin{eqnarray}\displaystyle & (\partial _{t}+C(3k^{2}-\partial _{zz}))\partial _{z}W=-((1+f(t))k^{2}+Bk^{4})Z. & \displaystyle\end{eqnarray}$$
 $W_{j}^{n}=W(z_{j},t_{n}),j=0,\dots ,J,z_{j}=-\tilde{h}/\tilde{l}+\tilde{h}j/\tilde{l}J$
and
 $t_{n}=n{\it\delta}t$
and
 $Z^{n}=Z(t_{n})$
. The resulting map is of the general form
 $$\begin{eqnarray}\unicode[STIX]{x1D63C}\left(\begin{array}{@{}c@{}}W_{1}^{n+1}\\ W_{2}^{n+1}\\ \vdots \\ W_{J-1}^{n+1}\\ W_{J}^{n+1}\\ Z^{n+1}\end{array}\right)=\unicode[STIX]{x1D63D}(t_{n})\left(\begin{array}{@{}c@{}}W_{1}^{n}\\ W_{2}^{n}\\ \vdots \\ W_{J-1}^{n}\\ W_{J}^{n}\\ Z^{n}\end{array}\right),\end{eqnarray}$$
where
 $\unicode[STIX]{x1D63C}$
and
 $\unicode[STIX]{x1D63D}$
are
 $(J+1)\times (J+1)$
matrices given by
 $$\begin{eqnarray}\unicode[STIX]{x1D63C}=\left(\begin{array}{@{}ccccccc@{}}r & 1 & 0 & & & & \\ 1 & r & 1 & 0 & & & \\ 0 & 1 & r & 1 & 0 & & \\ \vdots & & & \ddots & & & \vdots \\ & & 0 & 1 & r & 1 & 0\\ & & & 0 & 2 & r & 0\\ & & & & & 0 & 1\end{array}\right)\end{eqnarray}$$
and
 $$\begin{eqnarray}\unicode[STIX]{x1D63D}=\left(\begin{array}{@{}ccccccccc@{}}c+C{\it\delta}t/{\it\delta}z^{2} & b & C{\it\delta}t/{\it\delta}z^{2} & 0 & & & & & \\ b & c & b & C{\it\delta}t/{\it\delta}z^{2} & 0 & & & & \\ C{\it\delta}t/{\it\delta}z^{2} & b & c & b & C{\it\delta}t/{\it\delta}z^{2} & 0 & & & \\ 0 & C{\it\delta}t/{\it\delta}z^{2} & b & c & b & C{\it\delta}t/{\it\delta}z^{2} & 0 & & \\ \vdots & & & & \ddots & & & & \vdots \\ & & 0 & C{\it\delta}t/{\it\delta}z^{2} & b & c & b & C{\it\delta}t/{\it\delta}z^{2} & 0\\ & & & & C{\it\delta}t/{\it\delta}z^{2} & b & c-C{\it\delta}t/{\it\delta}z^{2} & b+d & 0\\ & & & & & 2C{\it\delta}t/{\it\delta}z^{2} & b+e & c+g & \tilde{f}^{n}\\ & & & & & & 0 & {\it\delta}t & 1\end{array}\right).\end{eqnarray}$$
where
 $$\begin{eqnarray}\displaystyle & r=-(2+k^{2}{\it\delta}z^{2}) & \displaystyle\end{eqnarray}$$
 $$\begin{eqnarray}\displaystyle & \displaystyle b=1-2Ck^{2}{\it\delta}t-4C\frac{{\it\delta}t}{{\it\delta}z^{2}} & \displaystyle\end{eqnarray}$$
 $$\begin{eqnarray}\displaystyle & \displaystyle c=-(2+k^{2}{\it\delta}z^{2})+C\frac{{\it\delta}t}{{\it\delta}z^{2}}(6+4k^{2}{\it\delta}z^{2}+k^{4}{\it\delta}z^{4}) & \displaystyle\end{eqnarray}$$
 $$\begin{eqnarray}\displaystyle & \displaystyle d=C\frac{{\it\delta}t}{{\it\delta}z^{2}}(2-k^{2}{\it\delta}z^{2}) & \displaystyle\end{eqnarray}$$
 $$\begin{eqnarray}\displaystyle & e=1-4Ck^{2}{\it\delta}t & \displaystyle\end{eqnarray}$$
 $$\begin{eqnarray}\displaystyle & f^{n}=2{\it\delta}t{\it\delta}z((1+f(t_{n}))k^{2}+Bk^{4}) & \displaystyle\end{eqnarray}$$
 $$\begin{eqnarray}\displaystyle & \displaystyle g=-C\frac{{\it\delta}t}{{\it\delta}z^{2}}(2-k^{2}{\it\delta}z^{2})^{2}. & \displaystyle\end{eqnarray}$$
 $\unicode[STIX]{x1D63D}$
contains time dependence through the term
 $f^{n}(t_{n})$
.
The map (A 7) is iterated through one period,
 $T$
, of the drive, resulting in a map
 $\boldsymbol{W}^{N}=\unicode[STIX]{x1D63F}\boldsymbol{W}^{0}$
that takes
 $\boldsymbol{W}^{0}$
to
 $\boldsymbol{W}^{N}$
, where
 $N=T/{\it\delta}t$
. The eigenvalues of the matrix
 $\unicode[STIX]{x1D63F}$
then give the required Floquet multipliers.