I. INTRODUCTION
Ternary thin films composed of an early transition metal, silicon, and carbon (Me–Si–C) are used in applications such as protective coatings, Reference Zehnder, Matthey, Schwaller, Klein, Steinmann and Patscheider1–Reference Krzanowski and Wormwood3 electrical contacts, Reference Eklund, Emmerlich, Högberg, Wilhelmsson, Isberg, Birch, Persson, Jansson and Hultman4 printing heads, Reference Nakamori, Tsuruoka, Kanamori and Shibata5 and solar cells, Reference Schüler and Oelhafen6 due to their tribological Reference Munteanu, Ionescu, Olteanu, Munteanu, Davin, Cunha, Moura and Vaz7,Reference Rester, Neidhardt, Eklund, Emmerlich, Ljungcrantz, Hultman and Mitterer8 and electrical Reference Eklund9 properties. The thin film properties can be tailored by the choice of transition metal and changing the structure through the composition. If magnetron sputtering is used for the deposition of Me–Si–C thin films at temperatures below ∼700 °C, the structures of the films often range from nanocomposite to amorphous. The structure of these nanocomposites consists of nanosized metal carbide grains (nc-MeC) in an amorphous matrix of SiC or C (a-SiC/a-C). Reference Eklund, Emmerlich, Högberg, Wilhelmsson, Isberg, Birch, Persson, Jansson and Hultman4,Reference Nedfors, Tengstrand, Flink, Eklund, Hultman and Jansson10–Reference Cunha, Vaz, Moura, Munteanu, Lonescu, Rivière and Le Bourhis12 A general observation is that Si hinders the growth of MeC grains. Reference Andersson, Urbonaite, Lewin and Jansson13–Reference Koutzaki, Krzanowski and Nainaparampril16 At higher Si content, Me–Si–C can turn amorphous. An amorphous structure has been reported for several Me (e.g., in Ti, Reference Naka, Sakai, Maeda and Mori17 W, Reference Bertóti, Tóth, Mohai and Szépvölgyi2,Reference Endrino and Krzanowski18 Zr, Reference Krzanowski and Wormwood3,Reference Andersson, Urbonaite, Lewin and Jansson13,Reference Kádas, Andersson, Holmström, Wende, Karis, Urbonaite, Butorin, Nikitenko, Kvashnina, Jansson and Eriksson19 Nb, Reference Nedfors, Tengstrand, Flink, Eklund, Hultman and Jansson10 Cr, Reference Bertóti, Tóth, Mohai and Szépvölgyi2 and Mo Reference Krzanowski and Wormwood3 ) systems. Depending on the choice of transition metal and the deposition conditions, the amount of Si required for the formation of an amorphous structure varies. The Si content is thus important, but how Si disturbs the carbide crystallization and to what extent need further investigation.
We have recently deposited Nb–Si–C Reference Nedfors, Tengstrand, Flink, Eklund, Hultman and Jansson10 and Zr–Si–C Reference Andersson, Urbonaite, Lewin and Jansson13 films using the same magnetron sputtering system and deposition parameters except for a slightly higher substrate temperature of 350 °C for Nb–Si–C compared to 300 °C for Zr–Si–C. These two studies showed that an amorphous structure occurs for Si concentrations above 15 and 25 at.% for Zr–Si–C and Nb–Si–C, respectively. We have also reported that crystallization can be induced by the electron beam during transmission electron microscopy in both amorphous Zr–Si–C and Nb–Si–C. Reference Tengstrand, Nedfors, Andersson, Lu, Jansson, Flink, Eklund and Hultman20 By varying the dose and energy of the incident electrons, the observed crystallization was explained by atomic displacement events. Heating could be ruled out as the main cause of crystallization because the in situ annealed (400–600 °C) samples retained their amorphous state. This is a higher temperature than expected from the electron beam heating of the samples. Reference Tengstrand, Nedfors, Andersson, Lu, Jansson, Flink, Eklund and Hultman20–Reference Du, Takeguchi, Tanaka and Furuya22
These findings highlight the need for great care in imaging these kinds of materials for a correct structure characterization. The possibility to induce crystallization also opens up for a new way to design the materials on the nanoscale. There is, however, no previous systematic study reported to describe the effect of electron-beam irradiation of these materials. Further knowledge on the effect of Si content and C/Me ratio could lead to a deeper understanding of the crystallization mechanism in metal silicon carbides and thus be helpful for the appropriate choice of transition metal and composition when tailoring these materials. In the present study, we therefore investigate the role of the Si and C contents to explain their influence on the stability of amorphous Me–Si–C. We use in situ TEM since it allows observations on the atomic scale. Our findings lead to a model of the crystallization process in which electron irradiation causes the formation of MeC grains and Si segregates to the grain boundaries and the amorphous matrix.
II. EXPERIMENTAL DETAILS
Thin film samples deposited from elemental targets onto Si (001) by magnetron sputtering were used for the experiments in this study. Both Nb–Si–C and Zr–Si–C thin films were deposited in the same system under the same conditions except for a slight difference in temperature, 350 °C (Nb) and 300 °C (Zr). A description of the deposition process can be found elsewhere. Reference Nedfors, Tengstrand, Flink, Eklund, Hultman and Jansson10,Reference Andersson, Urbonaite, Lewin and Jansson13
TEM cross-sectional specimens were prepared from films deposited on the Si(001) substrates. The specimens were mechanically polished down to a thickness of ∼50 μm, followed by ion milling in a Gatan Precision Ion Polishing System (PIPS) using 5 keV Ar ions with a final polishing step with 2 keV Ar ions for 10 min. TEM images and diffraction patterns were then obtained using a FEI Tecnai G2 TF 20 UT with a field-emission gun operated at an acceleration voltage of 200 kV. The crystallization process was performed at ambient temperature with the electron beam focused on a disc with a diameter of ∼100 nm. The electron beam current was estimated by measuring the current through the fluorescent viewing screen with the entire beam focused on this area. By also measuring the time, the film was exposed to the beam the current density and the electron dose could be calculated.
Elemental maps and Z-contrast images using energy-dispersive x-ray (EDX) spectrometry and scanning TEM (STEM), respectively, were obtained using the double Cs-corrected (image and probe) Linköping Titan3 G2 60-300 HR-TEM.
To determine the crystallized phases, the rotational average of several different fast Fourier transforms (FFT) was summed for each sample. The FFTs were filtered with an average background subtraction filter (ABSF) to remove the amorphous component. A description of the ABSF can be found elsewhere. Reference Kilaas23 The backgrounds from the rotational average were removed manually and the scale was calibrated from the images of the single crystal Si substrate. Also selected area electron diffraction (SAED) from larger crystallized areas was used for selected samples to confirm the crystallized phase.
III. RESULTS AND DISCUSSION
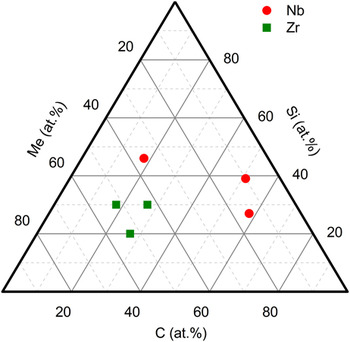
Figure 1 shows the composition of the samples as determined in Refs. Reference Nedfors, Tengstrand, Flink, Eklund, Hultman and Jansson10 and Reference Andersson, Urbonaite, Lewin and Jansson13 for the Nb–Si–C and Zr–Si–C samples, respectively. In each material system, three different samples are analyzed to determine the effects of Si and C contents. The Nb–Si–C samples have a higher Si content compared to the Zr–Si–C samples since this is required to obtain an amorphous material.
Composition of the investigated samples in this study.

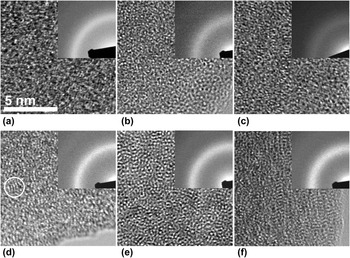
Figure 2 shows HRTEM images of the Me–Si–C samples in the as-deposited state. The microscopy was made by first focusing the sample in one area, then move the sample to an unexposed area, and quickly record the image. In Figs. 2(a)–2(c), the Nb–Si–C samples with the composition of Nb.36Si.46C.18, Nb.10Si.39C.51, and Nb.15Si.27C.58 are presented, respectively. Figures 2(d)–2(f) show the Zr–Si–C samples with the composition of Zr.52Si.30C.18, Zr.43Si.30C.27, and Zr.53Si.20C.27, respectively. All samples are amorphous. Some short-range order, such as the area within the indicated circle in Fig. 2(d), can be seen. To ensure that the films are amorphous, low-dose imaging at several places in the film and at different tilting angles was made. This is relevant since grains in some crystal orientations can appear amorphous Reference Fager, Andersson, Lu, Jöesaar, Odén and Hultman24 and therefore could lead to misinterpretation of the HRTEM results. Together with the information from SAED, which show an amorphous structure with only broad rings present, we can conclude that the samples in their as-deposited state are completely amorphous.
HRTEM images from (a) Nb.36Si.46C.18, (b) Nb.10Si.39C.51, (c) Nb.15Si.27C.58, (d) Zr.52Si.30C.18, (e) Zr.43Si.30C.27, and (f) Zr.53Si.20C.27 samples in their as-deposited state. The samples are amorphous with some short-range order as shown with a circle in (d). The insets of the corresponding SAED patterns confirm the amorphous structures.

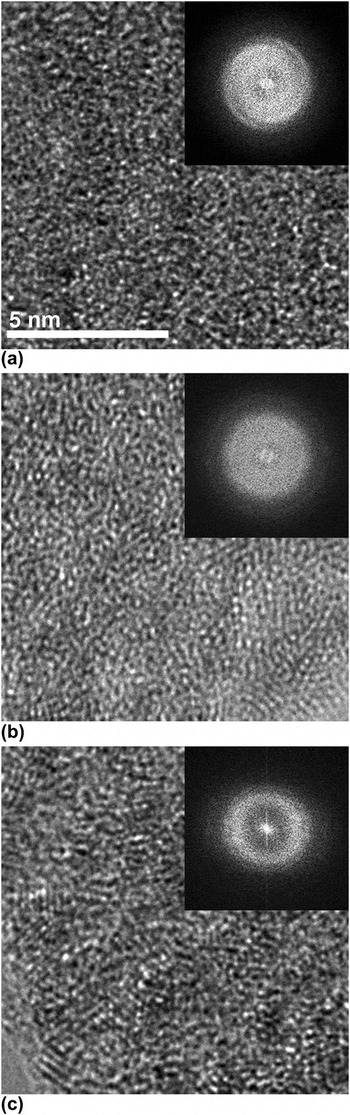
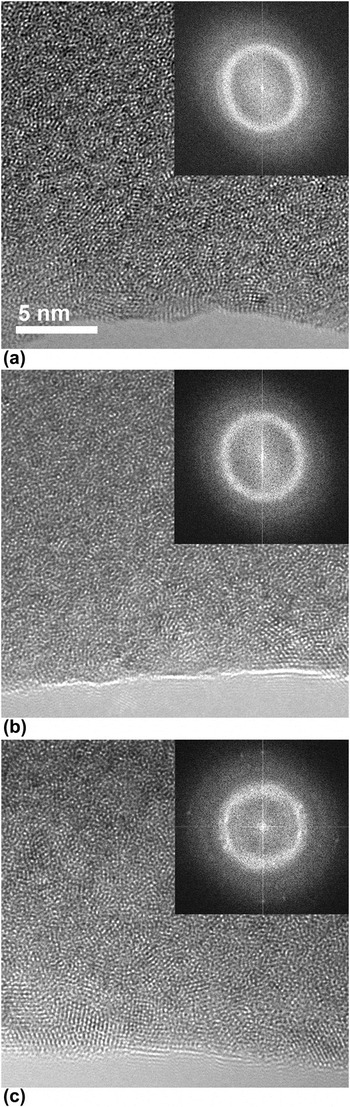
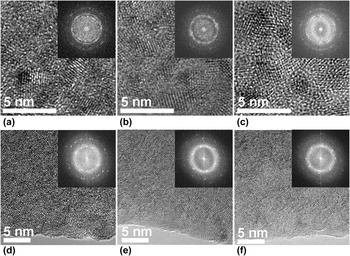
Figure 3 shows the images of (a) Nb.36Si.46C.18, (b) Nb.10Si.39C.51, and (c) Nb.15Si.27C.58 films after a dose of 4.2 × 10⁸ e−/nm2, which was the lowest dose at which crystallization by certainty could be detected in any of the Me–Si–C samples. The crystallization is most progressed for the sample with the lowest Si content [Fig. 3(c)]. For the Nb.10Si.39C.51 film in (b), there is a tendency for the crystallization to have started, while the Nb.36Si.46C.18 film in (a) remains amorphous. At a dose of 4.2 × 10⁸ e−/nm2 also all the Zr–Si–C films are still amorphous. To observe the effects of increased electron exposure, the samples needed an exposure to a higher dose of 1.9 × 10⁹ e−/nm2. The images of the resulting structure are shown in Fig. 4. Also here the sample with lowest Si content [Fig. 4(c)] exhibits the highest degree of crystallization. The result that Zr–Si–C needs ∼4.5 time higher dose than Nb–Si–C before the crystallization process starts clearly shows that Zr–Si–C samples are more stable against crystallization than Nb–Si–C.
Comparison between (a) Nb.36Si.46C.18, (b) Nb.10Si.39C.51, and (c) Nb.15Si.27C.58 samples at the lowest dose (4.2 × 10⁸ e−/nm2) at which crystallization could be detected in any of the Nb–Si–C samples. The insets show the center part of the FFT of the corresponding images.

Comparison between (a) Zr.52Si.30C.18, (b) Zr.43Si.30C.27, and (c) Zr.53Si.20C.27 samples at the lowest dose (1.9 × 10⁹ e−/nm2) at which crystallization could be detected in any of the Zr–Si–C samples. The insets show the center part of the FFT of the corresponding image.

In our previous study, Reference Tengstrand, Nedfors, Andersson, Lu, Jansson, Flink, Eklund and Hultman20 we investigated the effect of electron energy, dose, and beam heating. It was found that the irradiation of the sample with 80 keV electrons lowered the crystallization rate compared to 200 keV. In situ annealing in TEM of Nb.10Si.39C.51 showed that thermally induced crystallization starts between 400–600 °C. For Zr–Si–C, in situ annealing in x-ray diffractometer in a vacuum furnace (base pressure 5 × 10⁻⁵ Pa) showed thermally induced crystallization between 500–700 °C. Reference Andersson, Urbonaite, Lewin and Jansson13 However, the increase in the temperature by the electron beam is not expected to be so high. Reference Tengstrand, Nedfors, Andersson, Lu, Jansson, Flink, Eklund and Hultman20–Reference Du, Takeguchi, Tanaka and Furuya22 Thus, we drew the conclusion Reference Tengstrand, Nedfors, Andersson, Lu, Jansson, Flink, Eklund and Hultman20 that atomic displacement is the main cause of crystallization during electron microscopy studies.
The determination of the nanocrystalline fraction is challenging due to varying parameters with focusing conditions and unknown sample thickness. The thickness is of importance since surface effects may affect the crystallization. Reference Egerton, Li and Malac25 The surface atoms are more loosely bonded and sputtering, and increased mobility at the surface is therefore possible. Direct measurements of the thickness in TEM are difficult; however, since the samples, which are prepared in the same way, always are viewed at the edge of the specimens (i.e., thickness approximately the same), and the initial conditions are the same, a qualitative comparison is possible. This study thus only qualitatively separates the crystallization between different samples.
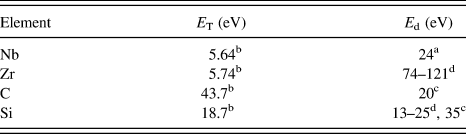
The probability of displacement is related to the maximum transferable energy (E T) between the colliding electron and atom together with the binding energy in the material. E T is dependent on the atomic number and the electron acceleration voltage and an equation for calculating the values of E T is given by e.g., Egerton et al. Reference Egerton, Li and Malac25 The calculated values of E T using this equation with 200 keV incoming electrons for the materials investigated here are listed in Table I. As seen, more energy can be transferred to lighter elements. Since the atoms are randomly distributed in the amorphous films, the displacement energy (E d) can have different values for the same element depending on the atomic position. Reference Stratton, Hamann, Perepezko and Voyles26 An estimation of the displacement energies can be given from displacement energies for the materials in the crystalline structure. For the elements investigated here, the corresponding values are listed in Table I. Here we see that it is not likely for Zr or Nb to be displaced while C can easily be displaced. Si can also be displaced since displacement and amorphization have been seen in crystalline Si for electron beam energies above 140 keV. Reference Edmondson, Weber, Namavar and Zhang27 Moreover, it is possible for secondary events to occur, where one displaced carbon atom can transfer energy to a Si atom. This has been observed in SiC in which up to 84% of the energy from a carbon atom can be transferred to a Si atom causing displacement. Reference Bae, Ishimaru and Hirotsu28
The maximum transferable energy (E T) at 200 keV, together with the displacement energy (E d).

a From Table 4.3 in Ref. Reference Williams and Carter37.
b Calculated from Eq. (2) in Ref. Reference Egerton, Li and Malac25.
When an atom is displaced in an amorphous material, density fluctuations will occur. Reference Nagase, Sanda, Nino, Qin, Yasuda, Mori, Umakoshi and Szpunar29,Reference Fu, Carter, Martin, Xie, Zhang, Wang, Littleton and Shao30 Atoms in the vicinity will then move into the underdense region to neutralize the density fluctuations. This can explain the motion of Me atoms, which is needed to form crystallites. Even if the addition of heat from an inelastically scattered electron is not in itself enough to cause crystallization, it could increase the diffusion of atoms in the material leading to faster crystallization. Thus, all the elements in the material can move, but only Si and C are likely to be directly displaced by the electron-beam.
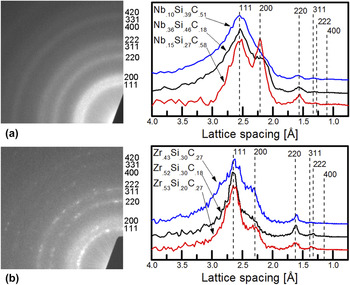
Eventually, the structure stabilizes and the final state is shown in Fig. 5. All films have equiaxed grains. For the Nb–Si–C samples, the grains are smaller (2–5 nm) compared to the Zr–Si–C samples (5–7 nm). Figure 6 shows SAED patterns for the (a) Nb.10Si.39C.51 and (b) Zr.52Si.30C.18 samples together with the results of the normalized sum of the rotational average of several FFT patterns for all the films of Nb–Si–C and Zr–Si–C. Since the shape of the peaks can be affected by the sampling statistics of grains under the area of inspection and background subtraction, especially for the reflections within the band of intensity from the broad peak of the remaining amorphous material, we here focus on the detection of the peaks. In all the cases, an fcc structure, as indicated in the figures, is the best match to the patterns. This structure was confirmed by measuring the angles and plane distances in the larger Zr–Si–C grains. For the Nb–Si–C and Zr–Si–C films, the lattice parameter was found to be 4.42 and 4.58 Å, respectively. The best match with the measured lattice parameters is from the respective MeCs (NbC, 4.46 Å (ICDD, PDF card 65-7964), and ZrC, 4.69 Å (ICDD, PDF card 35-0784)). At continued electron irradiation, displacements will also occur within the MeC grains until a balance is obtained with the relaxation rate of atoms into the crystal structure or, as possible for carbon, to jump between vacant positions in the understoichiometric structure.
The final state of (a) Nb.36Si.46C.18, (b) Nb.10Si.39C.51, (c) Nb.15Si.27C.58, (d) Zr.52Si.30C.18, (e) Zr.43Si.30C.27, and (f) Zr.53Si.20C.27, samples after a longer time of irradiation (Zr–Si–C ∼4 × 10¹⁰ e−/nm2, Nb–Si–C ∼2 × 10¹⁰ e−/nm2) at which the structure has stabilized. The insets show the center part of the FFT of the corresponding image.

SAED (left) and rotational average from FFT (right) for crystallized (a) Nb–Si–C and (b) Zr–Si–C. All patterns can be matched to the marked NaCl structure of respective MeC.

The most clearly seen effect is that of the choice of transition metal. All Nb–Si–C films in this study crystallize at lower dose than Zr–Si–C samples regardless of composition. Zr thus gives a more stable amorphous structure than Nb. This can be correlated to the glass-forming ability of the material. Theories for glass-forming ability emphasize the large difference in atomic radius for the constituent elements in the material. Reference Inoue and Takeuchi31 Zr has a larger atomic radius (1.597 Å) compared to Nb (1.456 Å), Reference Toth32 which could explain the higher stability of amorphous Zr–Si–C. Another possible explanation can be found from the bond-strength between different atoms in the material. The strength of Me–C bonds decreases by moving from period 4 to period 5 in the periodic table, Reference Jansson and Lewin33 meaning that the Zr–C bonds will be more stable than Nb–C.
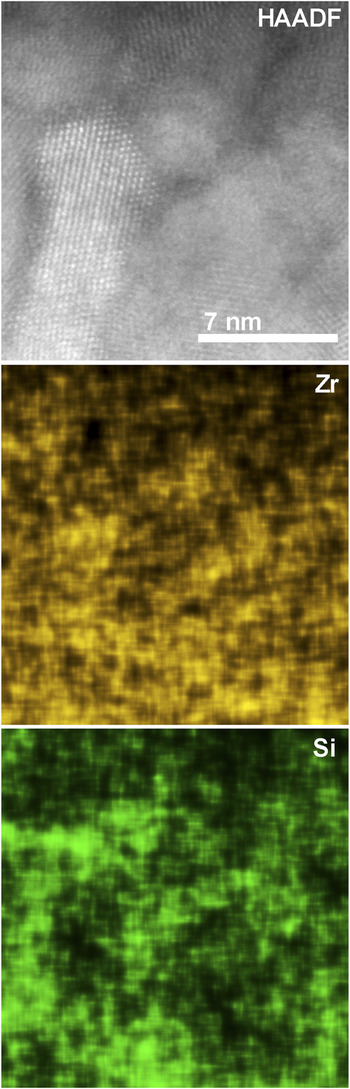
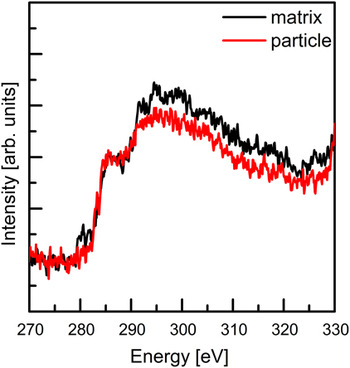
The samples with lower Si content crystallize faster. This effective stabilization of the amorphous structure is consistent with observations from nanocomposite Me–Si–C films, where Si disturbs the MeC grain growth. Also the higher amount of strong Si–C bonds, which makes atomic displacements in the material more difficult, could be a reason for the slower crystallization rate with higher Si concentration. Figure 7 shows the Zr and Si distribution as measured by STEM EDX-mapping for Zr.52Si.30C.18 after irradiation in a TEM mode for a dose of ∼4 × 10¹⁰ e−/nm2. The mapping shows a higher Zr concentration within the grains while Si is concentrated in the surrounding matrix. Electron energy-loss spectrometry (EELS) spectra of the C–K edge summed from STEM EELS mapping over a crystalline grain and an amorphous matrix region of the same sample (Zr.52Si.30C.18), respectively, are shown in Fig. 8. The edges at 285 and 290 eV are representative for sp 2 and sp 3 bonded C, respectively. Reference Urbonaite, Wachtmeister, Mirguet, Coronel, Zou, Csillag and Svensson34 The spectrum indicates that the relative amount of sp 3 C bonds is higher in the matrix phase. This supports the EDX results (see Fig. 7) that the matrix is rich in Si, which promote the formation of sp 3 C bonds. Reference Bertóti, Tóth, Mohai and Szépvölgyi2,Reference Mukherjee35 The seen segregation of Si can be explained by the very low solubility of Si in transition metal carbides, Reference Jansson and Lewin33 which makes Si atoms become expelled during the formation of MeC grains.
STEM high-angle annular dark-field (HAADF) image, with the corresponding elemental EDX map of Zr and Si. The concentration of Si is seen to be higher in the matrix phase while Zr is mainly present within the crystallites.

EEL spectrum of the C K-edge for a crystalline grain and the matrix phase of Zr.52Si.30C.18 after electron irradiation. The edges seen at 285 and 290 eV indicate a higher amount of relative sp 3 C bonds in the matrix phase.

By comparing samples with approximately the same Si content, we observe that the carbon content does not significantly influence the crystallization rate for any of the two material systems. This can depend on either that (i) carbon is a light and small element and therefore easy to migrate and/or (ii) MeC x that forms has at least the wide range of stoichiometry known from phase diagrams (0.72 < x < 1.0 (Ref. Reference Toth32) for NbC x and 0.61 < x < 1.0 (Ref. Reference Okamoto36) for ZrC x ), such that the C-concentration is of less importance for the formation of MeC.
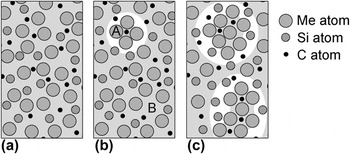
Figure 9 shows our proposed model for the crystallization process based on the present results. In the initial crystallization stage, the samples have a random distribution of atoms in an amorphous state as shown in Fig. 9(a). During initial electron irradiation, a grain has nucleated in the place marked A in Fig. 9(b). Also shown in (b) is a site from which a C atom has been removed through atomic displacement (marked B) creating a density fluctuation that increases the ability of the surrounding Me atoms to move into this empty position and form a carbide crystallite by nucleation and growth. The growing MeC grains require less molar volume compared to the starting amorphous matrix, which increases the length by which atoms from the neighboring matrix need to migrate. This together with the increase in the concentration of Si at the carbide/matrix interface reduces the crystallization rate. At a certain build up in the Si concentration [Fig. 9(c)], further grain growth is no longer possible because of the yet longer ranges to cover. Possibly, the slower interdiffusion of C and Me atoms through the Si-enriched effective tissue phase also eventually causes crystallization to stop. Effectively, the crystallization process becomes self-terminated for grain sizes at or above a few nm.
Proposed model for crystallization: (a) as-deposited, (b) after initial electron irradiation, which initiates the crystallization process, and (c) final state. In (b), A marks a place of initial crystallization and B a density fluctuation caused by atomic displacement. White areas surrounding the MeC grains are to illustrate a less dense matrix.

IV. CONCLUSIONS
We have shown that electron-induced crystallization takes place in amorphous Me–Si–C systems. Depending on the choice of metal, the crystallization starts after different amounts of electron doses. Zr has a more stable amorphous carbide structure than Nb due to its higher glass-forming ability. Si stabilizes the amorphous material and delays the crystallization. The crystallization process and its self-termination are explained by a model, where MeC grains nucleate and grow, but segregation of Si to the carbide/matrix interface eventually hinders the Me and C diffusion.
ACKNOWLEDGMENTS
Work was performed within the VINNEX Center FunMat supported by The Swedish Agency for Innovation Systems (VINNOVA). The Knut and Alice Wallenberg Foundation supported the electron microscopy laboratory at Linköping operated by the Thin Film Physics Division. O.T., P.E., and U.J. also acknowledge support from the Swedish Foundation for Strategic Research (SSF) through the Synergy Grant FUNCASE.